

Disney Data Dump November 11 2026
Observed Crowd Levels November 3 – 9
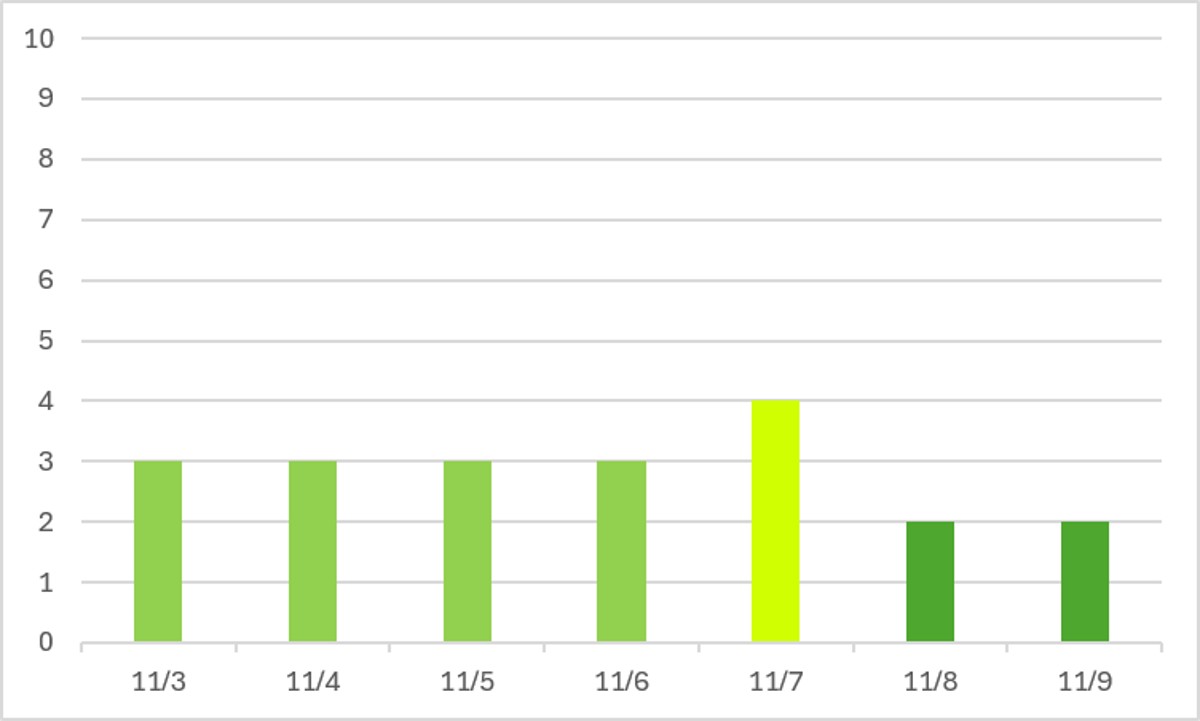
And that, dear readers, was Jersey Week. I called out that last week was the crazy-lowest crowds we had ever seen for late October/early November. And therefore, we should expect some increase for Jersey Week, but not wild-high crowds. And that’s exactly what happened. Jersey Week usually increases crowds by 2 levels compared to the week before it. And that’s what held true this year. We went from crowd level 1-2 to crowd level 3-4. So Jersey Week is absolutely still a thing, but in a year with historically low baseline crowds, it doesn’t mean that the parks will magically be miserable.

A lot of those out-of-town visitors were hanging out at Magic Kingdom and EPCOT. The first MVMCP dates were on the 8th and 9th, which drew crowd levels and wait times back down at Magic Kingdom. But the same effect didn’t happen at Hollywood Studios during the first Jollywood Nights of the year on the 7th. I called out that this is normal behavior since day guests can still see Fantasmic before leaving the park.
Performance of Crowd Level Predictions
Each week, I give you a very transparent look into how the TouringPlans crowd level predictions performed. Each day at each park is one data point, so each week we have 28 different crowd level predictions to evaluate. Any time a prediction is within one or two crowd levels, things won’t really “feel” much different than what was predicted. Being off by 3 or more crowd levels is where you might feel that difference in wait times throughout the day.
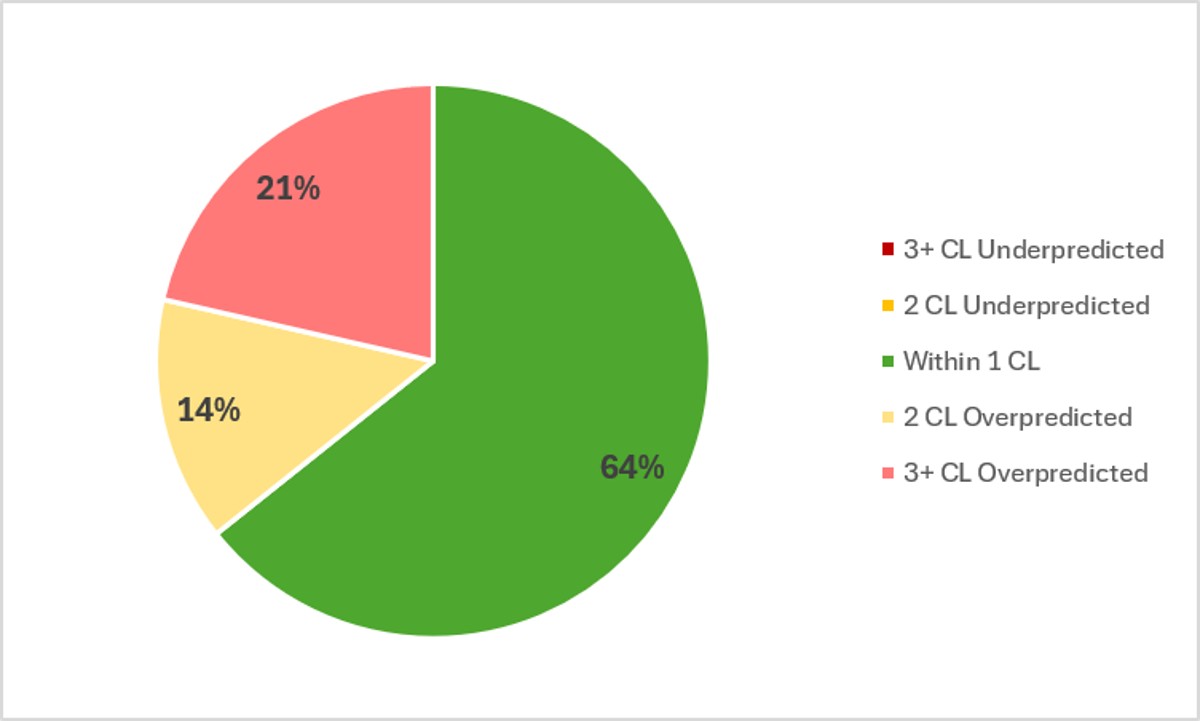
In the past week, Touring Plans predictions were either spot-on or within 1 crowd level 64% of the time, which is slightly better than last week. And 78% of the time Touring Plans predictions were within 2 crowd levels, so that’s a C+ on predictions for the last week. And the results are still very skewed toward overpredictions. In fact, in the past week, every park day was an average of 1.4 crowd levels less crowded than predicted. The fact that crowds and wait times are still underperforming by this much is pretty unprecedented. The biggest miss of the week was an overprediction by 4 crowd levels, which happened four different times – on November 8th at 9th, across three different parks.
Attraction Downtime November 3 – 9
If we average all of the capacity lost due to unexpected downtime over the past week, it comes out to 4% of attractions unexpectedly being down. That’s a significant decrease from last week, thanks to mostly clear weather! And over the past week, Hollywood Studios was the park with the worst overall downtime, averaging 5.3% of its capacity lost to downtime. And EPCOT was the only other park with downtime over 4%.
The worst day for attraction downtime in the past week was on November 7th. On that day, 5% of all capacity at WDW was lost due to unexpected downtime. That’s one of our lowest “winning” days in a long time! And the worst park-day of the past week was a predictable combination of our worst park and worst day – on November 7th at Hollywood Studios, when 10% of its capacity was lost due to unexpected downtime. Hollywood Studios was open for 10.5 hours on the 7th, so 10% downtime is the equivalent of the entire park shutting down for 63 minutes. That’s like Disney deciding same-day to shut the park down an hour earlier than expected for Jollywood Nights!
Attraction Downtime Worst Offender
Stop the press. For the first time in “forever” Test Track has been dethroned from its downtime worst offender spot. Because this week, Rise of the Resistance had a truly terrible performance (get the hook) with 27% of its capacity lost due to unexpected downtime. Yikes! Its worst day of the past week was on November 7th, when it was down for 59% of the day. But it was also down 41% of November 5th and 32% of November 3rd. Lots of sporadic unreliability.
Good ole reliably unreliable Test Track was still in 2nd place this week, with over 15% downtime. No other attraction in any WDW park had over 10% downtime for the week.

Rope Drop Downtime
Here are problematic offenders from the past week, with the percentage of downtime during the first hour of the day in parentheses:
- Magic Kingdom: The Many Adventures of Winnie the Pooh (18%), Jungle Cruise (14%), Big Thunder Mountain (13%), Haunted Mansion (12%), Pirates of the Caribbean (12%)
- EPCOT: Spaceship Earth (20%), Test Track (16%)
- Hollywood Studios: Rise of the Resistance (60%), Rock’n’Roller Coaster (13%), Star Tours (11%), Runaway Railway (11%)
- Animal Kingdom: No rope drop downtime issues this week!
Not a terrible week for rope drop downtime issues, other than that one headliner with that one BIG downtime number (looking at you, Rise). Animal Kingdom even gets an increasingly rare gold star for having no rope drop downtime issues this week!
Early entry attractions did pretty well at Magic Kingdom this week, with most of the rope drop troubles happening on the “left side” of the park. And EPCOT only had one major headliner on the list, plus some continued struggles from Spaceship Earth.
Wait Times November 3 – 9
Attractions with the Highest Average Posted Wait at Each Park
- EPCOT: Cosmic Rewind, average posted wait of 68 minutes (was 60 minutes last week)
- Hollywood Studios: Slinky Dog Dash, average posted wait of 57 minutes (was 44 minutes last week)
- Magic Kingdom: TRON, average posted wait time of 50 minutes (was 43 minutes last week)
- Animal Kingdom: Flight of Passage, average posted wait time of 43 minutes (was 34 minutes last week)
See? Definitely some significant increases in wait times compared to last week. But, also, in the context of “normal” wait times, these are still pretty incredibly low. In fact, Cosmic Rewind was still the only WDW attraction with an average posted wait of over an hour in the past week. That’s wild. Perhaps even crazier? There were five EPCOT attractions with higher posted wait times than Flight of Passage (or anything else) over at Animal Kingdom. In fact, 5 of the top 10 wait times at WDW this week were at EPCOT, followed by 3 at Hollywood Studios, and one each at Magic Kingdom and Animal Kingdom.
Parks with the Highest and Lowest Average Wait
- Highest: Hollywood Studios, average park-wide posted wait of 35 minutes (was 28 minutes last week)
- Lowest: Magic Kingdom, average park-wide posted wait of 21 minutes (was 17 minutes last week)
Here again we see those increases compared to the rock-bottom results of last week. But every park other than Hollywood Studios still had average posted waits under half an hour. They were all just roughly 25% higher than last week. That makes a big difference in how much time you’ll ultimately spend in lines throughout a park day.
Most Inflated Posted Wait Times
We all know that Disney inflates their posted wait times on purpose. They have many reasons for doing this. Some are totally understandable, and some are potentially more problematic. We can figure out how much posted wait times are being inflated by comparing submitted actual wait times from the Lines App and the posted wait time when the person timing their wait entered the line.
Over the past week, actual wait times in the Lines App averaged 75% of what was posted. That’s back to a bit above our historical average in the era of Lightning Lanes. That means that posted waits were less inflated than usual. Overall, if the posted wait time at a popular attraction was 60 minutes, you could’ve expected to wait almost exactly 45 minutes instead.
But the worst inflation offender for the past week was Gran Fiesta Tour. At this one attraction, submitted actual wait times were only 34% of posted wait times in the past week. That means that if the caballeros had a 10 minute posted wait, you probably would have actually only waited less than 4 minutes instead. About a third of what was posted.

This Week’s Wait Time Rock Star
Between November 3rd and 9th we had just under 900 timed actual waits submitted through the Lines app. And the person who recorded the most actual waits during that time was kirstymarks, with 29 overall timed waits – and it was in hard mode with all standby waits! Thanks for all of that timing, kirstymarks! It unfortunately does not compete with the the 97 timed waits in a single week from our current timing champion, preef.
Looking Ahead: November 10 – 16
I write this article on Tuesday evenings so that you all have the very freshest of data on Wednesdays. That means the 10th will already be in the past by the time you’ve read this, so we’ve done a bit of time travel!
We’re firmly into Christmas season now, with the “official” start of Christmas at WDW on November 13th! Parties at MK and HS have both already started, but on the 13th we get Jingle Cruise and Frozen Holiday Surprise at Magic Kingdom, Sunset Seasons Greetings at Hollywood Studios, and the Merry Menagerie at Animal Kingdom.
Jollywood doesn’t have as much of an impact on daytime crowds as MVMCP because the park stays open a little later, and daytime guests can still see Fantasmic before they leave the park for the night. That being said, there are Jollywood parties on the 14th and 16th, so expect slightly increased crowds on the 15th at Hollywood Studios.
Mickey’s Very Merry Christmas Party does have a big impact on crowds at Magic Kingdom, and this week there are parties on the 12th, 13th, and 15th. That means you’ll see the highest MK crowds of the week on the 14th.
The one exception to that? Christmas Parade filming! Which is happening this year on the 10th and 11th. Main Street will be crazy crowded during the afternoon on both of those days for filming, but it’s a great opportunity to see the parade without party tickets.
There is currently no rain in the forecast for the upcoming week! Wonder of wonders. And things are going to cool off significantly as we head into the weekend, with a high in the mid-60s on Saturday. Those mornings in the low 50s are going to feel cool. You may not feel like you need to prepare, but you absolutely should. Especially in Animal Kingdom, the humidity can make 50 feel downright chilly.
Were you in the parks this past week? Or are you headed to Orlando soon? Let me know in the comments below!
You May Also Like...
-

We've definitely crossed from “huh, crowds are kind of low” into “this is getting really unusual” territory this week. And now…
-

Veterans Day week at Walt Disney World came with exactly the kind of whiplash we should expect by now: a busy…
