

Disney Data Dump November 4 2026
Observed Crowd Levels October 27 – November 2
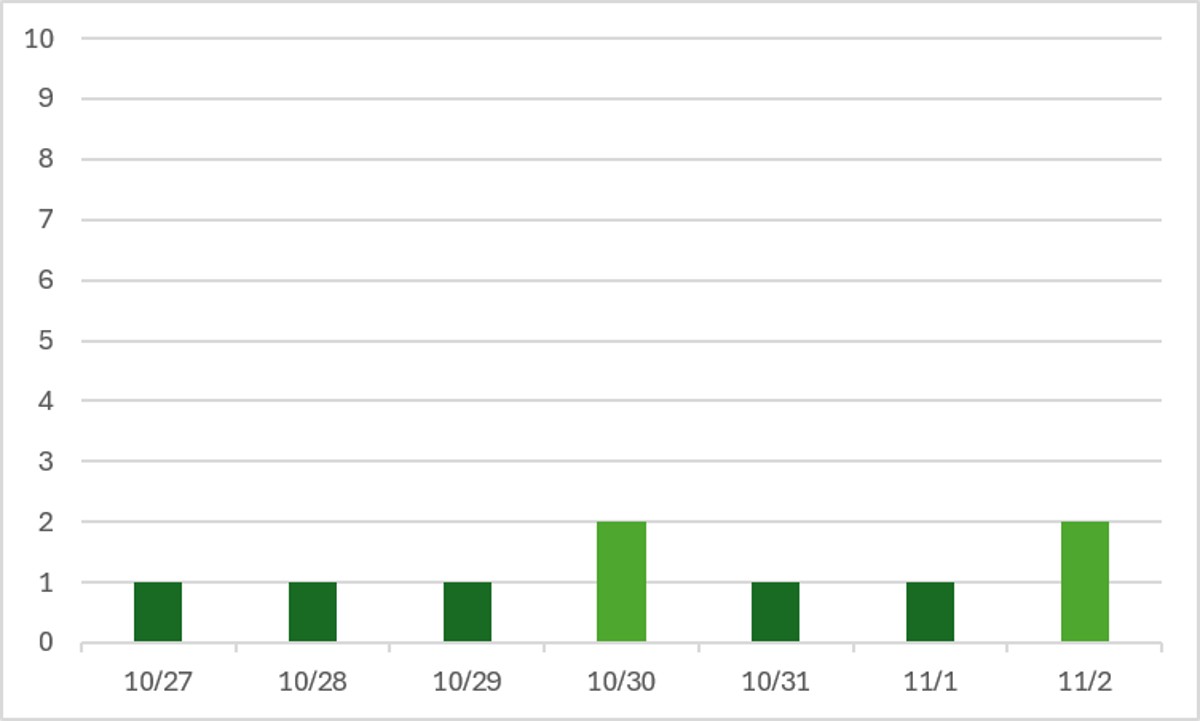
Friends. Folks. Neighbors. This is a ridiculous result for late October and early November. We haven’t had an end-of-October/start-of-November this uncrowded since during the pandemic. I can’t exaggerate how weird this is. Normally we see a slow summer and warn you that things will pick back up in the fall. And they have … slightly. But this looks like summer crowds, not October crowds.

Look at how absurd the park-by-park view is! You can barely even tell when Halloween parties were held (27th, 29th, and 31st, fwiw). Only one park got above a crowd level 2 on any day this week … and even then it only hit a crowd level 3. Some of these days were definitely impacted by poor weather keeping people away from the parks (especially on the 2nd), but weather doesn’t explain all 7 days. These are just unusually empty parks.
Performance of Crowd Level Predictions
Each week, I give you a very transparent look into how the TouringPlans crowd level predictions performed. Each day at each park is one data point, so each week we have 28 different crowd level predictions to evaluate. Any time a prediction is within one or two crowd levels, things won’t really “feel” much different than what was predicted. Being off by 3 or more crowd levels is where you might feel that difference in wait times throughout the day.
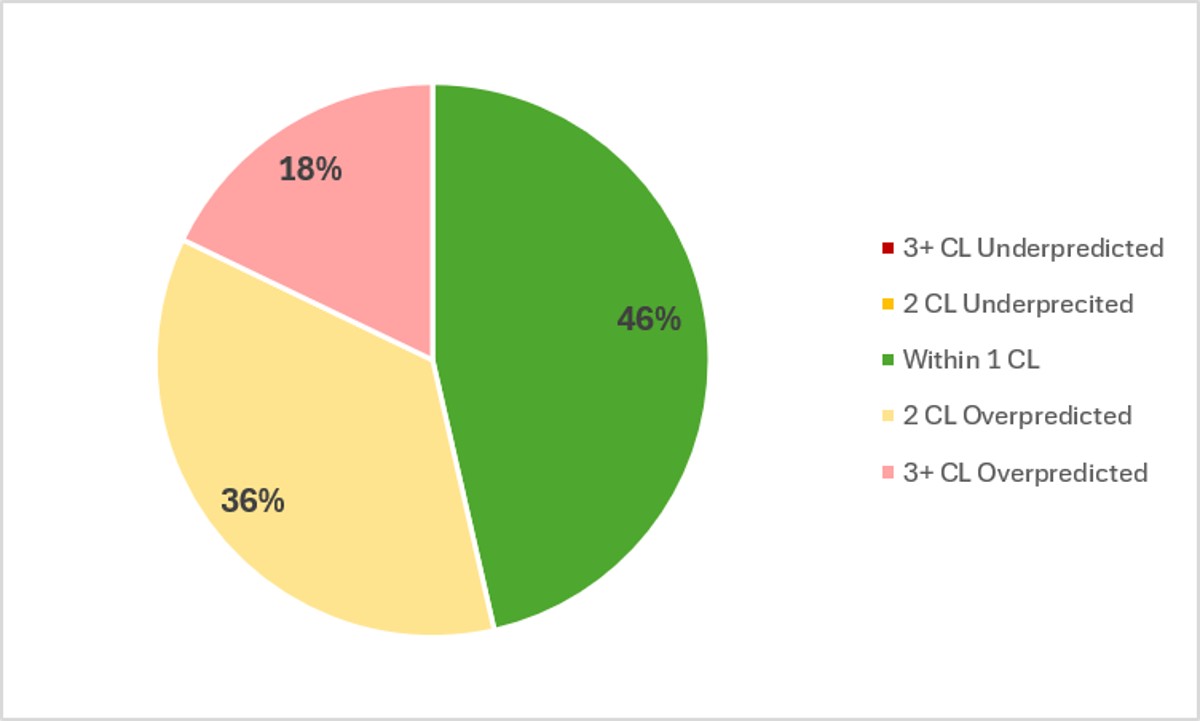
In the past week, Touring Plans predictions were either spot-on or within 1 crowd level 46% of the time, which is much worse performance than we’ve been seeing for the rest of October. And 82% of the time Touring Plans predictions were within 2 crowd levels, so that’s a B- on predictions for the last week. Once again, I’ll remind you all that this is after Len updated models several times this summer, mostly tuning predictions down for unexpectedly low crowds. And now in the past week, every park day was an average of 1.8 crowd levels less crowded than predicted. The fact that crowds and wait times are still underperforming by this much is totally wild. The biggest miss of the week was an overprediction by 4 crowd levels, which happened twice – at Magic Kingdom on November 2 (predicted to be 5, but actual was 2) and at Animal Kingdom on October 31st (predicted to be 4, but actual was 1).
Attraction Downtime October 27 – November 2
If we average all of the capacity lost due to unexpected downtime over the past week, it comes out to 5.6% of attractions unexpectedly being down. That’s back up near our summertime average, thanks to rainy weather. And over the past week, EPCOT was the park with the worst overall downtime, averaging 6.3% of its capacity lost to downtime. All other parks had downtime averages that were just under 5%.
The worst day for attraction downtime in the past week was on November 2nd (the day of the deluge). On that day, 9% of all capacity at WDW was lost due to unexpected downtime. But the worst park-day of the past week was actually on October 28th, over at EPCOT, when 11% of its capacity was lost due to unexpected downtime. EPCOT was open for 12 hours on the 28th, so 11% downtime is the equivalent of the entire park shutting down for 79 minutes. That’s almost an hour and a half of the 12-hour day!
Attraction Downtime Worst Offender
For those that have been following along at home for any number of the past weeks or months, the top downtime winner is not going to come as surprise this week. Because yet again it’s … Test Track! And unfortunately, all of the rain this week means it had a big increase in downtime – 26% of the week. That’s after 15% and 17% downtime each of the past two weeks. Its worst day of the past week was on November 2nd, when it was down for 56% of the day. But it was also down over half of the day on November 1st.
No other attraction had more than 15% downtime this week. Spaceship Earth, Frozen Ever After, Rise of the Resistance, and Rock’n’Roller Coaster had over 10% downtime though. All four of those are indoor attractions, which means that weather isn’t fully to blame for the higher downtime number this week.

Rope Drop Downtime
Here are problematic offenders from the past week, with the percentage of downtime during the first hour of the day in parentheses:
- Magic Kingdom: TTA PeopleMover (26%), Big Thunder Mountain (24%), Tiana’s Bayou Adventure (22%), Pirates of the Caribbean (11%), Peter Pan’s Flight (11%)
- EPCOT: Test Track (29%), Spaceship Earth (24%), Living with the Land (15%), The Seas with Nemo (10%)
- Hollywood Studios: Rock’n’Roller Coaster (46%), Rise of the Resistance (22%)
- Animal Kingdom: Kilimanjaro Safaris (11%)
Overall, we had a mixed bag for rope drop downtime this week. The lists at every park aren’t too long, but there are some big headliners with big downtime numbers here. If Rock’n’Roller Coaster continues to have close to 50% rope drop downtime when it converts to its holiday overlay, that’s going to have a big impact on wait times throughout the day.
Wait Times October 27 – November 2
Attractions with the Highest Average Posted Wait at Each Park
- EPCOT: Cosmic Rewind, average posted wait of 60 minutes (was 67 minutes last week)
- Hollywood Studios: Slinky Dog Dash, average posted wait of 44 minutes (was 58 minutes last week)
- Magic Kingdom: TRON, average posted wait time of 43 minutes (was 52 minutes last week)
- Animal Kingdom: Flight of Passage, average posted wait time of 34 minutes (was 38 minutes last week)
Last week I called out huge wait time drops at headliners compared to the week before … and then this week they dropped by pretty huge amounts (10-24%). Cosmic Rewind was the only attraction that had an average wait time of an hour or more, and it just barely hit that mark. These are crazy-low average wait times for headliners at WDW. These are wait times that we might sometimes see during the summer when the parks are too hot for people to want to visit. They are not wait times that we see in the fall. Unless a hurricane has kept people away. That didn’t happen this week, so these are crazy waits.
Parks with the Highest and Lowest Average Wait
- Highest: Hollywood Studios, average park-wide posted wait of 28 minutes (was 32 minutes last week)
- Lowest: Magic Kingdom, average park-wide posted wait of 17 minutes (was 20.5 minutes last week)
Once again, major drops in park-wide average waits compared to last week, which were already big drops compared to the previous week. For reference, Animal Kingdom and EPCOT both had average waits of 20 minutes. That means not only was every single park under the “very uncrowded” mark of 30 minutes, but three parks were 20 minutes or less. We haven’t seen results like that since early July!
Most Inflated Posted Wait Times
We all know that Disney inflates their posted wait times on purpose. They have many reasons for doing this. Some are totally understandable, and some are potentially more problematic. We can figure out how much posted wait times are being inflated by comparing submitted actual wait times from the Lines App and the posted wait time when the person timing their wait entered the line.
Over the past week, actual wait times in the Lines App averaged 71% of what was posted. That’s quite a bit below our historical average in the era of Lightning Lanes. That means that posted waits are more inflated than usual. Overall, if the posted wait time at a popular attraction was 60 minutes, you could’ve expected to wait less than 43 minutes instead.
But the worst inflation offender for the past week was Journey Into Imagination. At this one attraction, submitted actual wait times were only 17% of posted wait times in the past week. That means that if the carousel had a 10 minute posted wait, you probably would have actually only waited less than 2 minutes instead. Less than a fifth of what was posted! And still not worth it for that terrible skunk smell …

This Week’s Wait Time Rock Star
Between October 27th and November 2nd we had just under 1000 timed actual waits submitted through the Lines app. And the person who recorded the most actual waits during that time was QueenofHearts, with 69 overall timed waits – 36 Lightning Lane waits, 30 standby waits, and 3 single rider waits! Thanks for all of that timing, QueenofHearts! It unfortunately does not compete with the the 97 timed waits in a single week from our current timing champion, preef.
Looking Ahead: November 3 – November 9
I write this article on Tuesday evenings so that you all have the very freshest of data on Wednesdays. That means the 3rd will already be in the past by the time you’ve read this, so welcome to a bright new future.
Halloween is in the past, which means Christmas is here! That’s what retail locations everywhere seem to think, and so does Walt Disney World. November 4th will see the debut of the first new holiday overlays of the season at Rock’n’Roller Coaster and Alien Swirling Saucers. Jollywood Nights debuts on November 7th, with Mickey’s Very Merry Christmas Party (MVMCP) following close behind on November 8th.
Jollywood doesn’t have as much of an impact on daytime crowds as MVMCP because the park stays open a little later, and daytime guests can still see Fantasmic before they leave the park for the night. And the first party of the year always has more local/influencer/blogger attendance than any other party, and those guests tend to enter the park much earlier. So don’t expect super-low crowds at HS on the 7th, (or, similarly, MK on the 8th).
Interestingly, we are in the middle of Jersey Week (which usually causes an increase in crowds), but November 5th is an Annual Passholder good-to-go day, which points to Disney not expecting a lot of people in the parks at least for that day.
Most of the weather over the next week looks lovely. Lots of sun and highs in the mid-70s to low-80s. The one exception is November 5th, when there may be a significant amount of rain again.
Were you in the parks this past week? Or are you headed to Orlando soon? Let me know in the comments below!
You May Also Like...
-

I know what you're all thinking. You're ready for some data that isn't about the election. Never fear, Disney Data Dump…
-

And we're back! I hope every had a great six sunny days in the Bahamas like I did. If not, I…

I was there, didn’t look or feel empty to me.
Wow. Based on some of the trends we have been seeing, I wonder how the parks are going to fair in January/February outside of runDisney weekends? Are we finally seeing economic impacts influencing travelers? Wonder if another government shutdown could further cause impacts as well. So many variables. It’s amazing to see a B- score when trying to predict something with so many variables.