
Disney Data Dump October 21 2026
Observed Crowd Levels October 13 – 19
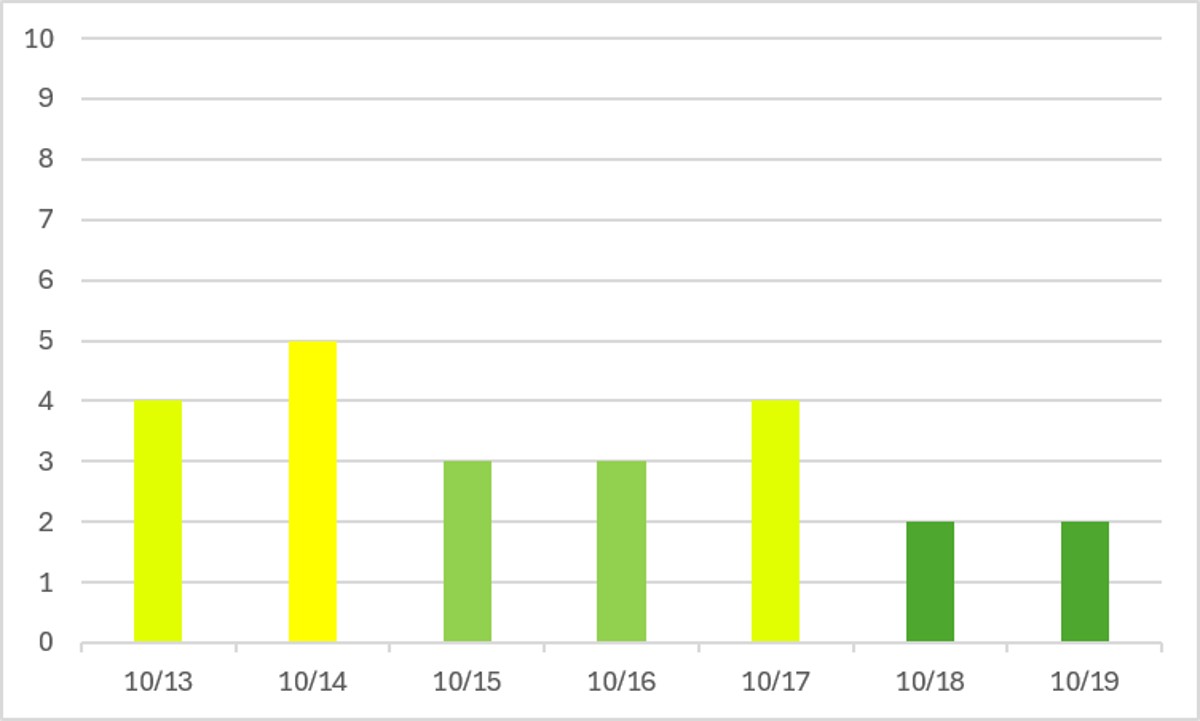
And just like that, fall break crowds faded into memory. I’ll have to go and pull the data, but my impression is that this is overall one of the least-crowded Octobers that we’ve seen in a long, long time. Elevated wait times stuck around for just a bit after the long weekend, but then everything cleared out and got back down to our summer average of crowd level 2.
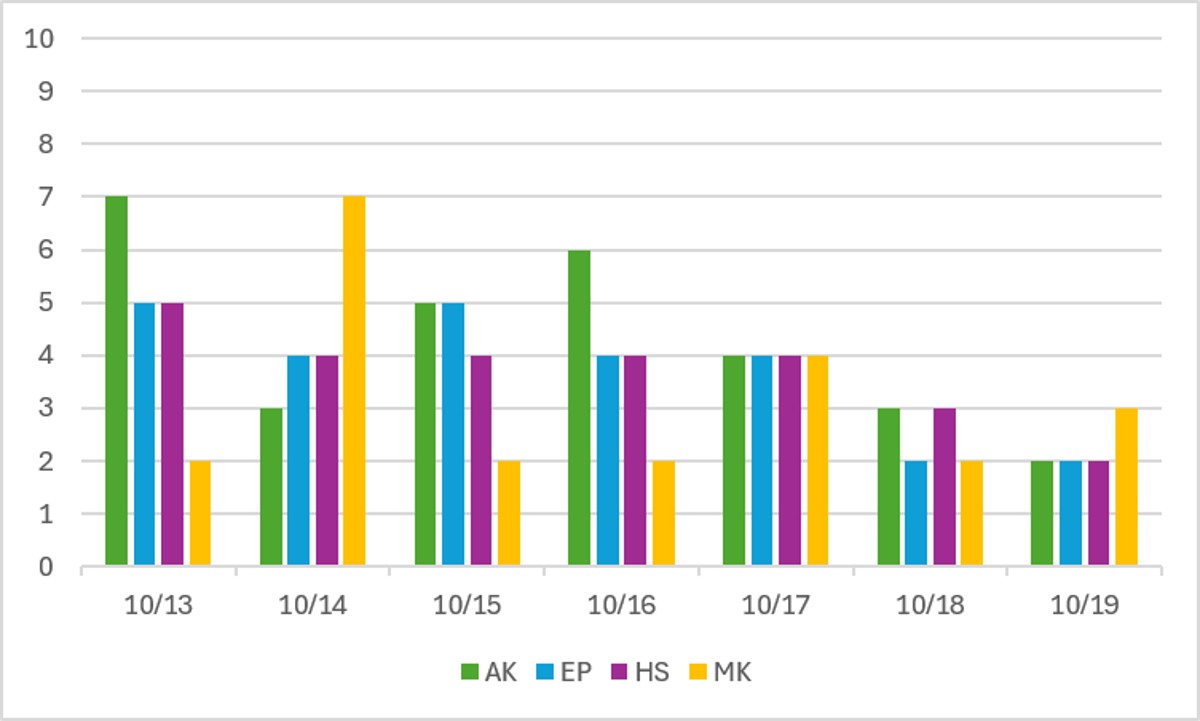
One way that we can tell that things are still at least a little more crowded than summer is that party days at Magic Kingdom are at least hitting crowd level 2 instead of crowd level 1. Animal Kingdom is still going through its crowd cycle, but it had a weird blip on Tuesday and otherwise peaked on Friday this weekend instead of Saturday. Hollywood Studios has been staying the most steady throughout the week, along with EPCOT – although EPCOT shows a little more peaking on weekends for Food & Wine Festival.
Performance of Crowd Level Predictions
Each week, I give you a very transparent look into how the TouringPlans crowd level predictions performed. Each day at each park is one data point, so each week we have 28 different crowd level predictions to evaluate. Any time a prediction is within one or two crowd levels, things won’t really “feel” much different than what was predicted. Being off by 3 or more crowd levels is where you might feel that difference in wait times throughout the day.
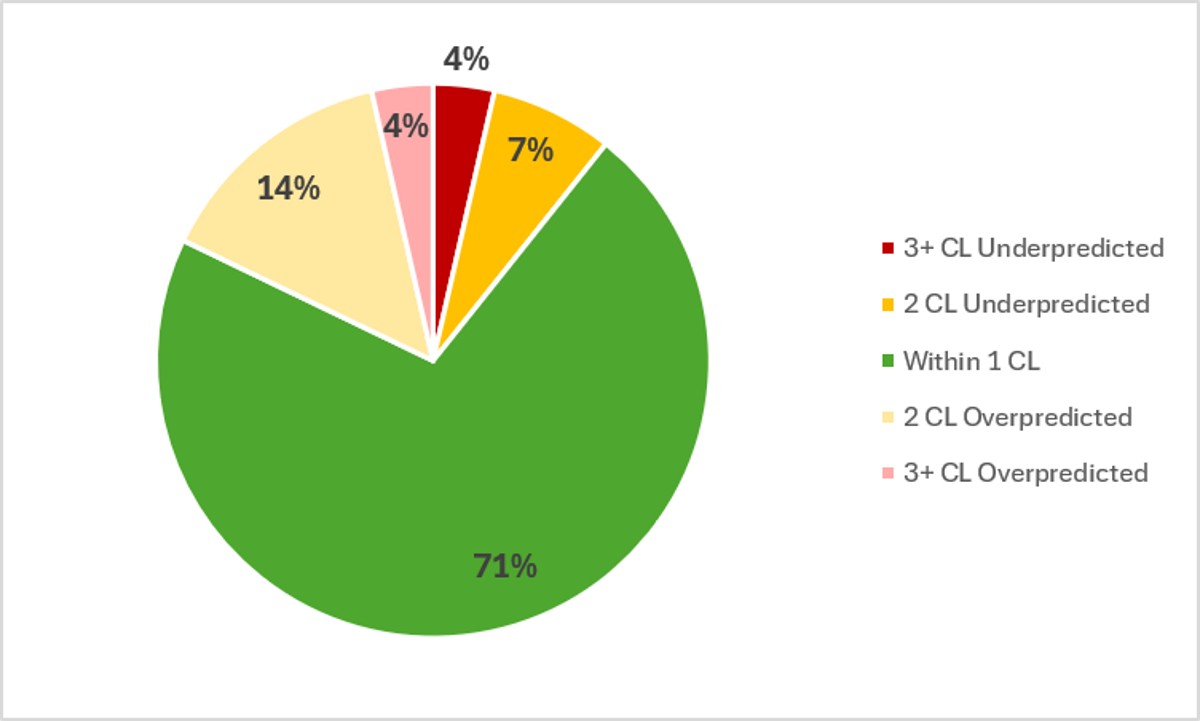
In the past week, Touring Plans predictions were either spot-on or within 1 crowd level 71% of the time, which is better than the performance we saw last week. And 92% of the time Touring Plans predictions were within 2 crowd levels, so that’s an A- on predictions for the last week. Unlike the past couple of weeks, misses were not skewed! Plenty of underpredictions and overpredictions in the mix, which is what we want to see. The two biggest misses of the week were both off by three crowd levels – Animal Kingdom was predicted to be a 2 on October 15th, but ended up a 5. And Magic Kingdom was predicted to be a 7 on October 17th, but only managed a 4.
Attraction Downtime October 13 – 19
If we average all of the capacity lost due to unexpected downtime over the past week, it comes out to 5.7% of attractions unexpectedly being down. Roughly similar to last week. But last week there were buckets of rain and this week there weren’t … curious! And over the past week, Hollywood Studios was the park with the worst overall downtime, averaging 6.4% of its capacity lost to downtime. The next-highest park downtime was Magic Kingdom, at 6%.
The worst day for attraction downtime in the past week was on October 14th. On that day, 9% of all capacity at WDW was lost due to unexpected downtime. And the worst park-day of the past week was also on October 14th, over at Magic Kingdom, when 12% of its capacity was lost due to unexpected downtime. Magic Kingdom was open for 15 hours on the 14th (it was a non-party day surrounded by 3 party days), so 12% downtime is the equivalent of the entire park shutting down for 108 minutes. That’s almost 2 hours of that 15 hour day, and the crowd level was a 7. Ouch.
Attraction Downtime Worst Offender
If you can’t guess the top downtime defender of the week at this point, you clearly haven’t been paying attention for the last … 6 months. Once again, it’s … Test Track! Thankfully, after its astounding 48% downtime last week, Test Track “only” had 17% downtime this week. That’s one of its lower wining percentages for this category. Its worst day of the past week was on October 14th, when it was down for 34% of the day.
The attraction with the next most downtime this week was Pirates of the Caribbean, at 16% unexpected downtime.

Rope Drop Downtime
Here are problematic offenders from the past week, with the percentage of downtime during the first hour of the day in parentheses:
- Magic Kingdom: Tiana’s Bayou Adventure (23%), Haunted Mansion (20%), TTA PeopleMover (19%), The Many Adventures of Winnie the Pooh (17%), Pirates of the Caribbean (15%)
- EPCOT: Test Track (28%), Remy’s Ratatouille Adventure (20%), Frozen Ever After (17%)
- Hollywood Studios: Runaway Railway (27%), Slinky Dog Dash (26%), Rise of the Resistance (22%), Millennium Falcon (14%), Rock’n’Roller Coaster (12%)
- Animal Kingdom: Expedition Everest (20%), Kali River Rapids (17%), Kilimanjaro Safari (14%)
This was a really really bad week for rope drop over at Hollywood, with almost every good rope drop option experiencing a significant amount of downtime during its first hour of the day. It was a week when you needed a Plan A, B, C, D and E.
It’s rare for Animal Kingdom to have more than one attraction on the rope drop downtime list, and this week there are three. That’s a rough list for a park without very many attractions to start with.
Over at EPCOT, rope droppers from International Gateway had a bad week thanks to Remy and Frozen both being unreliable.
And Magic Kingdom continues to be Magic Kingdom, with a smattering of struggling attractions each week.
Wait Times October 13 – 19
Attractions with the Highest Average Posted Wait at Each Park
- EPCOT: Cosmic Rewind, average posted wait of 80 minutes (was 88 minutes last week)
- Hollywood Studios: Slinky Dog Dash, average posted wait of 74 minutes (was 75 minutes last week)
- Magic Kingdom: TRON, average posted wait time of 60 minutes (was 72 minutes last week)
- Animal Kingdom: Flight of Passage, average posted wait time of 51 minutes (was 60 minutes last week)
It’s easy to see the headliners all coming out of their Fall Break peak waits. These averages aren’t as low as what we saw for most of the summer, but they’re significantly down from the previous week and pretty great for the middle of October!
Parks with the Highest and Lowest Average Wait
- Highest: Hollywood Studios, average park-wide posted wait of 38 minutes (was 37 minutes last week)
- Lowest: Magic Kingdom, average park-wide posted wait of 22 minutes (was 20.5 minutes last week)
What happened here? When headliner waits were down? Downtime happened here. Hollywood Studios and Magic Kingdom both had the highest downtime percentages this week. Much higher than either had last week. So while crowds were lower, and we see that impact in lower headliner wait times, the overall average was slightly up thanks to downtime shifting people around and increasing waits at some of those lower-demand attractions.
Most Inflated Posted Wait Times
We all know that Disney inflates their posted wait times on purpose. They have many reasons for doing this. Some are totally understandable, and some are potentially more problematic. We can figure out how much posted wait times are being inflated by comparing submitted actual wait times from the Lines App and the posted wait time when the person timing their wait entered the line.
Over the past week, actual wait times in the Lines App averaged 76% of what was posted. That’s still a bit above our historical average in the era of Lightning Lanes, which means that wait times were less inflated than normal. Hooray! Overall, if the posted wait time at a popular attraction was 60 minutes, you could’ve expected to wait less than 46 minutes instead.
But the worst inflation offender for the past week was Gran Fiesta Tour. At this one attraction, submitted actual wait times were only 36% of posted wait times in the past week. That’s the same winner and result as last week! And it means that if those three caballeros had a 10 minute posted wait, you probably would have actually only waited about 3.5 minutes instead. About a third of what was posted!

This Week’s Wait Time Rock Star
Between October 13th and 19th we had just over 800 timed actual waits submitted through the Lines app. And the person who recorded the most actual waits during that time was goofymybeck, with 21 overall timed waits – and it was hard mode, with all standby waits! Thanks for all of that timing, goofymybeck! It unfortunately does not compete with the the 97 timed waits in a single week from our current timing champion, preef.
Looking Ahead: October 20 – 26
I write this article on Tuesday evenings so that you all have the very freshest of data on Wednesdays. That means the 20th will already be in the past by the time you’ve read this, so we’re time travelling together!
This is a WEIRD week at WDW, so prepare yourselves! First, on October 20th (in the past when you read this), Hollywood Studios is closing at 5 pm for a private event. That will certainly make wait times in the park during the day remarkably low compared to any surrounding day. Then, as a result of the early HS close, the MK party schedule gets shifted around and we only have three parties this week – on the 22nd, 23rd, and 25th. That should compress MK crowds to the 24th pretty heavily.
And it’s also Wine & Dine race weekend. This year, that’s going to cause EPCOT to open an hour late (at 10 am) on the 23rd (Friday) and 25th (Sunday). Additionally, on Sunday, post-race party goers are allowed into EPCOT starting at 5 pm for their party that goes from 10 pm to 1 am. That’ll be a busy EPCOT day.
Phew! Good luck navigating all of the changes this week if you’re in Orlando.
Thankfully, the weather looks perfect for Florida fall over the upcoming week. Lows in the mid-60s and highs in the low 80s! And ZERO rain in the forecast?! Knock on all of the wood and enjoy that pleasant sunshine this week.
Were you in the parks this past week? Or are you headed to Orlando soon? Let me know in the comments below!
You May Also Like...
-
Well, this wasn't the start to October that I expected! After spending most of the summer talking about crowds that were…
-

Well, that escalated quickly. After weeks of slow climbs and small spikes, this weekend’s crowds at Walt Disney World came in…
