
Disney Data Dump October 28 2026
Observed Crowd Levels October 20 – 26
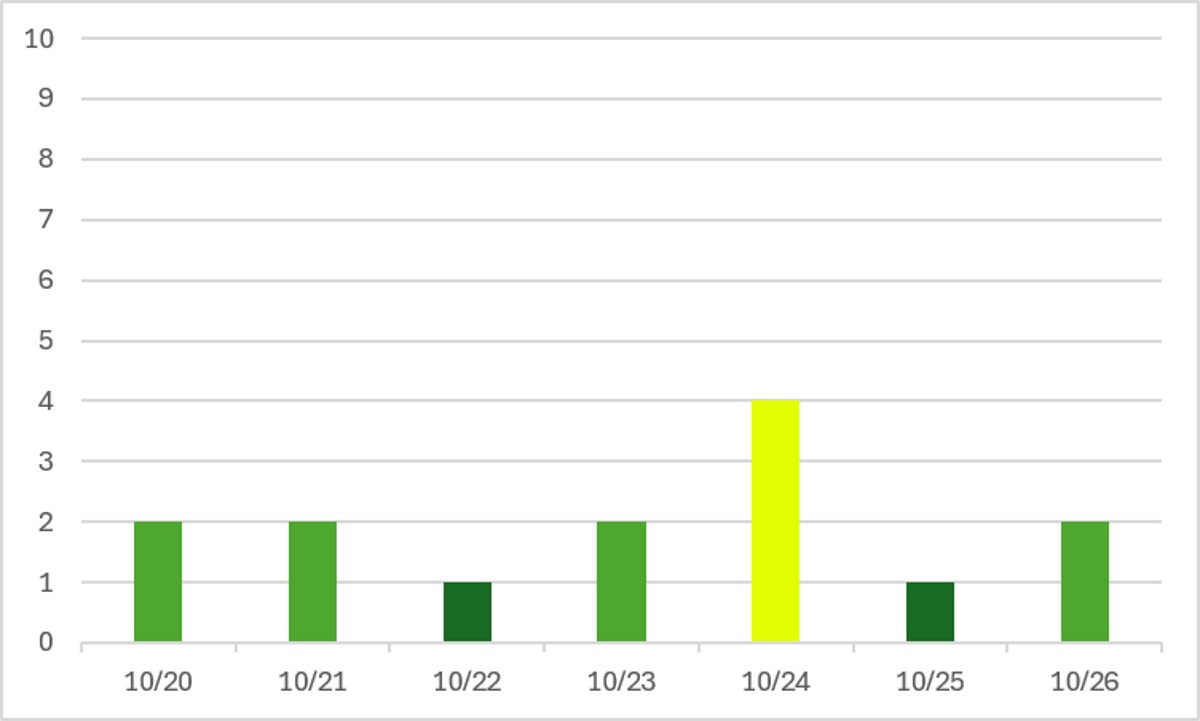
Last week I wanted to pull some data to see if this was the lowest-crowd October ever, and it’s definitely the least-crowded October since the pandemic. So far, this October has averaged under a crowd level 3. In 2024 and 2025 it was near a 3.5, in 2023 it was 5.5, and in 2022 it was 6.5. That’s a big drop-off. These weeks between fall break (Columbus Day week) and Jersey Week (the first week of November) are becoming more and more attractive for a decent-weather and lower-crowd trip if you want the spooky spirit.
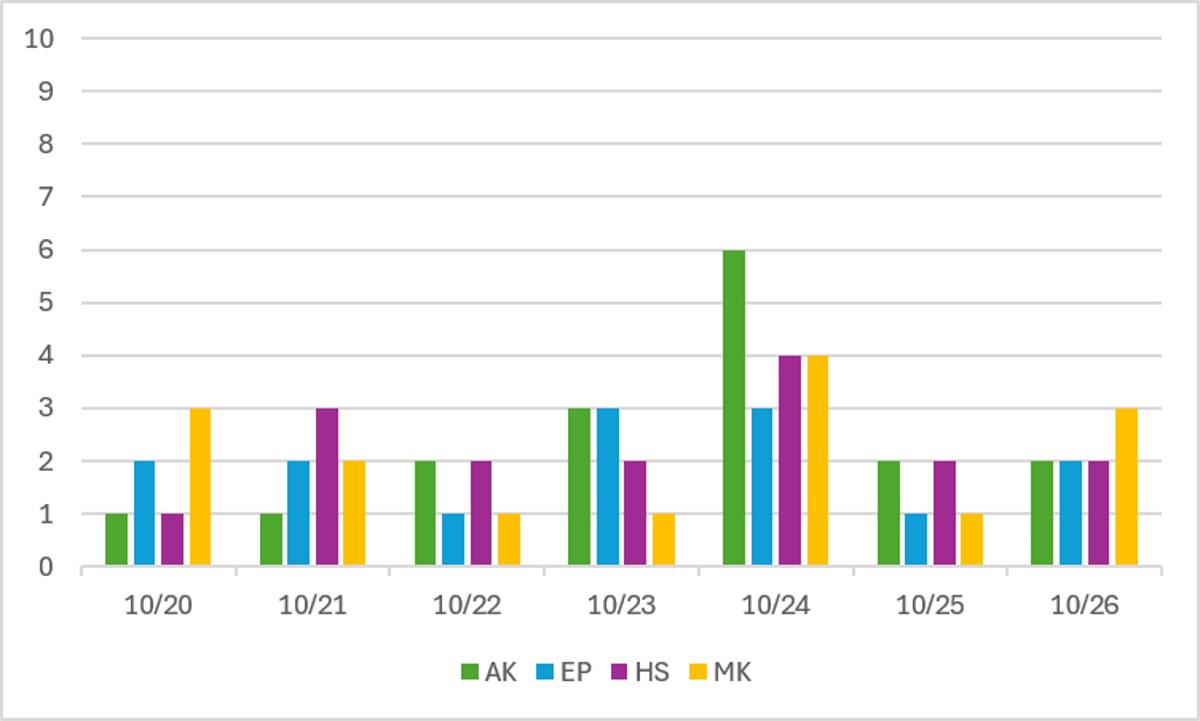
Let’s remind ourselves that last week was really weird. On October 20th, Hollywood Studios closed at 5 pm. It was very very empty. EPCOT opened late on the 23rd and 25th. Magic Kingdom had parties on the 22nd, 23rd, and 25th. And EPCOT had a party on the 25th. That made Saturday the most crowded day of the week. Locals clearly opted for Animal Kingdom to avoid the chaos of the other parks, but Magic Kingdom absorbed plenty of people who wanted a chance to see the evening entertainment.
Performance of Crowd Level Predictions
Each week, I give you a very transparent look into how the TouringPlans crowd level predictions performed. Each day at each park is one data point, so each week we have 28 different crowd level predictions to evaluate. Any time a prediction is within one or two crowd levels, things won’t really “feel” much different than what was predicted. Being off by 3 or more crowd levels is where you might feel that difference in wait times throughout the day.
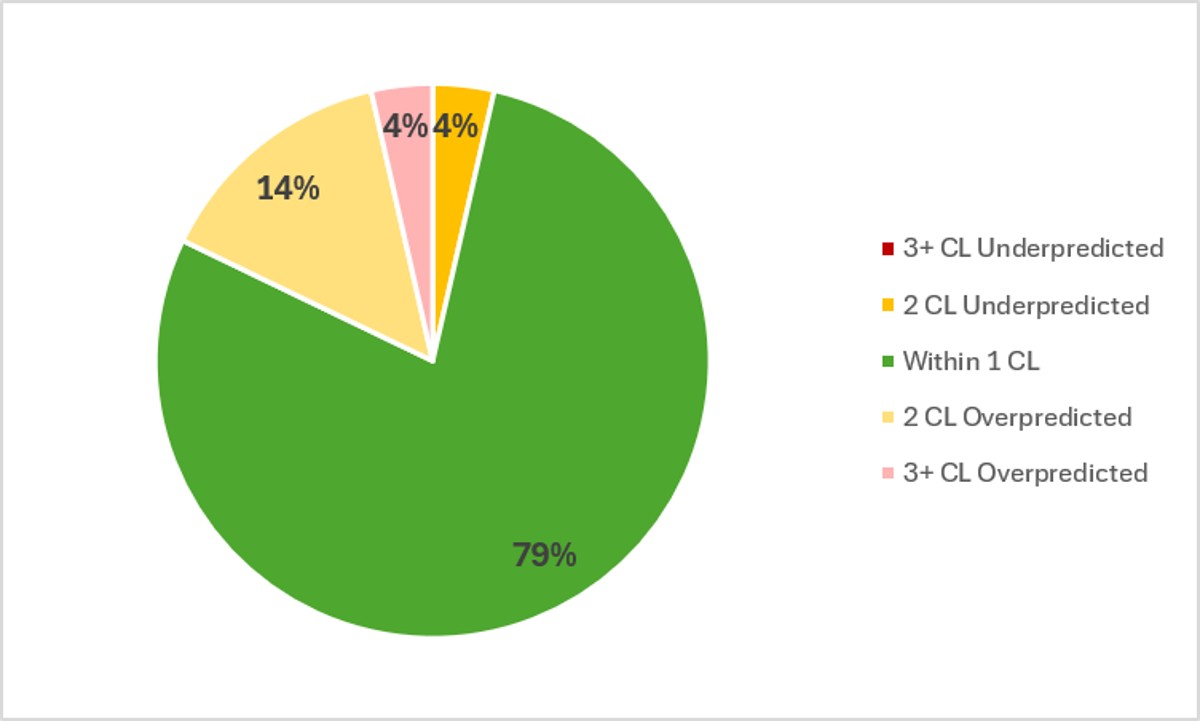
In the past week, Touring Plans predictions were either spot-on or within 1 crowd level 79% of the time, which is better than the performance we saw last week and the week before. And 96% of the time Touring Plans predictions were within 2 crowd levels, so that’s an A on predictions for the last week. The results have once again gotten pretty skewed, with 5x more overprediction than underpredictions. I’ve got to re-emphasize that this is after Len updated models several times this summer, mostly tuning predictions down for unexpectedly low crowds. The fact that crowds and wait times are still underperforming is crazy. The biggest miss of the week was an overprediction by 3 crowd levels – Magic Kingdom was predicted to be a 5 on October 21st, but ended up a 2.
Attraction Downtime October 20 – 26
If we average all of the capacity lost due to unexpected downtime over the past week, it comes out to 4% of attractions unexpectedly being down. That’s the lowest downtime we’ve had in months and months, mostly thanks to having a sunny week! And over the past week, Hollywood Studios was the park with the worst overall downtime, averaging 4.7% of its capacity lost to downtime. The next-highest park downtime was Magic Kingdom, at 4.3%.
The worst day for attraction downtime in the past week was on October 26th. On that day, 7% of all capacity at WDW was lost due to unexpected downtime. And the worst park-day of the past week was also on October 26th, over at Hollywood Studios, when 11% of its capacity was lost due to unexpected downtime. Hollywood Studios was open for 12 hours on the 26th, so 11% downtime is the equivalent of the entire park shutting down for 79 minutes. That’s almost an hour and a half of the 12-hour day. Thankfully, Hollywood Studios was only a crowd level 2 that day.
Attraction Downtime Worst Offender
I was hopeful that the turnaround in weather would mean we might get a new winner of this category for once. But yet again, it’s … Test Track! Thankfully, we’re continuing an overall downward trend of downtime (lol), with 15% downtime this week. That’s after 17% downtime last week and a whopping 48% downtime the week before. Its worst day of the past week was on October 21st, when it was down for 29% of the day.
Every other attraction in every park had less than 10% downtime. Hooray!

Rope Drop Downtime
Here are problematic offenders from the past week, with the percentage of downtime during the first hour of the day in parentheses:
- Magic Kingdom: Big Thunder Mountain Railroad (22%), Haunted Mansion (21%), Tiana’s Bayou Adventure (17%), Mad Tea Party (12%), Winnie the Pooh (11%)
- EPCOT: No rope drop downtime issues!
- Hollywood Studios: Slinky Dog Dash (28%), Runaway Railway (17%), Rock’n’Roller Coaster (14%)
- Animal Kingdom: Kilimanjaro Safaris (14%)
Friends, folks, and neighbors … we’ve never ever given a gold star to EPCOT for no rope drop downtime issues. Maybe the two late opens this week helped everything feel well-rested and ready to start the day!
Magic Kingdom and Hollywood Studios had fewer problems than normal too, although Slinky up near 30% rope drop downtime is never good. But on the whole, not anywhere near the worst rope drop week we’ve had.
Wait Times October 20 – 26
Attractions with the Highest Average Posted Wait at Each Park
- EPCOT: Cosmic Rewind, average posted wait of 67 minutes (was 80 minutes last week)
- Hollywood Studios: Slinky Dog Dash, average posted wait of 58 minutes (was 74 minutes last week)
- Magic Kingdom: TRON, average posted wait time of 52 minutes (was 60 minutes last week)
- Animal Kingdom: Flight of Passage, average posted wait time of 38 minutes (was 51 minutes last week)
Those are some big wait time drops! And that’s how you know Fall break is really and truly over. Cosmic Rewind was the only attraction in all of WDW that had an average posted wait of over an hour. And look at Flight of Passage, down closer to half an hour! That makes for some amazingly easy touring, when all posted waits are so low.
Parks with the Highest and Lowest Average Wait
- Highest: Hollywood Studios, average park-wide posted wait of 32 minutes (was 38 minutes last week)
- Lowest: Magic Kingdom, average park-wide posted wait of 20.5 minutes (was 22 minutes last week)
Those are big drops of ~20% at Hollywood Studios and ~10% at Magic Kingdom. That’s enough to really notice the difference as you’re trying to get to all of the attractions you want to hit in a park day. It really makes the case for late-ish October as prime time for a fall WDW visit.
Most Inflated Posted Wait Times
We all know that Disney inflates their posted wait times on purpose. They have many reasons for doing this. Some are totally understandable, and some are potentially more problematic. We can figure out how much posted wait times are being inflated by comparing submitted actual wait times from the Lines App and the posted wait time when the person timing their wait entered the line.
Over the past week, actual wait times in the Lines App averaged 73% of what was posted. That’s close to our historical average in the era of Lightning Lanes. Overall, if the posted wait time at a popular attraction was 60 minutes, you could’ve expected to wait less than 44 minutes instead.
But the worst inflation offender for the past week was Prince Charming Regal Carrousel. At this one attraction, submitted actual wait times were only 20% of posted wait times in the past week. That means that if the carousel had a 10 minute posted wait, you probably would have actually only waited about 2 minutes instead. A fifth of what was posted! But let’s be honest, on a week like this one, pretty much everyone was just waiting for the next cycle and that’s it.

This Week’s Wait Time Rock Star
Between October 20th and 26th we had just under 1000 timed actual waits submitted through the Lines app. And the person who recorded the most actual waits during that time was Cmcinc, with 31 overall timed waits – 18 Lightning Lane waits, 10 standby waits, and 3 single rider waits! Thanks for all of that timing, Cmcinc! It unfortunately does not compete with the the 97 timed waits in a single week from our current timing champion, preef.
Looking Ahead: October 27 – November 2
I write this article on Tuesday evenings so that you all have the very freshest of data on Wednesdays. That means the 27th will already be in the past by the time you’ve read this, so we’re back to the future!
We’ve reached the end of Halloween parties for the year! It feels like just yesterday we were starting them up in the middle of summer. The last three parties of the year are on October 27, 29, and 31. So those days will have lower crowds at Magic Kingdom. Expect the 28th and 30th to see upticks in wait times there instead. But don’t worry, our party-related updates aren’t over, because this time next week we’ll be looking ahead at Christmas party schedules. Yikes!
Some rain is sneaking back into the forecast this week. It doesn’t look like any day will be a total washout, but if you’re headed to the parks, be sure to check the forecast in the morning and be prepared with rain gear if it seems like there’s any chance you’ll need it. This week is also going to be slightly hotter than the last, so be ready for a bit of heat (heat index in the 90s) too.

Were you in the parks this past week? Or are you headed to Orlando soon? Let me know in the comments below!
You May Also Like...
-

Well, that was quick. Last week, fall break finally showed up and gave us the highest crowds we'd seen in six months.…
-

Well, this wasn't the start to October that I expected! After spending most of the summer talking about crowds that were…
