Disney Data Dump September 24 2025
Well, friends, it looks like the end of rock-bottom crowds is officially here. After weeks of barely seeing crowd levels climb above a 2, we finally got a taste of fall travel with some noticeable bumps higher. It’s not wild by any stretch. Nothing you’d consider “holiday” busy. But the shift away from the empty parks of late summer is clear. Let’s take a closer look at how things played out across the parks, and what that means for your upcoming trips.
Observed Crowd Levels September 16 – 22
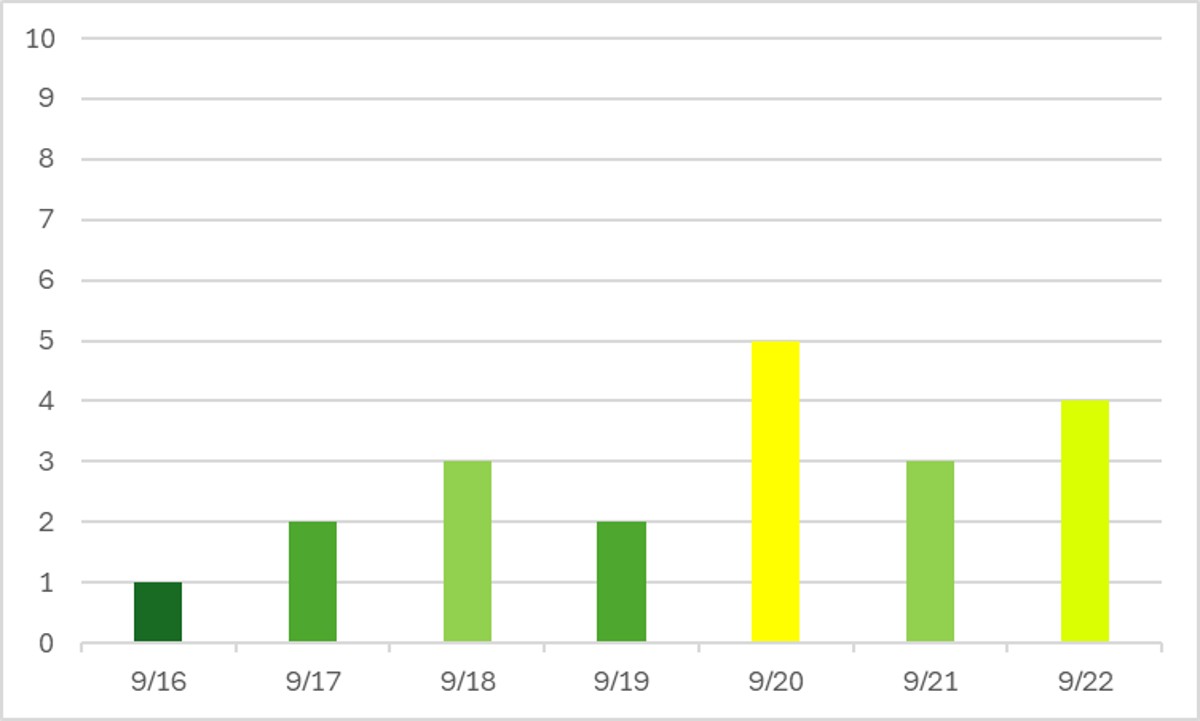
Oh heyyyyyyy beginning of fall crowds! After weeks of crowd levels barely ever inching over crowd level 2, suddenly we’ve spiked to a 5! And a 4! Obviously these aren’t crowded days in the parks, but it’s certainly a noticeable shift away from the quite empty parks that we saw in August and September.
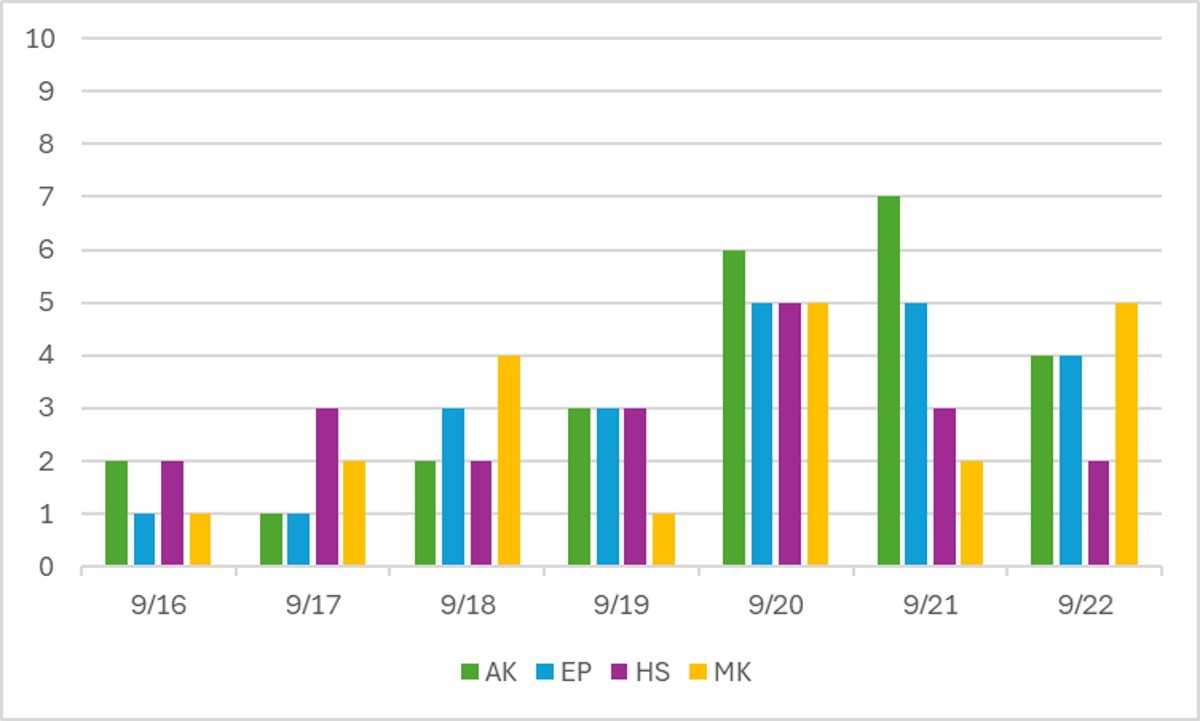
Now that crowd levels aren’t sitting at rock-bottom, our Magic Kingdom party day behavior is easier to pick out. Parties happened on the 16th, 19th, and 21st. There is also a party on the 23rd, so the 20th and 22nd are sandwiched between party days, so crowd levels on those days spiked up a little. Another interesting trend here is Animal Kingdom getting very high crowd levels on the weekend! Maybe locals are heading out to enjoy the relaxing park. And there are just so few attractions that any shift in crowds leads to big swings in wait times – unlike other parks with more attractions that can absorb the extra humans.
Performance of Crowd Level Predictions
Each week, I give you a very transparent look into how the TouringPlans crowd level predictions performed. Each day at each park is one data point, so each week we have 28 different crowd level predictions to evaluate. Any time a prediction is within one or two crowd levels, things won’t really “feel” much different than what was predicted. Being off by 3 or more crowd levels is where you might feel that difference in wait times throughout the day.
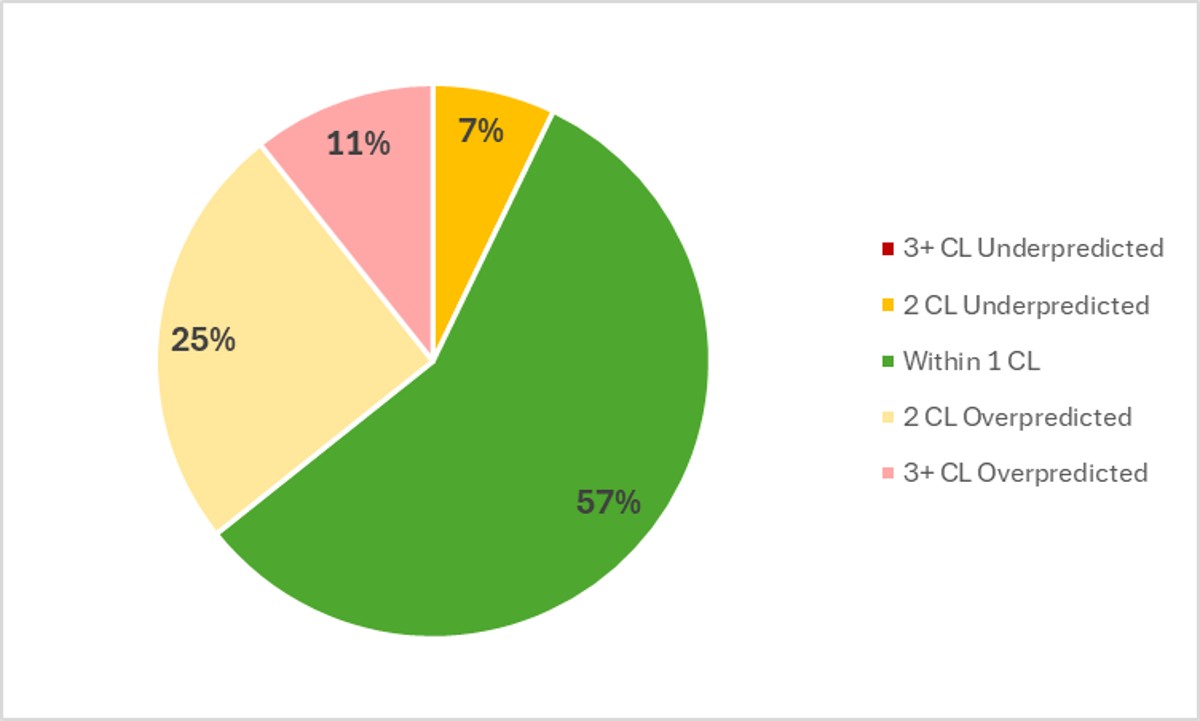
In the past week, Touring Plans predictions were either spot-on or within 1 crowd level 57% of the time, which continues as light upward trend over the past couple of weeks. 89% of the time Touring Plans predictions were within 2 crowd levels, so that means we get a B+ for our predictions in the past week. On average, the crowd level at any park any day of the week was 0.9 crowd levels below prediction. That’s within the margin of error of not being able to “feel” a difference. The biggest miss of the week was an overprediction by 4 crowd levels, at Magic Kingdom on the 17th. The prediction for Magic Kingdom was a crowd level 6, but it only ended up being a crowd level 2. That was a non party day, but there was another non party day immediately after, so we didn’t see the “spike” that we usually see for a non-party day surrounded by party days.
Attraction Downtime September 16 – 22
If we average all of the capacity lost due to unexpected downtime over the past week, it comes out to 4% of attractions unexpectedly being down. That’s below our historical average, so that’s good news for people taking advantage of low crowds this September. Still no hurricanes, low downtime, and low wait times. Just don’t expect that to stay the same as we head into October. In the past week, Hollywood Studios was the park with the most overall downtime, averaging 5.3% of its capacity lost to downtime throughout the week.
The worst day for attraction downtime in the past week was on September 17th. On that day, 5.7% of all capacity at WDW was lost due to unexpected downtime. The worst park-day of the week was also predictably on the 17th, and at our park with the most downtime – Hollywood Studios. On that day, 9% of its attraction capacity was lost due to unexpected downtime. Hollywood Studios was open for 12 hours on the 17th, so 9% downtime is the equivalent of the entire park shutting down for approximately 65 minutes.
Attraction Downtime Worst Offender
In the past week, Test Track was the WDW attraction with the worst overall downtime. It was unexpectedly down for 14% of the past week. In the previous two weeks, it had 13% and 15% downtime, so maybe we’ve stabilized around that number. The worst day at Test Track was on September 17th, when it was down for 34% of the day – at the beginning and the end of the day. But there were a couple of other days where it had 20+% downtime too.

Rope Drop Downtime
Here are problematic offenders from the past week, with the percentage of downtime during the first hour of the day in parentheses:
- Magic Kingdom: Under the Sea (31%), Seven Dwarfs Mine Train (22%), Space Mountain (21%), Tiana’s Bayou Adventure (21%), TTA PeopleMover (20%), Pirates of the Caribbean (13%), it’s a small world (13%), Astro Orbiter (12%), Haunted Mansion (11%)
- EPCOT: Test Track (30%), Living with the Land (14%)
- Hollywood Studios: Rock’n’Roller Coaster (42%), Slinky Dog Dash (15%), Tower of Terror (15%), Toy Story Mania (14%), Millennium Falcon (13%)
- Animal Kingdom: No rope drop downtime issues!
Wow. What a week. After celebrating shorter rope drop downtime lists last week, problems came ROARING back this week. Magic Kingdom especially had a week of rough mornings just all over the place. And almost every headliner shows up on the Hollywood Studios list too – other than Rise of the Resistance, so hurrah for that.
But we’ve got a gold star for Animal Kingdom. One ray of sunshine in this otherwise bleak picture.
Wait Times September 16 – 22
Attractions with the Highest Average Posted Wait at Each Park
- EPCOT: Test Track, average posted wait of 78 minutes (was 66 minutes last week)
- Magic Kingdom: TRON, average posted wait time of 60 minutes (was 52 minutes last week)
- Animal Kingdom: Flight of Passage, average posted wait time of 57 minutes (was 52 minutes last week)
- Hollywood Studios: Slinky Dog Dash, average posted wait of 54 minutes (was 74 minutes at Rise of the Resistance last week)
Once again, wait times went up at headliners and we are not shocked. The only exception to that rule is Hollywood Studios. This continues a trend we’ve been seeing for a couple of months, actually. Every once in a while (once every couple of weeks), Rise of the Resistance sees a big random spike in its wait times even when the rest of the park is roughly stable. And then Rise goes back to normal and Slinky has the highest wait times in the park. I don’t know what’s causing this behavior at Rise. I suspect they’re messing with the capacity of the attraction somehow, but I don’t know why.
Parks with the Highest and Lowest Average Wait
These parks likely won’t change week-to-week unless something crazy happens, but these data points will give us a high-level view of how wait times are trending from week to week.
- Highest: EPCOT, average park-wide posted wait of 34 minutes (was 29 minutes last week)
- Lowest: Magic Kingdom, average park-wide posted wait of 20 minutes (was 18 minutes last week)
Alright folks, it’s our first above-half-an-hour park-wide average posted wait in a while. It’s one of the signs that fall is here! In fact, Hollywood Studios was also over 30 minutes, and Animal Kingdom was right about at 30 minutes. Fall break season isn’t quite here yet, but there are clear indicators that travel to WDW is starting to pick back up.
Most Inflated Posted Wait Times
We all know that Disney inflates their posted wait times on purpose. They have many reasons for doing this. Some are totally understandable, and some are potentially more problematic. We can figure out how much posted wait times are being inflated by comparing submitted actual wait times from the Lines App and the posted wait time when the person timing their wait entered the line.
Over the past week, actual wait times in the Lines App averaged 70% of what was posted. That’s quite a bit higher than our historical average. That means posted waits weren’t as inflated as normal. Overall, if the posted wait time at a popular attraction was 60 minutes, you could’ve expected to wait 42 minutes instead.
But the worst inflation offender for the past week is Mickey’s PhilharMagic. At this one attraction, submitted actual wait times were only 30% of posted wait times in the past week. That means that if PhilharMagic had a 15 minute posted wait, you probably would have actually only waited about 4.5 minutes instead. Less than a third of what was posted! Remember to always check the Lines app for predicted actual waits instead of making decisions based on what is posted.

This Week’s Wait Time Rock Star
Between September 16th and 22nd, we had just over 1100 timed actual waits submitted through the Lines app. The one person who recorded the most actual waits during that time was EftelJuddi, with 31 overall timed waits – 30 standby waits, and 1 single rider wait. Thanks for all of that timing, EftelJuddi! It unfortunately does not compete with the the 97 timed waits in a single week from our current timing champion, preef.
Looking Ahead: September 23 – 29
I write this article on Tuesday evenings so that you all have the very freshest of data on Wednesdays. That means the 23rd will already be in the past by the time you’ve read this, so you’ve travelled to the future!
We’ve entered the time of year when Halloween parties happen an average of 4 days a week (instead of 2 or 3). That really squeezes Magic Kingdom day guests into the non-party days and will exaggerate the swings in crowd levels between party days and non-party days. Over the next week, parties happen on the 23rd, 25th, 26th, and 28th. There is also a party on the 30th. So you should expect the heaviest MK crowds on September 27th, followed by the 24th and 29th.
Disney is expecting some crowds to be higher over the weekend, because Animal Kingdom stays open until … wait for it … 7 pm instead of 6 pm. Ha! All changes to the normal calendar mean something, even if it’s just an extra hour.
We’re back in a little bit of a stormy season. Nothing terrible, but there will probably be spotty rain on most days of the coming week. Be prepared with your poncho or rain jacket or umbrella and some dry socks.
I just got back from a very quick trip to the World, including September day at Cosmic Rewind and my first Mickey’s Not So Scary Halloween Party! I was 4th in line at Cosmic Rewind, which paid off, because by the time I got off the ride (at 8:45 am), the line was already two hours long. And I thoroughly enjoyed the Halloween parade and bringing home 6 pounds of candy for my kids.
Were you in the parks this past week? Or are you headed to Orlando soon? Let me know in the comments below!
You May Also Like...
-

It looks like our post-Labor Day lull is starting to shift. Nothing wild yet. It’s still September, after all. But the…
-

If you’re looking for the quietest time of year to be in Walt Disney World, here it is. The week after…
Wait …the Test Track door isn’t fixed yet???
As of September 21st when I rode it, no.