Disney World Crowd Report – June 15 to 21, 2014
Two weeks ago on the Crowd Report we saw that the extension of the school year for some districts lowered the crowds levels across the resort. It appears that this past week may be the final week where we see that phenomenon. Crowds were one or two levels lower than expected this week but that was almost exclusively due to lower than expected wait times at Disney Hollywood Studios.
Let’s look at how the crowd levels stacked up each day last week:
| WHAT WE THOUGHT |
WHAT WE SAW |
ANALYSIS | |
|---|---|---|---|
| Magic Kingdom |
6
|
6
|
No surprises on Father’s Day Sunday. All four parks came in within one of our predicted crowd levels and all were either a ‘6’ or a ‘5’. Star Wars Weekends brought higher wait times to the Studios than pervious weekends, including a 29-minute average wait at Star Tours. Despite hosting Extra Magic Hour evening until 2:00 am, Magic Kingdom stayed at a relatively calm level ‘6’ during the day with only Space Mountain (51 mins), Splash Mountain (56 mins) and Peter Pan’s Flight (46 mins) reaching an average posted wait time above 40 minutes. |
| Epcot |
5
|
6
|
|
| Hollywood Studios |
5
|
5
|
|
| Animal Kingdom |
6
|
5
|
|
| WHAT WE THOUGHT |
WHAT WE SAW |
ANALYSIS | |
| Magic Kingdom |
7
|
7
|
Crowds at Disney Hollywood Studios have surprised us throughout May and June and continued to surprise us this week. A 10:00 pm closing plus Evening Extra Magic Hours until midnight would suggest a park crowd level around ‘8’ but attractions like Toy Story Mania (75 minutes), Tower of Terror (46) and Rock ’n’ Roller Coaster (53) had average wait times well below what history would suggest (predicted 102, 64 and 73 minutes, respectively). The phenomenon continues to focus only at The Studios. We saw ‘7’s and ‘6’s at the other three parks, as expected. |
| Epcot |
6
|
6
|
|
| Hollywood Studios |
8
|
4
|
|
| Animal Kingdom |
7
|
7
|
|
| WHAT WE THOUGHT |
WHAT WE SAW |
ANALYSIS | |
| Magic Kingdom |
8
|
7
|
Another very slow day at The Studios on Tuesday. Toy Story Mania averaged 69 minutes (predicted 99), Tower of Terror 37 minutes (predicted 64) and Rock ’n’ Roller Coaster averaged 53 minutes (predicted 70). Meanwhile, Animal Kingdom was very crowded with all attractions reaching a level ‘8’ or higher on our scale with the only exception of Expedition Everest (averaged 36 minutes, a level ‘6’). |
| Epcot |
8
|
7
|
|
| Hollywood Studios |
8
|
4
|
|
| Animal Kingdom |
7
|
9
|
|
| WHAT WE THOUGHT |
WHAT WE SAW |
ANALYSIS | |
| Magic Kingdom |
8
|
7
|
Wednesday’s crowds were the lowest of week, especially for Epcot. Soarin’ averaged 79 minutes which is only a ‘6’ on our scale and Test Track hit an average of 67 minutes, twenty minutes lower than expected. Overall, our predictions hit the mark again with Disney Hollywood Studios as the only exception, again. |
| Epcot |
6
|
5
|
|
| Hollywood Studios |
8
|
5
|
|
| Animal Kingdom |
8
|
8
|
|
| WHAT WE THOUGHT |
WHAT WE SAW |
ANALYSIS | |
| Magic Kingdom |
7
|
7
|
Again on Thursday we saw low crowds at The Studios. Toy Story Mania averaged only 69 minutes, very low for a Thursday in June with a park closing of 10:00 pm. Our prediction of ‘7’ for Magic Kingdom and Epcot looked good though, even though Magic Kingdom hosted Extra Magic Hour morning and remained open until 1:00 am. |
| Epcot |
7
|
7
|
|
| Hollywood Studios |
8
|
4
|
|
| Animal Kingdom |
7
|
6
|
|
| WHAT WE THOUGHT |
WHAT WE SAW |
ANALYSIS | |
| Magic Kingdom |
7
|
6
|
Slightly lower crowds on Friday with no park hitting a level above ‘6’. We will be interested to see how wait times look at The Studios over the next few weekends now that Star Wars Weekends have concluded. Will they return to stable levels compared to history or will it continue to surprise us with low wait times. |
| Epcot |
7
|
6
|
|
| Hollywood Studios |
7
|
5
|
|
| Animal Kingdom |
7
|
5
|
|
| WHAT WE THOUGHT |
WHAT WE SAW |
ANALYSIS | |
| Magic Kingdom |
6
|
5
|
Saturday’s wait times were slightly lower than predicted across the resort although Epcot was a ‘5’ as predicted. Any park seemed to be a good choice on Saturday. Disney Hollywoods Studios reached a level ‘4’ which was lower than expected but similar to Saturdays during Star Wars Weekends in May and June. |
| Epcot |
5
|
5
|
|
| Hollywood Studios |
6
|
4
|
|
| Animal Kingdom |
7
|
5
|
|
| June 22 to 28, 2014 |
|---|
Summer season is upon us so you can expect the parks to be crowded, hot and rainy in the afternoon. Park hours are long however so you have lots of time to visit in the morning, take a midday break and return in the evening for a full day of touring.
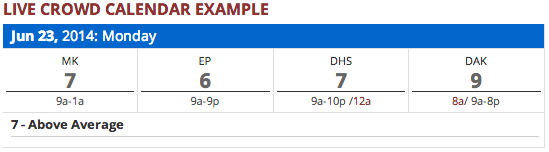
To see Walt Disney World Crowd predictions for the days of your vacation, check the Crowd Calendar.![]()
To get details about our predictions of future crowds or details about crowds in the past check out the Crowd Calendar and select “Jump to Date” on the left margin.
You May Also Like...
-

This weekend will have the longest park hours since Walt Disney World re-opened in July. Extended park hours are a signal…
-
The April Crowd Calendar update only has minor changes. We are halfway through spring break, and crowd levels have been in-line…
-

June is here, and it is time for another Crowd Calendar update. Disney introduced a new summer One World Ticket. The…
-
We have been holding off on doing any big Crowd Calendar updates until we saw how the crowds were in 2021.…
Fred, this Studios phenomenon is a fascinating thing, as it has been a pretty common occurrence over the past weeks. Any ideas what is causing it? Is it possible that more people are visiting the other three parks and forsaking a day at the Studios? Or that the Studios would be the most likely park impacted by the resurgent Universal parks, especially with the second HP land opening? Or does it simply show lower crowd levels at the WDW through late spring?
I’m curious for any reflections you might offer…and guess that I’m not the only one! 🙂
Great point Skippydoo2, glad you asked. We are are working on a new version of the Disneyland Crowd Calendar along with a weekly crowd report. We hope to have something announced within a few weeks.
When are the DLR crowd predictions going to get some statistical analysis and love? Please help the west coast parks make sense out of what’s going on there.