Disney World Crowd Report – May 18 to 24, 2014
Crowds at Walt Disney World held steady last week with only one park reaching a crowd level above ‘7’ on our scale. Other than that, most days the parks were about average, between ‘4’ and ‘6’. Crowds at Disney Hollywood Studios and Animal Kingdom were more often lower than expected. In the case of the Studios, perhaps guests are pushing their Studios visit to the weekend to experience the Star Wars festivities. Highlights of the week included Star Wars Weekend and “Rock Your Disney Side”, the Magic Kingdom’s 24-hour summer kick off.
Let’s look at how the crowd levels stacked up each day last week:
| WHAT WE THOUGHT |
WHAT WE SAW |
ANALYSIS | |
|---|---|---|---|
| Magic Kingdom |
5
|
6
|
Epcot and Disney Hollywood Studios went opposite directions from our predictions. Soarin’ and Test Track averaged 69 and 64 minutes respectively while Spaceship Earth averaged 24 minutes, a ’10’ on our scale. At The Studios Toy Story Mania reached an average wait time of 68 minutes, much lower than the 85 minutes we predicted. |
| Epcot |
5
|
7
|
|
| Hollywood Studios |
6
|
3
|
|
| Animal Kingdom |
5
|
6
|
|
| WHAT WE THOUGHT |
WHAT WE SAW |
ANALYSIS | |
| Magic Kingdom |
5
|
5
|
Monday’s predictions missed only at The Studios and only by one. Early week crowds continue to be much lighter than crowds later in the week, a trend that has been prominent through late April and May. |
| Epcot |
3
|
3
|
|
| Hollywood Studios |
3
|
2
|
|
| Animal Kingdom |
5
|
5
|
|
| WHAT WE THOUGHT |
WHAT WE SAW |
ANALYSIS | |
| Magic Kingdom |
5
|
5
|
Tuesday’s crowd at Disney Hollywood Studios was the lowest of 2014. All Studios attractions ended up as a ‘1’ on our scale. Toy Story Mania averaged 53 minutes while Star Tours and Great Movie Ride were a walk-on all day. |
| Epcot |
4
|
5
|
|
| Hollywood Studios |
5
|
1
|
|
| Animal Kingdom |
5
|
6
|
|
| WHAT WE THOUGHT |
WHAT WE SAW |
ANALYSIS | |
| Magic Kingdom |
4
|
5
|
Extra Magic Hour morning at The Studios brought a slightly higher crowd on Wednesday but not by much. Animal Kingdom saw lower than expected crowds as well. At Magic Kingdom the warm weather pushed Splash Mountain’s average wait time to 52 minutes, the highest in the park. |
| Epcot |
3
|
3
|
|
| Hollywood Studios |
4
|
2
|
|
| Animal Kingdom |
5
|
3
|
|
| WHAT WE THOUGHT |
WHAT WE SAW |
ANALYSIS | |
| Magic Kingdom |
5
|
5
|
The Studios was the best choice on Thursday, as predicted. Other parks stayed close to predictions as well with no park averaging wait times above average. |
| Epcot |
4
|
5
|
|
| Hollywood Studios |
3
|
1
|
|
| Animal Kingdom |
6
|
4
|
|
| WHAT WE THOUGHT |
WHAT WE SAW |
ANALYSIS | |
| Magic Kingdom |
6
|
6
|
Rock Your Disney Side! Magic Kingdom opened for 24 hours straight beginning at 6:00am on Friday morning. The crowd was dominated by locals and annual passholders who took an opportunity to experience a soft opening of the Seven Dwarfs Mine Train. Wait times were moderate throughout the day so our prediction of a crowd level ‘6’ between 10am and 5pm proved correct. Friday was a surprisingly good choice to experience Star Wars Weekend at The Studios, which had a crowd level ‘2’. |
| Epcot |
5
|
5
|
|
| Hollywood Studios |
5
|
2
|
|
| Animal Kingdom |
7
|
5
|
|
| WHAT WE THOUGHT |
WHAT WE SAW |
ANALYSIS | |
| Magic Kingdom |
7
|
5
|
Our predictions for Saturday put crowds higher than average for the first time all week. That turned out to be correct at Animal Kingdom and Epcot while Magic Kingdom and The Studios stayed average. |
| Epcot |
7
|
8
|
|
| Hollywood Studios |
6
|
5
|
|
| Animal Kingdom |
7
|
6
|
|
| May 25 to 31, 2014 |
|---|

Memorial Day is over, so is “Rock Your Disney Side” but soon, school districts will approach the end of their respective school years and we will see summer crowds begin. June can be a good time of year to visit if your kids are done school in the middle of the month, the peak of summer crowds will not begin until late June.
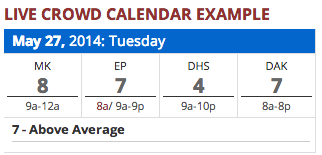
To see Walt Disney World Crowd predictions for the days of your vacation, check the Crowd Calendar.
To get details about our predictions of future crowds or details about crowds in the past check out the Crowd Calendar and select “Jump to Date” on the left margin.

