Disney World Crowd Report – November 23 to 29, 2014
Thanksgiving week at Walt Disney World was very busy – even busier than expected. The graph of our average wait time index shows large crowds on Sunday and Monday, a dip on Tuesday (thanks to severe weather) and a return to holiday crowds for the remainder of the week. We under-predicted the crowds during the first part of the week but generally were accurate the second half.
Let’s look at how the crowd levels stacked up each day last week on the Touringplans.com Disney World Crowd Report:
| WHAT WE THOUGHT |
WHAT WE SAW |
ANALYSIS | |
|---|---|---|---|
| Magic Kingdom |
5
|
8
|
We expected moderate ‘5’s and ‘6’s but saw ‘7’s and ‘8’s on Sunday. Epcot especially hit levels much higher than years past for the Sunday before Thanksgiving. |
| Epcot |
3
|
8
|
|
| Hollywood Studios |
6
|
7
|
|
| Animal Kingdom |
5
|
7
|
|
| WHAT WE THOUGHT |
WHAT WE SAW |
ANALYSIS | |
| Magic Kingdom |
9
|
10
|
Crowds increased on Monday as expected but ended up a little higher than we predicted. The average posted time at Buzz Lightyear Space Ranger Spin was 51 minutes (predicted 43) and Space Mountain averaged 78 minutes, a clear ’10’ out of ’10’ on our scale. |
| Epcot |
7
|
9
|
|
| Hollywood Studios |
6
|
10
|
|
| Animal Kingdom |
7
|
9
|
|
| WHAT WE THOUGHT |
WHAT WE SAW |
ANALYSIS | |
| Magic Kingdom |
8
|
3
|
Tuesday’s crowd was affected greatly by a severe weather storm in and around Orlando. It was enough to push Magic Kingdom wait times 7 points lower on our scale than the day before and Animal Kingdom 4 points lower. |
| Epcot |
8
|
9
|
|
| Hollywood Studios |
8
|
8
|
|
| Animal Kingdom |
9
|
5
|
|
| WHAT WE THOUGHT |
WHAT WE SAW |
ANALYSIS | |
| Magic Kingdom |
8
|
7
|
Although sever weather was still present on Wednesday we didn’t see the same affect. The Studio still reached the highest point on our scale thanks to average posted waits like 79 at Rock ‘n’ Roller Coaster (predicted 45) and 101 at Toy Story Midway Mania (predicted 77). |
| Epcot |
7
|
9
|
|
| Hollywood Studios |
7
|
10
|
|
| Animal Kingdom |
9
|
9
|
|
| WHAT WE THOUGHT |
WHAT WE SAW |
ANALYSIS | |
| Magic Kingdom |
9
|
10
|
With the rough weather passing through by Thursday, Thanksgiving crowds returned to the parks. We saw average posted waits like 90 at Peter Pan’s Flight (predicted 74), 99 at Soarin’ (predicted 100), 97 at Toy Story Midway Mania (predicted 73) and 53 minutes at Expedition Everest (predicted 51). |
| Epcot |
8
|
10
|
|
| Hollywood Studios |
6
|
9
|
|
| Animal Kingdom |
10
|
9
|
|
| WHAT WE THOUGHT |
WHAT WE SAW |
ANALYSIS | |
| Magic Kingdom |
9
|
9
|
Black Friday crowds looked similar to Thanksgiving Day with very high wait times across all four parks. Our prediction of 93 minutes at Test Track only missed by 1 minute (92) and our 22 at Great Movie Ride was low by only 3 minutes (25). |
| Epcot |
8
|
10
|
|
| Hollywood Studios |
7
|
10
|
|
| Animal Kingdom |
8
|
8
|
|
| WHAT WE THOUGHT |
WHAT WE SAW |
ANALYSIS | |
| Magic Kingdom |
6
|
8
|
Every year it surprises me how quickly the Thanksgiving crowds fade and this year is no exception. Our models told us that crowds would shrink a couple points on Saturday and they certainly did, as you can tell from the ‘7’s and ‘8’s. |
| Epcot |
7
|
8
|
|
| Hollywood Studios |
6
|
6
|
|
| Animal Kingdom |
7
|
7
|
|
| November 30 to December 6, 2014 |
|---|
Thanksgiving crowds will continue to fade sharply although we expect December crowds to remain steady, if not above average. Incidentally, the next two week period is one of our favorite times to visit the parks. Holiday decorations are up, the mood is festive and temperatures are cool. Add in an effective touring plan and you have a recipe for a great vacation.
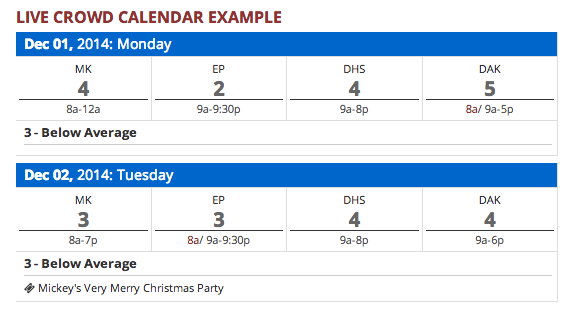
To see Walt Disney World Crowd predictions for the days of your vacation, check the Crowd Calendar.![]()
To get details about our predictions of future crowds or details about crowds in the past check out the Crowd Calendar and select “Jump to Date” on the left margin.
You May Also Like...
-

This weekend will have the longest park hours since Walt Disney World re-opened in July. Extended park hours are a signal…
-
Since October 1 we have collected over 164,000 wait times across the four Disney World parks. Overall the average posted wait…
-
The April Crowd Calendar update only has minor changes. We are halfway through spring break, and crowd levels have been in-line…
-
Crowded theme parks during the Christmas holiday are as certain as death and taxes. Every year we see crowd levels hit…
Was there all last week. Though it was crowded, I thought it was manageable. We had FPs for just about everything we wanted thanks to a glitch weeks earlier that removed Tiering for half a day. I am surprised to see HS as an 8 on masoon day. We were there, but it was a very light day. There were some attractions offline (toy story was flooded) so it probably pushed up wait times at others. And then once back on line, drove the soaking wet folks back inline.