How We Evaluate Our Crowd Calendar
Over the past six years, we have collected over 7 million wait times. Thank you to all the Lines users that have contributed to that monumental statistic.
Besides using a day’s wait time data to predict future wait times and crowd levels, we also use a day’s data to validate our predictions for that day. And we’re the only crowd calendar to show you how our predictions worked for each day. In this blog post, I will explain how we calculate the “predicted” and “observed” wait times and crowd levels for our calendar.
First, let’s cover the methodology we use to convert wait times to crowd levels. Our crowd levels are based on Disney’s posted wait times at specific attractions, between 10 a.m. and 5 p.m. Crowds at Disney parks are usually largest between 10 a.m. and 5 p.m., so that’s the best time to get a consistent view of their size. Also, every park is open between 10 a.m. and 5 p.m. every day of the year, so it’s a consistent measure.
The attractions we choose are among the parks’ most popular, and most are able to handle large crowds. Because they’re popular, it’s a good bet that high wait times mean high crowds, and low wait times mean low crowds. For example, if we see a 15-minute wait at Space Mountain at noon, it probably means that crowds are low, not that Space Mountain suddenly became less popular.
Just like the crowd calendar’s 1-to-10 scale, we score each attraction’s daily crowds on a scale of 1 to 10. After the attractions are scored, those values are combined to make the park and resort crowd levels.
Now let’s look at an example:
Before the day starts, we predict the posted wait times at each attraction. Below is what we predicted for Space Mountain on July 9, 2015.
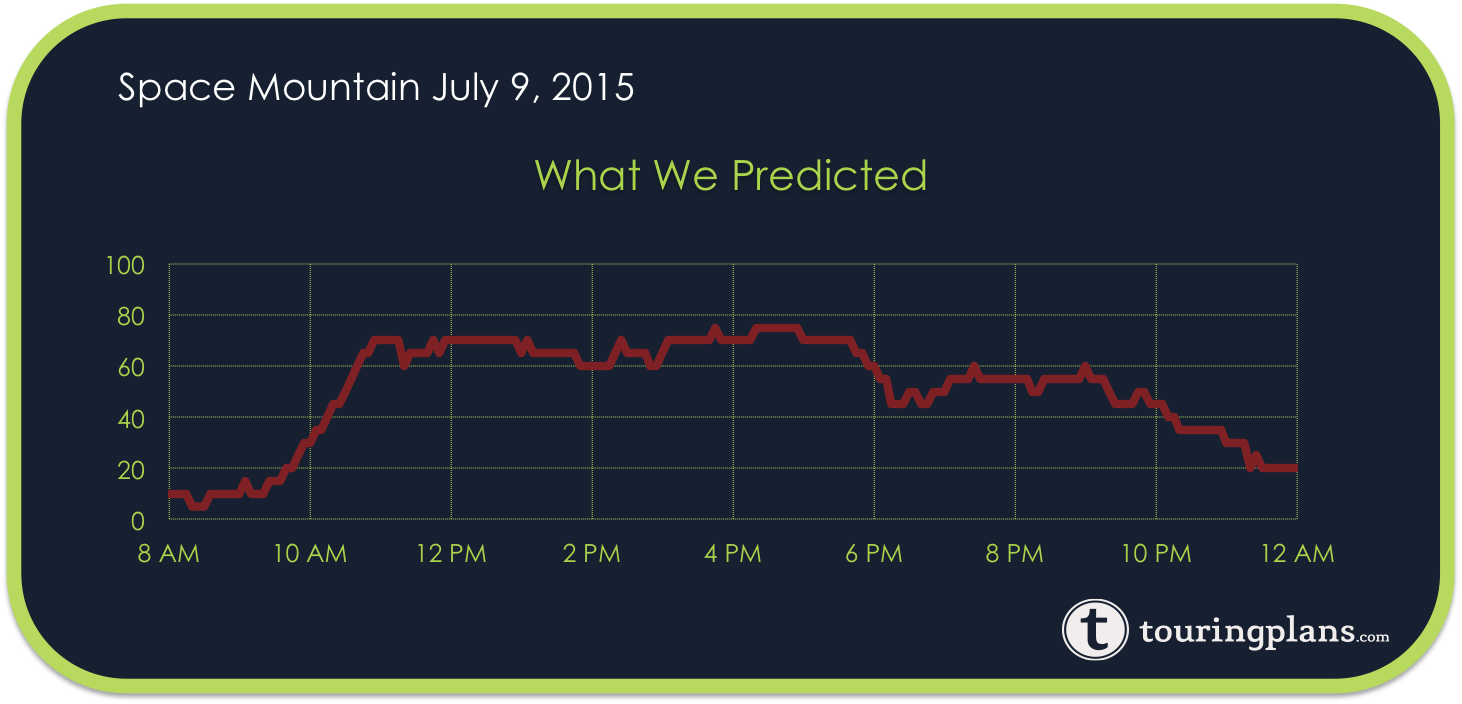
We predicted that the average posted wait time between 10 am and 5 pm for Space Mountain on July 9, 2015, would be 65 minutes. Next, we look up the number 65 in our distribution of average wait times for Space Mountain on the table below. There we see that a 65-minute average wait falls into the range of 59 and 67 minutes representing an ‘8’.
| Attraction | Level 1 | Level 2 | Level 3 | Level 4 | Level 5 | Level 6 | Level 7 | Level 8 | Level 9 | Level 10 |
|---|---|---|---|---|---|---|---|---|---|---|
| Space Mountain | <30 | 30-32 | 32-36 | 36-42 | 42-48 | 48-53 | 53-59 | 59-67 | 67-77 | >77 |
| Big Thunder Mtn | <23 | 23-26 | 26-28 | 28-32 | 32-35 | 35-38 | 38-41 | 41-45 | 45-49 | >49 |
| Buzz Lightyear | <14 | 14-16 | 16-19 | 19-23 | 23-28 | 28-32 | 32-37 | 37-41 | 41-45 | >45 |
| DINOSAUR | <16 | 16-18 | 18-19 | 19-21 | 21-23 | 23-25 | 25-27 | 27-29 | 29-33 | >33 |
| Expedition Everest | <22 | 22-24 | 24-27 | 27-30 | 30-33 | 33-37 | 37-40 | 40-46 | 46-54 | >54 |
| Great Movie Ride | <15 | 15-17 | 17-18 | 18-20 | 20-21 | 21-23 | 23-25 | 25-27 | 27-31 | >31 |
| Haunted Mansion | <18 | 18-20 | 20-22 | 22-24 | 24-26 | 26-28 | 28-31 | 31-34 | 34-39 | >39 |
| Jungle Cruise | <17 | 17-20 | 20-23 | 23-26 | 26-29 | 29-32 | 32-35 | 35-38 | 38-43 | >43 |
| Kali River Rapids | <12 | 12-14 | 14-18 | 18-24 | 24-30 | 30-36 | 36-42 | 42-50 | 50-60 | >60 |
| Kilimanjaro Safaris | <25 | 25-27 | 27-31 | 31-33 | 33-37 | 37-40 | 40-44 | 44-51 | 51-61 | >61 |
| Living w/ Land | <12 | 12-14 | 14-15 | 15-17 | 17-18 | 18-19 | 19-21 | 21-23 | 23-27 | >27 |
| Msn: SPACE Orange | <16 | 16-18 | 18-20 | 20-22 | 22-24 | 24-27 | 27-29 | 29-35 | 35-43 | >43 |
| Peter Pan’s Flight | <42 | 42-44 | 44-47 | 47-52 | 52-56 | 56-61 | 61-66 | 66-71 | 71-77 | >77 |
| Pirates of Caribbean | <11 | 11-13 | 13-14 | 14-16 | 16-19 | 19-21 | 21-23 | 23-28 | 28-35 | >35 |
| Primeval Whirl | <14 | 14-16 | 16-18 | 18-21 | 21-24 | 24-27 | 27-30 | 30-34 | 34-41 | >41 |
| Rock Coaster | <31 | 31-35 | 35-38 | 38-42 | 42-46 | 46-50 | 50-54 | 54-61 | 61-71 | >71 |
| Soarin’ | <45 | 45-48 | 48-52 | 52-56 | 56-61 | 61-66 | 66-70 | 70-77 | 77-86 | >86 |
| Spaceship Earth | <10 | 10-12 | 12-14 | 14-16 | 16-19 | 19-21 | 21-24 | 24-27 | 27-31 | >31 |
| Splash Mountain | <20 | 20-22 | 22-26 | 26-33 | 33-39 | 39-46 | 46-52 | 52-58 | 58-64 | >64 |
| Star Tours | <16 | 16-18 | 18-20 | 20-22 | 22-24 | 24-26 | 26-29 | 29-33 | 33-39 | >39 |
| Test Track | <37 | 37-39 | 39-43 | 43-50 | 50-56 | 56-63 | 63-70 | 70-78 | 78-88 | >88 |
| Tower of Terror | <34 | 34-37 | 37-42 | 42-47 | 47-53 | 53-59 | 59-65 | 65-72 | 72-80 | >80 |
| Toy Story Mania! | <57 | 57-62 | 62-65 | 65-69 | 69-73 | 73-77 | 77-81 | 81-87 | 87-95 | >95 |
| Winnie the Pooh | <24 | 24-26 | 26-28 | 28-29 | 29-31 | 31-32 | 32-34 | 34-35 | 35-38 | >38 |
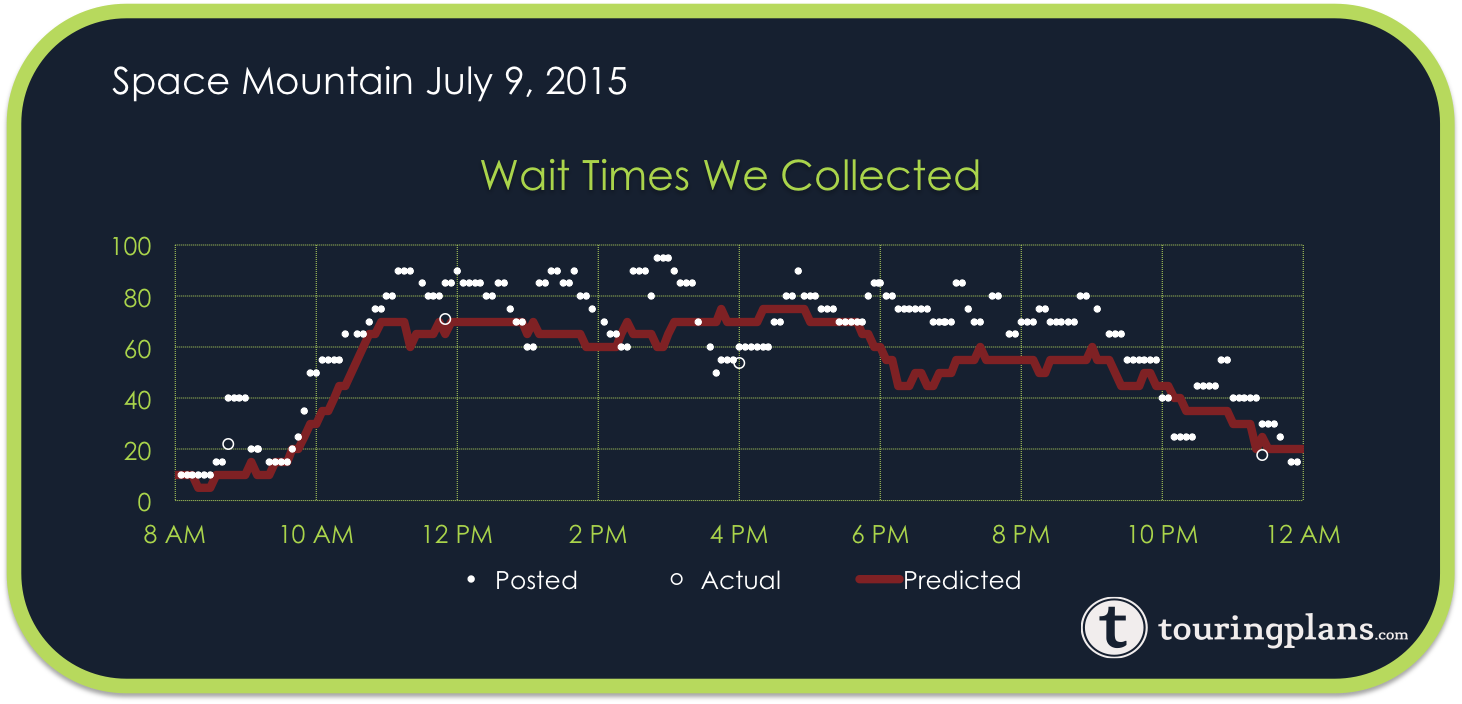
The above chart shows all the posted wait times collected for the July 9. The average observed wait time between 10 a.m. and 5 p.m. is 75 minutes. Wait times between 67 and 77 are a ‘9’. If you look at the forecast table at http://touringplans.com/magic-kingdom/wait-times/date/2015-07-09 you will see all the predicted and observed wait times for all the attractions at the Magic Kingdom on July 9. The attractions that are used for the Crowd Calendar will have a crowd level score next to the average wait times.
| ATTRACTION | AVERAGE WAIT TIME | CROWD LEVEL | ||
|---|---|---|---|---|
| PREDICTED | OBSERVED | PREDICTED | OBSERVED | |
| Big Thunder Mountain Railroad | 48 | 43 | 9 | 8 |
| Buzz Lightyear’s Space Ranger Spin | 40 | 38 | 8 | 8 |
| Jungle Cruise | 36 | 54 | 8 | 10 |
| Peter Pan’s Flight | 71 | 72 | 9 | 9 |
| Space Mountain | 65 | 75 | 8 | 9 |
| Splash Mountain | 56 | 66 | 8 | 10 |
| The Haunted Mansion | 31 | 36 | 8 | 9 |
| The Many Adventures of Winnie the Pooh | 31 | 32 | 5 | 7 |
Based on the predicted and observed data, the predicted crowd level for the Magic Kingdom was an 8, and the observed crowd level is a 9. The top of Crowd Calendar page will show how good our predictions were on the prior day. To see the details on any day, use the “Jump to Date” on the left-hand side of the Crowd Calendar page. To see all attractions’ predicted and actual wait times click on a specific park. To see only the attraction that feed into the crowd level choose “Click here to see individual attraction details used in determining crowd levels.”
We would like to say that we are 100% accurate with our predictions. From a statistical standpoint, this is an imposable goal. As you can see from the above chart, there is a lot of variation in submitted wait times. We do identify and exclude submissions that appear to be inaccurate. Some of the variation could be explained by effects that we cannot be aware of when the predictions are made. Some examples of these effects are weather, breakdowns, and schedule changes. For custom touring plans, we adjust the attraction predictions for day-of effects, but it is too late adjust the Crowd Calendar.
People may ask why we are focusing so much on posted wait times, when what is important is the actual wait time. The answer is that we are leveraging the information we have. Out of the millions of wait times we have, less than 1% of the data are actual wait times. Fortunately, the 1% gives us a way to predict the actual wait time based on the posted wait time. Another problem with that actual wait times we do have is that they are usually for times of day when it is optimal to ride an attraction. We do not have much data for actual wait times for the longest wait times of the day. For example, over the past two years, we only have two actual wait times for Soarin’ where the wait time is over two hours.
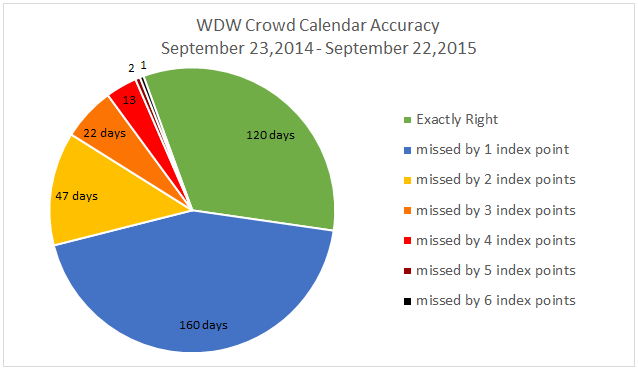
Our goal is to have our crowd level index within one point 90% of the time. Over the past year, we are within one index point 78% of the time, and within two index point 90% of the days. The higher than expected crowds has hurt our accuracy rate. Fred Hazelton will have a blog post coming up shortly, looking at possible explanations for why we’re seeing higher crowds in September.
We strive to have the most accurate predictions, and we are the only Disney World Crowd Calendar that publishes its accuracy.
You May Also Like...
-

The April Crowd Calendar update only has minor changes. We are halfway through spring break, and crowd levels have been in-line…
-

We have had a few weeks to observe the wait times at Universal Orlando Resort since the parks reopened in June.…
-
This Crowd Calendar update is a full update going through September 2021. To make such a long-range forecast we are making…
-
We have been holding off on doing any big Crowd Calendar updates until we saw how the crowds were in 2021.…
I was looking at your historical wait time charts and was getting confused between “Observed Wait Times” and “Actual Wait Times”. What’s the difference between “observed” and “actual”?
“Observed” vs “Predicted” is the actual wait time vs what we predicted.
“Posted” and “Actual” is on the chart. “Posted” is the posted wait time by Disney. “Actual” is the wait time a user submitted for the actual time they stood in line.
How is the “observed” wait time derived? I had assumed “observed” was taking from what users submission but that sounds like user submissions go under the “Actual Wait Time” data points instead of the “Observed.”
Steve will correct me if I’m wrong, but here’s what I think the four definitions are:
Predicted – What we said the posted wait time at a ride would be.
Observed – What the posted wait time at a ride actually was
Posted – The posted wait time at a ride
Actual – The actual time that someone waited for that ride.
In this case, “posted” and “observed” are very similar, and if there’s a difference it usually depends on the context of the discussion.
I love using touring plans for all our WDW vacations… Right from picking the days to travel!
Eagerly waiting on Fred’s post.
Our trip in January ended up being busier than originally predicted, but that worked out fine as touring plans emailed us the revision and we could adjust our plans accordingly.
Didn’t work out as well this month! Couldn’t believe how big of a bump there was in crowds while we were down there in the second week of September.
Fingers crossed for you guys, it’s irreplaceable when it works!!!
Accuracy is very important to us, but being transparent is as well. We are the only crowd calendar that evaluates every prediction we make every day.
This is hands-down the most accurate and transparent Disney wait times App/site out there. It also gives me nerd props to statistically plan out the perfect vacation.
One suggestion, if you need additional real wait times during peak times, you should add some additional gamification to the app to encourage the regulars to submit them. Perhaps a badge for the person who submits the longest actual wait time, like you have for the person who submits the most wait times. Or a place for you to compete with others in the park that day for most actual wait times submitted. Or badges for time spent waiting in line- for example a badge based on actual wait times if you hit one hour collective wait time during a day. The key is getting the season pass holders to submit them in return for bragging rights because the once a year vacation visitor won’t.
These are great ideas, Sarah. Also, to encourage more wait time submissions, maybe it could be easier to get to the line timers (or maybe even a separate app?) Sometimes I would submit wait times but in the midst of wrangling children, I don’t always have what it takes to go many levels down into the app to get to the timer. (It’s possible that I just don’t know the app well enough yet, but I wanted to toss the idea out there.)
For me, the biggest barrier to submitting real wait times is the battery drain on my phone. Even with a large portable battery, nursing my phone battery is a priority to ensure that I’m able to take pictures, share, and keep tabs on my touring plan. It only takes seconds to share a posted time, but compound the CPU usage and screen time for an actual time over many attractions and it makes a difference.
Good stuff. Your data helped us make the best of our visit. The 10-5 hours at DLR help plan calendar timing, but addressing the packed evenings where the major rides close with some of their longest waits in the day would really benefit touring plans.
Would you all be willing to share a percentage or actual numbers of wait times you get from universal/ IOA in comparison to the magic kingdom?
It’s almost certainly in low thousands of wait times per day for Universal, and high thousands for WDW.
Over an 11-hour day today at USF, we got around 70 wait times just for Rip Ride Rockit. That’s a little under what we’d expect on most rides over that time period.
Thanks for your explanations here. I don’t expect perfection but I do appreciate explanations when crowd predictions are off target. September was way busier than I expected. Yes, a touring plan is great, but as someone who pushes a stroller, I want to know what crowds will be like, too. Looking forward to Fred’s post, and wistfully looking back on the times that there really were “slow” days at WDW.
Another vote of appreciation both for the careful work, as well as the transparency. Even as as the secret times have disappeared, it’s still very valuable to have this information. If crowds are going to busier than I expected, it’s great to have, at minimum, a heads up that the last few weeks have been trending over. That transparency is big benefit to this site.
As a veteran math teacher and a Disney fanatic, this stuff is absolutely fascinating!
For a Touring Plan user, the crowd does not matter. That is the advantage of having a plan. I have been at WDW for the super crowds – July 4th and New Years Eve. Using a plan and getting good fastpasses to work with the plan I have been able to get in a lot of attractions. The key to super crowd days is to skip a step when you get behind. Evaluate and optimize frequently. Although your plan never tells you to get them, those extra fastpasses after you use your first three are a big help. I never pass a fp kiosk without getting one. Take an extra battery or a quick charger for your phone. You will need it.
I have also done the super crowd days without a plan. I go in with the attitude that I don’t care if I ride a single ride. I am just there to go with the flow, and see what happens. Sometimes at MK I play “Sorcerers of the FastPass Kiosk” which means I only ride rides with fastpasses, and play sorcerers of the magic kingdom between each one.
To paraphrase the late Yogi Berra: If it keeps getting more and more crowded, people are going to stop going.
I’ll second my appreciation for transparency. Our early September trip certainly was much busier than we were expecting, so I’m looking forward to Fred’s upcoming post.
Ditto
I appreciate the transparency of TouringPlans, especially when it comes to wait times, etc. Perfection is impossible, especially with so many variables.
Crowd levels just aren’t varying the way they used to when I was growing up. In the 80s and 90s, I remember the times going in the fall or in January and the crowds (if you could call them that) were non-existent.
It was wonderful times, but they are history.
People don’t just travel during school vacations anymore; WDW no longer has slow periods.
I think people need to shift expectations about crowds and lines at WDW across the board. Crowd calendars are a tool to hopefully lessen the amount of time waiting, but they can’t eliminate it entirely.
Anyway, I appreciate the TP people who crunch the numbers and then openly share what works and what needs to be re-evaluated. It’s a constant work-in-progress.
Hi,
I’ve been looking at the DLR calendar and it is usually off by 1-5 points, and I’m not seeing a time where the crowds are ever lower than Touring Plans predicted.
I know the premise of your site is that a good touring plan will prevent you from wiating in lines. But I want to visit the parks when the crowds are expected to be lower. That’s important to me.
These days I think the only way to visit when the crowds are lower is to get a time machine set back to fall 2001. Until the economy ends up in its next major downturn or Disney raises its current prices by at least 1/3, I don’t think that there will be times when crowds are much lower, I’m afraid. 🙁
It’s a bummer that they never adjusted the crowd levels for Disneyland after a month or two of underestimating how much of an impact the 60th anniversary would have.
It’s not just about allowing subscribers to pick a day with lower crowds, the Lines app uses the crowd levels to estimate wait times and create personalized plans. It doesn’t work when it’s off by 3 or more points.
How often are the crowd calendar predictions evaluated or changed? Is there a schedule? I pick trip dates based on the crowd calendar and like to make plans early. But, earlier this year, after we already had our end of October reservations made, the numbers were raised significantly for the days we will be there. I’m wondering if it’s wiser to make plans only a certain number of days out.
We evaluated our predictions every day. We try to minimize the number of changes. If there are only small changes in our new predictions, we will choose not to change the calendar. We try to balance the stability of the crowd calendar, and the accuracy.