
How Are Disney World Ticket Price Increases Socking Your Pocket?
For four years the cheapest single day Disney World ticket has been $109, and the most expensive has been $159. This kind of stability might be portrayed by some outlets as “No change in ticket price”, but here at TouringPlans we are smarter than that. Where has Disney been putting the increases? How big have they been? What should you expect going forward? Let’s take a look.
A Little History
When Disney World first opened, pricing was variable. You paid a fixed admission to the park and then an additional fee for books of attraction tickets that gave you access to the rides and shows. The use of the letters A through E to designate which rides tickets could be used for is the origin of the term “E-ticket” that is used today to refer to headliners and super-headliners.
![]() In the early 1980s Disney World switched to the gate-fee only model that we have now, and in 2005 the introduction of the Magic Your Way ticket debuted steep discounting for tickets of 5 days or more. Does that year sound familiar? It’s also the year that Magical Express was founded, giving Disney World guests an easy way to get to the resort. Magic Your Way tickets made it easier for families to plan a few extra days into their vacations by minimizing the added ticket cost. Magical Express made it harder for those families to leave the “Disney bubble” with their extra relaxation time, ensuring that resort activities and dining would capture the bulk of their additional vacation spending.
In the early 1980s Disney World switched to the gate-fee only model that we have now, and in 2005 the introduction of the Magic Your Way ticket debuted steep discounting for tickets of 5 days or more. Does that year sound familiar? It’s also the year that Magical Express was founded, giving Disney World guests an easy way to get to the resort. Magic Your Way tickets made it easier for families to plan a few extra days into their vacations by minimizing the added ticket cost. Magical Express made it harder for those families to leave the “Disney bubble” with their extra relaxation time, ensuring that resort activities and dining would capture the bulk of their additional vacation spending.
Fast forward a decade to 2016, when Disney brought out its next ticket innovation, variable date pricing. Multi-day tickets were still operating on the same Magic Your Way model, but single day tickets would be priced based on three “seasons”: Peak, Regular, and Value. In 2018 the seasonal pricing was expanded to multi-day tickets, and in 2019 a new “Holiday” tier was announced.

Since 2019, it’s all been quiet on the Disney ticket announcement front. Prices have been adjusted as new batches of tickets were released, a few months at a time. Nobody has noticed (much) as the number of tiers in an individual year increased from 4 to 19. And Disney has been spared the routine PR backlash that predictably followed its yearly ticket price adjustments. If Disney could somehow accomplish this same trick of not having to announce price increases for Annual Passes, I feel quite confident that they would.
How Do I Compare Thee …
Using rolling release windows and expanding the number of tiers makes it much harder to compare prices. Disney’s official reason for moving to flexible pricing was to encourage guests to visit during less popular times of the year, shifting crowds and making everyone’s experience more pleasant. In practice, it turns out that it’s easy to answer the question “What is the ticket price on this date”, but not so easy to compare different dates and answer the question “When are tickets cheaper so that I may visit at those times?” (ICYMI: Every Regular Disney World Ticket Price in 2022.)
It’s also not so easy to answer questions about year-over-year increases. If you want to do something like comparing the Value tier in 2020 to the Value tier in 2021, first you have to figure out what’s in the Value tier for each of those years now that you’ve got so many more individual prices.
What’s In A Tier?

You might be thinking that this is a very strange looking chart, and I wouldn’t disagree with you. Let me explain it. Each line going across is a year. Each bubble on that line is one of the ticket prices from that year. And the size of each bubble represents the number of days with that price. So what we get here is not just a list of what the prices are, but an idea of how likely we are to pay that price if we pick a day to visit at random.
It’s easy to see that even though the lowest ticket price hasn’t changed, over the years prices in that lower tier have spread out and increased. The shift in “weight” towards the right side of the chart as we move forward in years mirrors what the park visitor sees — unless they’ve picked their dates with extreme care, their tickets cost more every year.

Our challenge is to somehow divide up each string of bubbles into regions that represent the original Value, Regular, Peak, and Holiday tiers, but “This kind of looks like where it should go” isn’t actually a good method for doing these kinds of assignments. I decided to go with a guiding principle to try to keep the number of days in each tier roughly the same. After all, if more than half the tickets are “Peak” price then that isn’t really anything out of the ordinary, right? In cases where there was still some ambiguity (some of these groups had as few as four or five tickets in them), I looked at the distance to the next price on either side. If it wasn’t clear where to assign $138, and the two adjacent numbers were $135 and $139, then I put it in the same tier as $139 because $138 is closer to $139 than to $135.

So? And?
Now that we have done all that number munging (wipes sweat from brow), we can finally get down to some straightforward price comparisons with historical data.

It turns out that this comparison is just not very exciting. From 2006 to 2018, Disney raised ticket prices about $3-5 a year, on average. And in the last four years since going to flexible pricing for all regular tickets, Disney has raised ticket prices … about $3-5 per year, on average.
Looking at those numbers, you might be tempted to wonder why Disney even bothers with flexible date pricing. It’s confusing for guests, it makes changing tickets complicated, and it makes it hard to plan. But just remember:
- The frequency of ticket price announcements has been drastically reduced.
- Even though the middle tiers are moving, the endpoints are firm. “Tickets range from $109 at the low end to $159 for the most expensive days right around Christmas” sounds much better than “A single-day ticket is $135.”
- It may be that Disney truly wishes that people would come on the less popular days, but the reality is that many people don’t have that kind of flexibility. The increase in acceptance of surge pricing strategies means that Disney is free to say that if you can’t change your dates, they’re happy to take more of your money.
The Road Ahead
Now, I hope it’s obvious that Disney won’t be able to get away with leaving the endpoints unchanged forever. So how is Disney going to finagle this moving forward? I have absolutely no insider knowledge, but I love to make educated guesses. To try and suss out what’s going to happen in the future, let’s take a deep dive into exactly where in the calendar Disney has been nudging prices up over the last few years.
As you look at the chart below, remember that it’s important to properly contextualize the alignment. Years after 2019 were shifted to the right so as to keep weekend days synched up with each other. Similarly, some holidays align well from year to year (Columbus Day) while others shift around (Easter) or may even be on different days of the week (Christmas). Just looking at April from year to year it doesn’t seem to make a lot of sense, but if you evaluate it on the basis of Easter week then you can find the pattern.
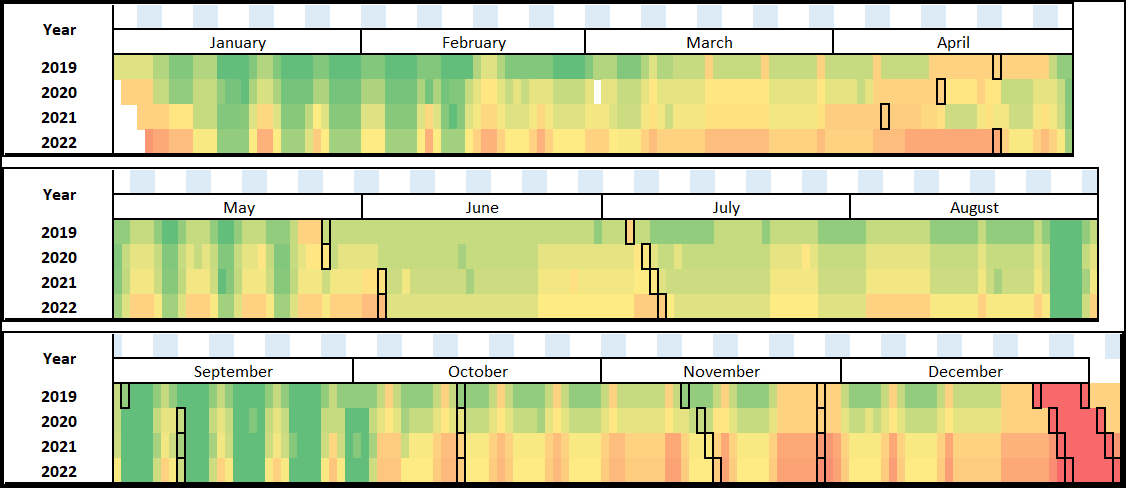
Here are a few things that stand out to me:
- June, July, and August are nowhere near being the peak periods that they used to be. This is consistent with Disney’s changes to DVC point charts beginning in 2021 that reduced the number of points required for those summer stays and increased the price of fall bookings.
- What’s up with August? June and July are pretty consistent through all four years, but August in 2022 takes a big jump. The only thing I can think of is that Disney may be expecting a lot of Europeans on their August vacation after borders were closed during 2020 and 2021.
- Thanksgiving and Easter are getting pretty expensive. Especially Thanksgiving; this jibes with Disney’s shift of the blockout period from Easter to Thanksgiving when changing from the DVC Gold Annual Pass to the newer Sorcerer Annual Pass.
- Weekends in January, February, and September have steady and disproportionate price increases. The overall increase might be $3-5 per tier, but these weekends have gone up faster than that.
Predictions
Putting together what we see above with the rightward shift that we saw in the bubble charts, here’s my best speculation. I think that within 2 years Thursday, Friday, and Saturday of Thanksgiving weekend will officially become part of the Holiday tier. That makes some space for the rest of the prices to keep shifting up; kind of like a younger kid who gets to drive the car a lot more after their older sibling moves out. Easter week may follow the year after so that Disney can pull it back out as a show of goodwill when they finally have to bite the bullet and raise the price of the holiday tier.
We’ll continue to see those disproportionate increases for January, February, and September weekends. Many who want to visit in those months for the EPCOT Festivals can’t come during the week. For those who do make longer trips, the increases ripple out to the multi-day tickets but the overall impact feels blunted. You can see on the chart below how quickly the weekend variation fades out. On the other end, June and July will see smaller relative increases as their popularity continues to be low.

Within the “Value”, “Regular”, and “Peak” tiers prices will continue to increase at about $3-5 per year. In the Value group, Disney will hold firm on that $109 price point for optics as long as they can, and will try to retain the same number of days at that price (it’s been 22 days for the last three years).
In 3-4 years, Disney will be forced to raise the price of the Holiday tier or the Peak tier’s routine increases will overtake it. When they do, they will make a big jump — at least $20 or $30 — in order to gain space at the top of the price distribution so they don’t have to do it again soon. Many will note that it seems a really huge increase, but that “Disney hasn’t raised the price on those tickets in 8 years so it really is just playing catch up”.
What to Take Away
Disney’s shift to flexible date pricing, combined with releasing tickets a few months at a time and not changing the highest and lowest prices, has helped ticket price increases fly under the radar. But when we do the work to examine these increases in detail, they turn out to be nothing special, just the same old $3-5 per year increase we’ve been seeing for the last 15 years. It’s only speculation, but we can probably expect to see this same trend in the coming years. If Disney wants to continue upping the intermediate prices without raising the rate on the top Holiday tier they’ll have to get creative, possibly moving Thanksgiving and/or Easter into the Holiday tier. And eventually, even that won’t be enough and they’ll have to raise the roof; there’s a good chance they’ll put up a big increase at that time to avoid having to do it again for a while.
Do these numbers surprise you? What do you think is going on with the increases for August? Do you think I’m right that Disney will move Thanksgiving to the Holiday Tier by 2024? Let us know in the comments!
Correction: Some of the analysis in this article relied on an assumption that Disney would not increase prices after release as they had done prior to 2019. In February 2022, that assumption was shown to be false.

You May Also Like...
-

Perhaps there's a glitch in the space time continuum, but there's some bargain pricing happening right now at the Confectionery on…
-

Today Walt Disney World increased ticket prices. For those who are unaware, the Walt Disney World Resort uses date-based ticket pricing.…
-

It’s that time again. Time for the annual Disneyland Resort ticket price increase. Disneyland uses seasonal pricing, however there is a…
-

You know you need a ticket to get into a Disney World theme park, but once you have that ticket it's…
I love maps. I love data. I love statistics. Jennifer, you are a rock star! This is all so very interesting. I was shocked when I looked at ticket prices the week after Thanksgiving. Usually, that week is dead and a wonderful and relaxing time to visit Disney. So why were hotel rooms and ticket prices so much higher? You’ve partially answered my question. Thanks for sharing!
Thanks Sharon!
Sadly Disney nixed my hypothesis that they would just hide the price increases in the smaller ticket batches going forward when they raised prices last week. 🙁 We’ll have an update to the every-ticket-price article later this week.
Great article! Personally, i think Disney has done the same thing that ice cream companies and diaper companies have done for decades to hide their price increases- they just put less in the package. No more Magical Express, no free fastpass/fastpass+, smaller portions/selections and lower quality on food, decreased entertainment offering, no trams(!), less ride maintenance, no more evening extra magic hours, etc.
Had they done all those things gradually, I would agree. But they have cut all those things within the last year (in the Bob Chapek era), and the public has wised up to his tactics.
But at least the trams are coming back…
Hey Tiffany, thanks for reading. I agree that park hours had been shrinking some over the years, but a lot of the rest of the operational changes you mention are COVID-closure related so I’m going to reserve judgment until I see what comes back.
Per Magical Express, I honestly feel that Disney took a bad rap on this one in some ways. Resort fees are a big deal in the hotel world and many people regard them as dishonest. 10 years ago, your Disney room fee included the cost of parking whether you brought a car with you or not, and it included the cost of Magical Express whether you used it or not. Disney has moved to charging for parking — but of course, only those guests who actually *use* the parking — and discontinued Magical Express, and they’ve taken nothing but heat on either front. Now, it’s true that they haven’t dropped their room rates to “compensate” and this could certainly be viewed as hiding their increases. But it could also be viewed as moving to a model where they’re only charging people for services that they actually use, yet somehow nobody ever seems to see it that way. I think a lot of these changes are much more nuanced than they seem at first glance.
Why those sneaky Disney execs! But they can’t fool you, can they, Jennifer?
Hey TwoBits – to be fair, I don’t think anyone who really follows Disney had any illusions that prices weren’t changing. 🙂 They just made it harder to quantify. And truthfully, I don’t blame them — they do seem to serve as a lightning rod sometimes, pulling down tons of critique for things that other companies do without significant public comment. It’s still important to do the work occasionally (helps keep things honest), but I’m not actually that surprised to find that from some perspectives this exercise could be considered to have turned out a snipe hunt.
Great analysis! Love the color coding on the charts. The heatmap of the days of the year really speaks volumes about how to select dates for your needs.
Thanks! If you’re looking for more of those heatmaps, the linked article in the text (https://touringplans.com/blog/every-regular-disney-world-ticket-price-in-2022/) has them along with the actual ticket prices.
Very well done. Thank you.
The color coding of the bubbles really made the tiers stand out. Identifying the number of days at the price point is also crazy to see. Well done.