Walt Disney World Crowd Report – January 5 to 11, 2014
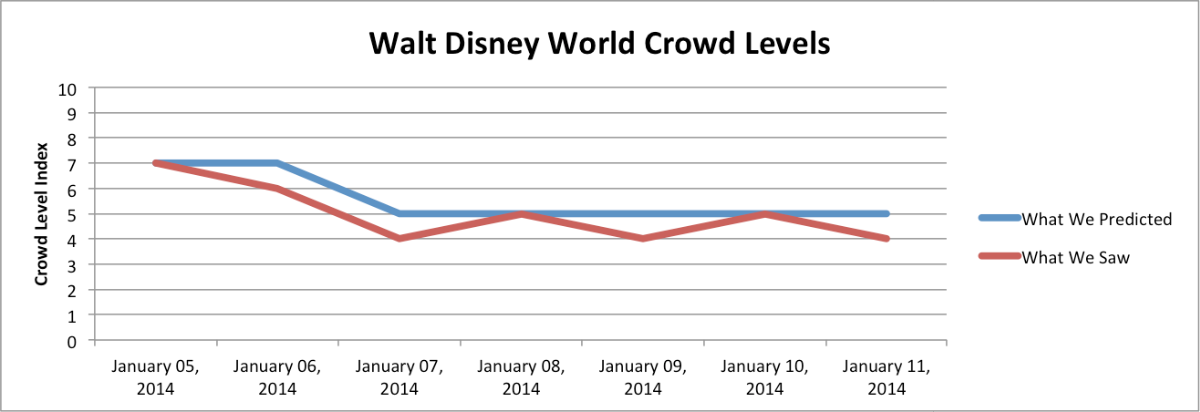
Extreme wait times from the Christmas Holiday have subsided at Walt Disney World, and guests who chose to extend their vacations into the second week of January experienced some below average waits. The remnants of holiday crowds remained through Sunday and Monday, but once Tuesday arrived, crowds stayed at or below average. Predictions did well again this week, with the exception of some overestimates at Epcot. Epcot’s wait times came in distinctly lower than history would suggest for early January.
Let’s look at how the crowd levels stacked up day-to-day.


| January 5, 2014 to January 11, 2014 |
|---|
Seven was the lucky number on our scale Sunday. All crowd levels came in at a level ‘7’ with the exception of Epcot which only reached ‘5’. All of Epcot’s attractions had average wait times below a level ‘8’. Average posted times were 70 minutes at Soarin’, 74 at Test Track, 24 at Mission: Space (Orange) and 15 minutes at Spaceship Earth. We correctly predicted the ‘7’s for Magic Kingdom, The Studios and the resort-wide number. We predicted one level lower at Animal Kingdom and overshot by three at Epcot. Sunday saw the conclusion of this year’s rendition of The Osborne Family Spectacle of Dancing Lights at The Studios.
Predictions were solid on Monday with no estimate missing by more than one index level. Animal Kingdom was a ‘5’ as predicted while Magic Kingdom and The Studios were a ‘7’. Epcot came in at a ‘6’. Sunday and Monday were the first two days after the holiday season where we didn’t see any crowd level reach greater than ‘8’. This is not surprising since most resort guests end their holiday vacation on the first weekend after New Year’s Day. Interesting that Animal Kingdom hosted Extra Magic Hour morning but had the lowest crowd of the four parks.
Animal Kingdom crowds were even lower on Tuesday with a surprising crowd level of ‘2’, three points lower than the ‘5’ we predicted. In fact, the highest crowd level at any park was the ‘5’ recorded at The Studios. Magic Kingdom was a ‘4’, its lowest crowd level since December 20, 2013. Epcot also was a ‘4’ with average posted times under 70 minutes for both Soarin’ and Test Track. The highest average wait of the day was the 78 minute average at The Studios’ Toy Story Mania.
On Wednesday, wait times were average resort-wide. Epcot had the lowest waits with Test Track reaching an average posted wait of 50 minutes. That is quite low, much lower than average which pushed Epcot’s resort crowd level to a ‘3’ on our scale, we predicted ‘5’. Everywhere else, waits stayed around average as predicted. Space Mountain averaged 45 minutes, Soarin’ 64, Toy Story Mania 74 and Expedition Everest 25 minutes.
Animal Kingdom and Epcot both came in at a level ‘3’ on Thursday, two index points lower than the ‘5’s predicted. No attraction at Animal Kingdom reached an average posted time greater than 21 minutes while the two super-headliners at Epcot stayed below 70 minutes. In fact, Soarin’ only topped out at at a 58 minute average, that’s a 3 out of 10 on our attraction level scale for Soarin’. As predicted, Magic Kingdom was the only park reaching posted times above average. Extra Magic Hour morning at Magic Kingdom kept wait times at average or higher for all attractions except for Winnie the Pooh which averaged 28 minutes.
Our prediction of a resort-wide level ‘5’ was correct again on Friday. Only The Studios had wait times that came in higher than expected with a park-wide level ‘6’ instead of the ‘5’ we predicted. Epcot had the lowest waits again with averages equated to a level ‘3’ on our scale, three points lower than we predicted. It is interesting than Epcot crowds have underwhelmed all week, with averages much lower than expected and lower than history would suggest for this time of year.
Many guests must have taken our advice to avoid Epcot during Marathon weekend since Epcot crowds came in low again on Saturday at a level ‘2’, the lowest crowd of any park for the week. Soarin’s average posted wait was only 46 minutes, the lowest you are likely to see all year. Mission: Space and Living With The Land also had average posted times in the lowest range. Resort wide the crowds were a ‘4’, one level less than the ‘5’ we expected.
| January 12 to January 18, 2014 |
|---|
Walt Disney World Resort will continue with below average wait times throughout the resort this week as Marathon participants complete their races and visit the parks with their families. Martin Luther King Jr. Day will typically bring the first bump in attendance of the year. Weather may play a role in the crowds again this week if cooler temperatures keep guests away from the parks. Even if the weather stays warm, guests to the parks are unlikely to experience crowds greater than the average for the year.
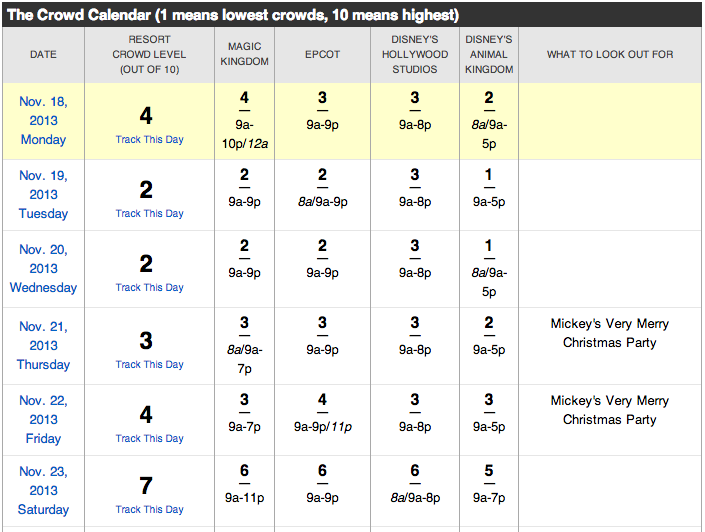
To see Walt Disney World Crowd predictions for the days of your vacation, check the Crowd Calendar.

To get details about our predictions of future crowds or details about crowds in the past check out the Crowd Calendar and select “Jump to Date” on the left margin.


We’re locals with passes and, on my husband’s whim, decided to head to Magic Kingdom on Saturday. We got to the gates around 10:30am and were stunned by the posted 20 min. wait for Space Mountain! We were both able to ride (using baby swap), which was a real treat since it is a ride we usually end up skipping due to the wait. By the time we rode Under the Sea (15 minutes posted) and got some lunch, the crowds were starting to really come in, so we bailed. But, overall, it was surprisingly light.