Walt Disney World Crowd Report November 17 to 23, 2013
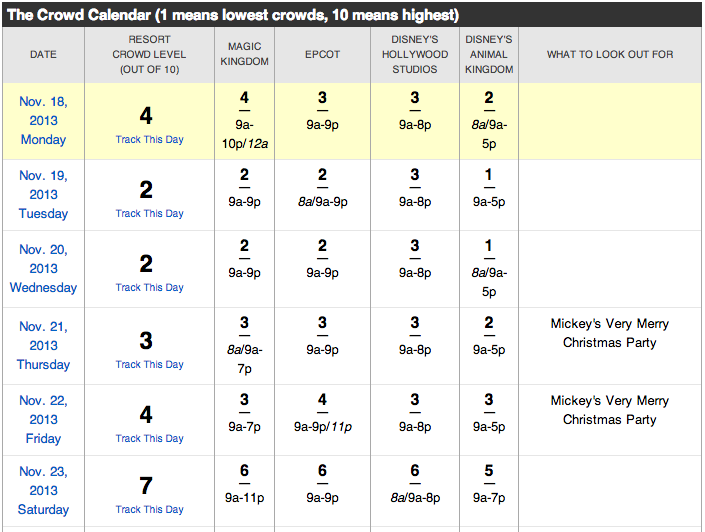
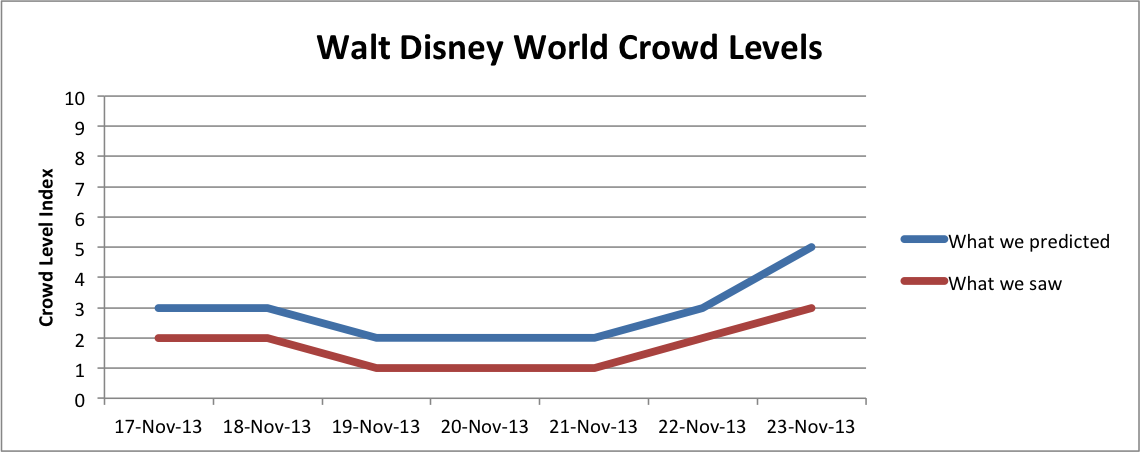
November 17 to 23, 2013, ended up being a great week for low crowds at Walt Disney World. Our Crowd Calendar predicted low crowds all week with the exception of Saturday. In fact, wait times came in even lower than our predictions, including on Saturday. Although our predictions hit the mark at the park level for some days, in general we overshot by one index level. If you used our calendar and selected last week for your trip to Disney World, you experienced some of the lowest wait times of the year.
The Walt Disney World Crowd Report – November 17 to 23, 2013
On Sunday we predicted Epcot to be a ‘4’ and Animal Kingdom to be a ‘1’ while the opposite ended up occurring. Soarin’ averaged 50 minutes and Test Track 41 rather than the 67 and 53 we predicted, respectively. Those numbers translate to a ‘1’ at Epcot. At Animal Kingdom it was Kilimanjaro Safaris hitting an average of 26 minutes and Kali River Rapids at 28 minutes that pulled that park’s level to a ‘3’, still below average.
Both Epcot and Animal Kingdom bottomed out at a level ‘1’ on Monday and were joined by Hollywood Studios. Magic Kingdom was not much busier, only reaching a level ‘3’ on our scale, one under the predicted ‘4’.
We accurately predicted that no park would exceed level ‘2’ on Tuesday. In fact, according to our scale, only Magic Kingdom wait times reached a ‘2’. That makes November 19 one of the slowest days of the year. For example, the average posted wait time between 10am and 5pm at Rock ‘n’ Roller Coaster was 28 minutes.
Once again, low wait times abound on Wednesday with a level ‘1’ resort-wide. We had predicted a ‘3’ at the Studios as the highest park level, but even that park did not reach wait times higher than a park-wide ‘1’. Even at a ‘1’, the average posted wait time at Toy Story Mania was 60 minutes.
Predictably, Mickey’s Very Merry Christmas Party brought low wait times through the day at the Magic Kingdom, but low waits were not exclusive to that park. In fact, all parks stayed at a level ‘1’, bettering the low we saw on Tuesday. For your reference, Space Mountain had posted wait times averaging only 11 minutes during the middle part of the day!
Another Mickey’s Very Merry Christmas Party on Friday kept wait times low during the day. We correctly predicted a level ‘2’ during the day at the Magic Kingdom but slightly over-predicted each of the other parks by 1 index level.
We predicted that the wait times would pick up significantly on Saturday with a resort-wide ‘5’ on the calendar for Saturday. In fact, we saw the resort-wide come in two points lower at a ‘3’, thanks to surprisingly low wait times at Epcot and the Studios. We over-predicted, by a significant margin, the average wait times at Soarin’ (54 vs. 83 minutes) and Test Track (54 vs. 94 minutes), as well as at Rock ‘n Roller Coaster (51 vs. 84 minutes), but our predictions at the other two parks were very accurate for most attractions.
____________________________________________________________
What to Expect This Week
This coming week brings Thanksgiving crowds to Walt Disney World. Thanksgiving is the third busiest week of the year, behind Easter and Christmas. Wait times are closer to those of the busy Easter week than they are to the insanity that is Christmas week crowds. The influx for Thanksgiving week has already begun and is expected to continue until Sunday or Monday. To see Walt Disney World Crowd predictions for every day between 2006 and one year from today, check the Crowd Calendar.
Mickey’s Very Merry Christmas Party season continues at the Magic Kingdom this week, which means savvy planners who don’t mind the shortened park hours can experience low wait times during the day.
To get details about our predictions of future crowds or details about crowds in the past check out the Crowd Calendar and select “Jump to Date” on the left margin.


We used your crowd calendar to choose the week of Nov. 16 – 24th for our Disney Vacation. I have never been to Disney with park crowd levels so low! We walked onto every ride. Mon we walked right onto Test Track and Soarin, Tue we rode Safari twice and Kali river rapids twice, Wed Peter Pan had a 60 minute wait but we got a fastpass+ and walked right on. We even got a curbside viewing spot for the electrical parade on Wednesday 15 minutes before it started. With an impatient 5 and 3 year old low crowds were really important to us (we planned 8 months out for the trip). THANK YOU SO MUCH!
We were there Thursday – Saturday and had a great experience. Using the crowd calendar as a guide, we went to Epcot on Thursday (with an excursion to DHS that night), DHS on Friday (with a trip to Epcot for Illuminations that night), and Magic Kingdom on Saturday. While there were some longer wait times posted (Soarin’ got to about 60 minutes on Thursday & Peter Pan got to 65 on Saturday), there were FPs available almost all day for everything but Toy Story on Friday.
When we didn’t have FPs available, at most we had 10-20 minute waits for rides like Space Mountain and Tower of Terror. (We even hit Soarin’ on Friday night with only about a 25 minute wait.) But most rides were walk-ons (Spaceship Earth, Pirates, and, even the new Little Mermaid ride). After Wishes on Saturday night, the park emptied and we walked on to Splash Mountain and Space Mountain with no wait.
It rained on Thursday afternoon and night, so that may have helped clear some of the crowds out on that day. Still, other than Saturday between 1-4, I didn’t even feel like the parks were crowded at all. Great job on the crowd forecast.
We were at Disney World from Nov 16-20. Wait times were generally very short except the most popular rides. It was still often very crowded in walkways, especially at Animal Kingdom and New Fantasyland. We even left most parks in the middle of the day to avoid crowds and rest.
Toy Story Mania was crazy busy on Nov 18. We arrived at HS 20 minutes early and there were over 1000 people waiting to enter the park with lines past the ticket windows. They all went to Toy Story. We waited another 45 minutes after hurrying to the ride. The lines for fast pass machines were almost as long. When we got off the fast pass machine was available but only for tickets the last 30 minutes before closing. Later we found out that Toy Story was staying open and extra 30 minutes past park closing and we rode it twice. Fantasmic had only one showing so it was still crowded trying to enter and leave (and find a stroller at parking – should have used a glow stick on it).
We were there last week and the crowds were wonderful! We never had to wait longer than 20 minutes for anything, and most rides we could just walk on. I used my touringplans app constantly and it was so helpful!
This weekly analysis is great! Definitely adds credibility to the Crowd Calendar 4 predictions.