Announcing Disney World Crowd Calendar 4
 Today we’re launching a new version of our Disney World Crowd Calendar.
The new Crowd Calendar is still based on attraction wait times and still uses a 1 to 10 scale, where 1 means small crowds and 10 means large crowds.
Most of the changes are behind the scenes to improve the accuracy of our analysis of past crowds and of future crowd level predictions.
The changes you’ll see will make the calendar easier to use and understand:
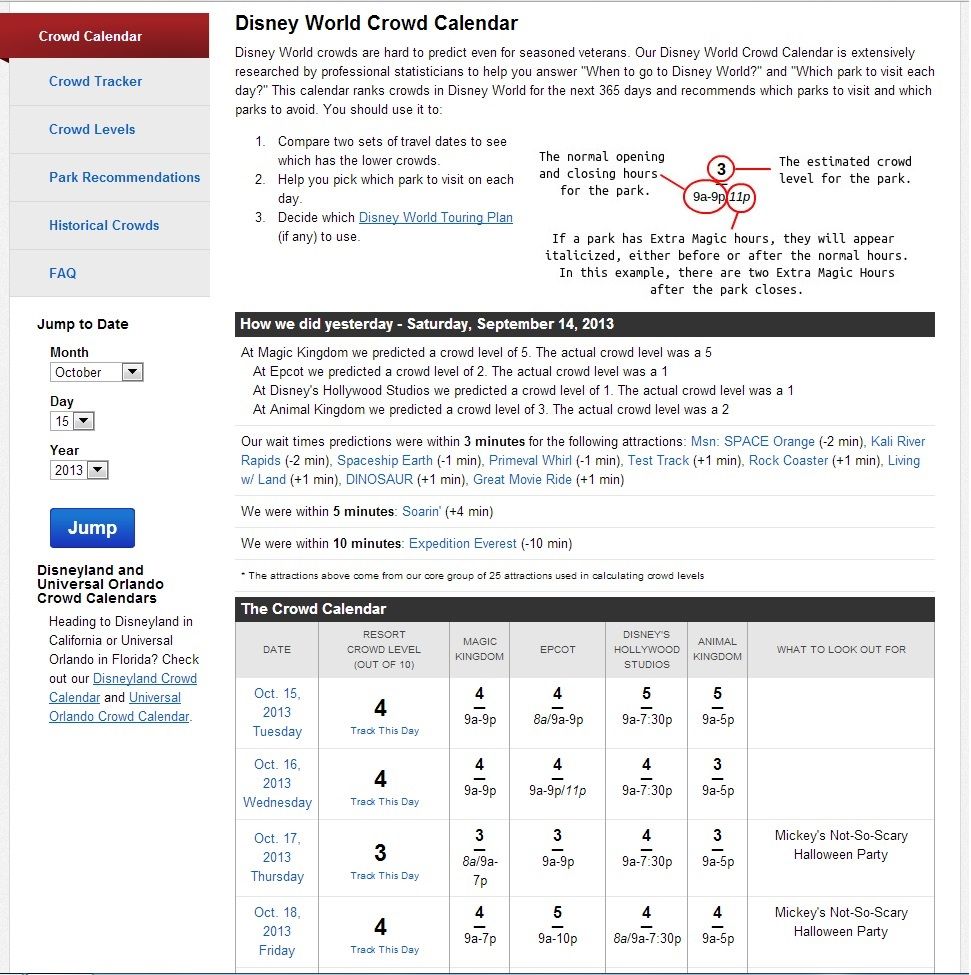
- Each park’s crowd level on the same page. You’ll see the crowd levels for all of Walt Disney World, Magic Kingdom, Epcot, Hollywood Studios, and Animal Kingdom all on the same page, along with each park’s schedule and Extra Magic Hours. We’ve reduced the number of clicks needed to find information.
- Explanations of how holidays and special events affect crowds. We’ve always listed important special events and holidays on the crowd calendar and now we’ve added descriptions of how they affect the parks. You can see those descriptions on our Crowd Levels page.
- More 4’s, 5’s, and 6’s; Fewer 1’s and 10’s. The previous crowd calendar took all the days in our database and assigned a crowd level of 1 to the least-busy 10%, a crowd level of 2 to the next-slowest 10%, 3 to the next-slowest 10%, and so on. The busiest 10% got a crowd level of 10. This relative ranking idea is great for comparing days, but it means that minor bumps in waits sometimes meant big jumps in crowd levels. For example, the difference between a crowd level of 2 and a 9 at The Barnstormer was about 10 minutes in line. Instead, with the new calendar, a minor bump in wait times will mean a minor bump in the crowd level too.
- No decimal points. Based on reader feedback, the calendar now uses only whole numbers. Thus, you’ll see Magic Kingdom crowd level predictions of 1, 5, or 7, but not 1.4, 5.3 or 7.8. It’s simpler and easier to read.
- No “7-Day Rule.” Since the very first crowd calendar, we’ve always tried to recommend each park at least one day per week, so that families visiting during that week would know the best day to visit each park. Unfortunately, there were times where special events and holidays forced us to recommend a park when it wasn’t the best day for everyone. Feedback from readers showed that some folks found the 7-day rule more confusing than helpful, so we designed a new calendar that doesn’t require it.
- An attraction’s average posted wait between 10 am and 5 pm now corresponds to its crowd level. The old crowd calendar used the attraction’s highest wait time at any point in the day. Using the average wait time during the busiest hours of the day will tend to smooth out the ups and downs to give a fairer look at crowds at that attraction throughout the day.
- “Best Park” and “Park to Avoid” labels are not needed. It’s easy to see which park to pick, so the labels aren’t needed. The best park to visit on any one day is the park with lowest crowd level number. Avoid the park with the highest crowd level number. Our Park Recommendations page has been updated to help you decide which park to visit using the new calendar.
One happy side effect of these new changes is that the new Crowd Calendar’s predicted crowd levels don’t change as often as the old calendar’s. Thus, if you’re using our popular Crowd Tracker tool to keep an eye on crowds for your vacation dates, you’ll receive far fewer emails.
Finally, we’ve made it easier for you to see how our predictions performed. The main crowd calendar page now shows yesterday’s predicted and observed crowds, in easy-to-read charts and text.
That covers the changes. Check out the new Disney World Crowd Calendar now, or keep reading below for answers to frequently asked Disney World Crowd Calendar questions and more information.
Frequently Asked Questions
Q: What if the crowd levels for my trip have changed?
A: The numbers have changed, but the crowds sizes are probably the same. Since we are matching the crowd levels to the distribution, some of the old ‘1’s will become ‘2’s, ‘3’s or ‘4’s, and some of the old ’10’s will become ‘8’s or ‘9’s. Now comes the strange part: both numbers are predicting the same crowd level, just using a different scale. Think of it like converting from centimeters to inches. Both numbers represent the same length but use a different scale.
If this sounds confusing, you can check the wait times to see exactly what Crowd Calendar 4 is predicting. Doing it this way means the crowd levels relate better to how the crowds feel in the parks.
Q: I don’t get it, I thought the old calendar was based on wait times, too?
A: Both the old and new calendars are based on wait times, but there is a subtle difference in what the 1-10 numbers mean. Let’s look at a comparison.
| Crowd Calendar 2 | Crowd Calendar 4 |
|---|---|
| A rating of crowd levels between 1 and 10 based on attraction wait times | An index of crowd levels between 1 and 10 based on attraction wait times |
| Example: A day at Animal Kingdom has a rating of ‘4’. That means wait times are expected to be higher than 40% of all days | Example: A day at Animal Kingdom has an index of ‘4’. That means the average wait time for Kilimanjaro Safaris is expected to be 20 to 24 minutes |
| Another Example: Magic Kingdom has a rating of ’10’. That means that wait times are expected to be in the highest 10% of all days | Another Example: A day at Magic Kingdom has an index of ’10’. That means that the average wait time at Space Mountain is expected to be more than 92 minutes |
| Park Recommendations are listed on each day of the calendar | No park recommendations are needed. The park that has the lowest crowd level that day is your best park. For more on using Crowd Calendar 4 for park recommendations click here |
| All the possible days are sorted into the 10 index levels from ‘1’ through ’10’. The bottom 10% in ‘1’, the next 10% in ‘2’, an so on | All possible days are sorted into the 10 index levels from ‘1’ through ’10’ depending on the average wait time we predict for that day |
That last row is important. The fact is, most days throughout the year have average crowds. I guess that’s why they call it ‘average.’ Our old calendar forced the days to spread out among the 10 index levels. This new calendar doesn’t do that, so you’ll notice that we have a lot more ‘4’s, ‘5’s and ‘6’s and a lot fewer ‘1’s and ’10’s. We think this is an improvement because it better reflects the distribution of crowds throughout the year. Plus, with our tables of wait times you can easily compare between days yourself. Just check out the wait times for the day of your visit here.
Q: Can I still see the old calendar?
A: Yes, the old Disney World Crowd Calendar is still available, although we won’t be updating it going forward.
Q: What happened to Crowd Calendar 3?
A: We’re always working to improve the Crowd Calendar, even if some of our ideas don’t make the cut. We had developed and tested a Crowd Calendar 3 internally, but Crowd Calendar 4 quickly took its place. Crowd Calendar 3 will have to stay in the vault along with the location of Jimmy Hoffa and the recipe for KFC.
Q: What about the other Crowd Calendars for Disneyland and Universal Orlando?
A: Crowd Calendar 4 for Walt Disney World is a big step. We’re working hard to apply these new ideas to our other calendars. Stay tuned for changes to the Disneyland and Universal Orlando calendars in the coming months.
Q: OK, so how do I use this new calendar to plan my trip?
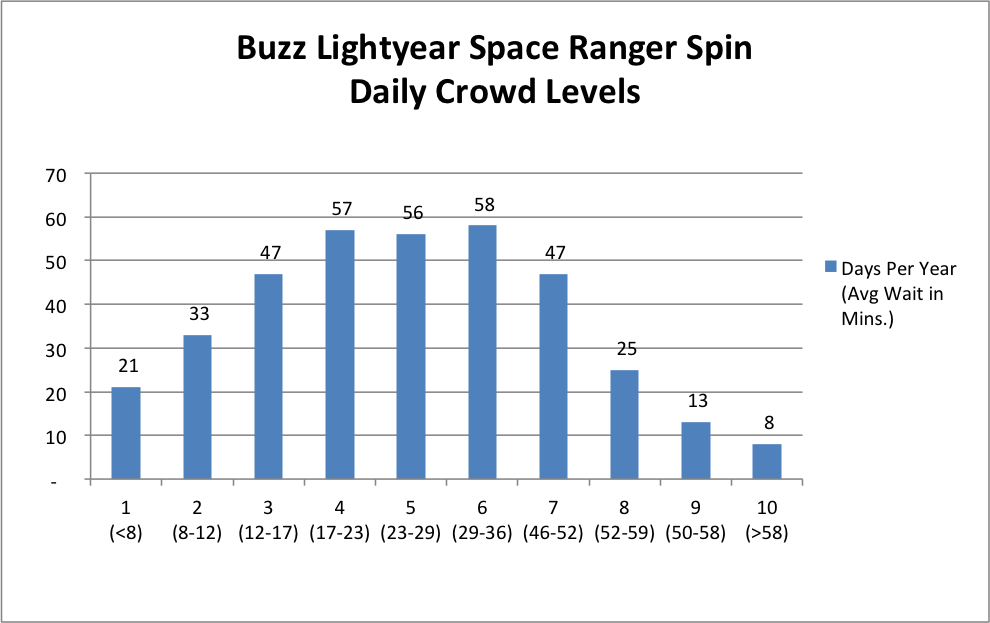
A: That’s the good news: the same way you did before. There’s no reason to use the calendar any differently than you have in the past. High crowd numbers are bad, and low crowd numbers are good. Veteran users of the calendar may notice that crowd levels ‘6’ and ‘7’ are a little busier than before. We suggest you pick a day from the past when you were in the parks and check out the historical crowd levels – these levels have been updated to reflect our new methodology. Check out this example of how Crowd Calendar 4 relates to wait times for Buzz Lightyear in the Magic Kingdom. Notice how more days fall into the crowd levels 3 through 7 as compared to crowd levels 1 and 2, and 8 through 10.
We’ve got wait-time forecasts for every Magic Kingdom attraction, all Epcot attractions, every Disney’s Hollywood Studios attraction, and every Animal Kingdom attraction.
You May Also Like...
-

The April Crowd Calendar update only has minor changes. We are halfway through spring break, and crowd levels have been in-line…
-
We have been holding off on doing any big Crowd Calendar updates until we saw how the crowds were in 2021.…
-
This weekend will have the longest park hours since Walt Disney World re-opened in July. Extended park hours are a signal…
-

The February 2020 Crowd Calendar update is now live. So far 2020 is showing increased crowds at Walt Disney World. We…