Walt Disney World Crowd Report – February 23 to March 1, 2014
Our resort-wide predictions were too low last week although when we missed it tended to be only at one park. We were within one or two index points for 25 of our 28 park level predictions last week and for the other three we missed twice by three index points and once by four. Our resort wide chart below clearly shows however that wait times were higher than expected. When we look at attraction level wait times we see something interesting. The majority of the time when we underpredict it is with an attraction that we would consider secondary, not the headliners. For example, we were virtually bang-on at Peter Pan’s Flight and Space Mountain but missed at Jungle Cruise and Pirates of the Caribbean. This may relate to Fastpass+ integration, something that we have discovered before and continue to spend time examining, watch for more blog articles about that.
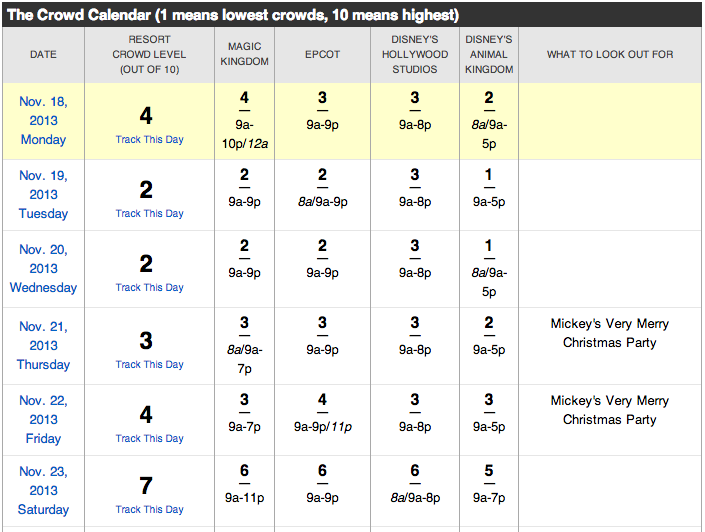
In the meantime, let’s look at how the crowd levels stacked up day-to-day last week.

| February 23, 2014 to March 1, 2014 |
|---|
Sunday’s resort-wide crowd level ‘3’ was the only resort-wide prediction that was spot on for the week. All parks had below average crowds including Magic Kingdom which peaked at a level ‘4’. Epcot and Animal Kingdom were one level lower at ‘3’ while The Studios came in as the lowest crowd level at ‘2’.
Epcot surprised us the most on Monday with a crowd level ‘5’, three levels higher than we predicted. Wait times were not drastically high though. In fact, Test Track’s average posted time was 46 minutes, 5 minutes lower than expected. Soarin’ had an average posted time of 61 minutes, 9 minutes higher than expected. The other three parks were all one or two levels higher than we predicted although none peaked higher than a level ‘5’. In fact, the Studios and Animal Kingdom had low crowds, both a level ‘3’ on our scale.
On Tuesday, it was Magic Kingdom that surprised us. We saw average posted times of 25 minutes at Haunted Mansion (predicted 11), 39 at Jungle Cruise (predicted 12), 24 at Pirates of the Caribbean (predicted 16) and 44 minutes at Big Thunder Mountain Railroad (predicted 30). This may be more evidence that Fastpass+ is causing increased standby times at secondary attractions while lowering standby times at headliners. Space Mountain was only 8 minutes higher than expected and our prediction for Peter Pan’s Flight was spot on. All this translates to a crowd level ‘6’, we predicted ‘2’. Strangely, crowds were low as expected at all three other parks, including a crowd level ‘1’ at The Studios.
Our prediction for a level ‘3’ at Magic Kingdom on Wednesday was accurate and all other predictions were within one level. No park had a crowd level higher than ‘3’ making each park a good choice on Wednesday.
We had predicted a resort-wide level ‘1’ on Thursday and although that turned out to be 2 index levels too low, our predictions for each park were all within one. Magic Kingdom was a ‘4’ (predicted ‘3’), Epcot a ‘3’ (predicted ‘2’), The Studios a ‘2’ (predicted ‘1’) and Animal Kingdom a ‘2’ (predicted ‘1’). A difference of one index level indicates a difference of less than 5 minutes for the average posted time at the attractions, well within our comfort level.
Magic Kingdom surprised us again on Friday but this time we underpredicted by three index levels. We had predicted a level ‘4’ but observed a level ‘7’ thanks to higher than expected wait times at Pirates of the Caribbean (36 minutes, predicted 17) and Jungle Cruise (48 minutes, predicted 17). Once again wait times at Peter Pan’s Flight and Space Mountain matched what was expected although park-wide, wait times were higher on average. Epcot came in at a level ‘4’ (predicted ‘3’), The Studios a ‘3’ (predicted ‘1’) and Animal Kingdom a ‘4’ (predicted ‘3’).
Our prediction of a crowd level ‘6’ at Magic Kingdom on Saturday was bang on although resort-wide our wait time predictions were low. Although all of our park level predictions were within one or two, our resort-wide number missed by three. This is possible due to the way we calculate the index but it is a quirk that may not properly reflect the accuracy of our resort-wide number. Animal Kingdom was the most crowded park at a level ‘7’ while The Studios came in at ‘5’ and Epcot a ‘4’.
| March 2 to 8, 2014 |
|---|
Crowds next week will start to climb to above average levels thanks to the start of spring break for some school districts. In fact, crowds over the next several weeks will ebb and flow in parallel with the percentage of schools that are in session. Touring plans are essential this time of year as crowds tend to be more unpredictable.
To see Walt Disney World Crowd predictions for the days of your vacation, check the Crowd Calendar.![]()
To get details about our predictions of future crowds or details about crowds in the past check out the Crowd Calendar and select “Jump to Date” on the left margin.
You May Also Like...
-

This weekend will have the longest park hours since Walt Disney World re-opened in July. Extended park hours are a signal…
-

The February 2020 Crowd Calendar update is now live. So far 2020 is showing increased crowds at Walt Disney World. We…
-
The October Crowd Calendar update is now live. We skipped September to give the models a chance to digest the data with Star…
-
Today the Disney World Crowd Calendar gets an update. This is the result of a complete review of the predictions for…
I am interested to see this weeks actual numbers. We were there from March 1-5 and it was insanely busy.
Sunday was the least crowded day. We did HS and most of MK with no issues. Until 11pm, when the EMH hit MK and things turned into a giant bottle neck. Monday had a 40+ minute line for Maelstrom and the typical 80 minutes for Soarin and Test Track. Tuesday, we waited over 20 minutes in the fastpass+ line (walk up was listed at 40) for HM and Big Thunder was listed at 115 minutes and there was a wait of 60 minutes for Little Mermaid. The worst day was our final day. Hollywood Studios was a nightmare from the start. It took so long to get in that we missed our 9-10am fastpass+ at Star Tours. ToT and Rockin Roller Coaster were at 60 minutes by 10am. We did our other 2 fast passes and ate breakfast before heading out to catch our flight. I have never been so happy to leave a Disney park in my life.
Even with all the crowds and spending less time in the parks, it was still worth the trip. We did things we don’t normally do. We also ate tons of food and snacks that we don’t normally eat. Still beats the snow.
I’m still here at the parks, and Saturday felt worse than predicted especially haunted mansion which used that little house near the entrance for crowd control. Pirates too was rediculous and we were rather disappointed we couldn’t go on after having my son become a pirate in the pirate league. I do give touring plans credit, today and yesterday they were correct about Marti Gras not with people celebrating (which I thought was the reason for the high rating) but rather the state of Louisiana evactuating to Disney from the crazy partying back home.
I was there last weekend for Princess Half Marathon. Was at MK on Sunday after the race and I thought the park was crazy busy! We waited 50 minutes for both Pirates and Buzz, and the line for Dole Whips was wrapped all the way around, on both ordering sides!! It was way busier than I expected. I though I read somewhere that while you factor events like Princess Half Marathon and other RunDisney events, Food and Wine, and Flower and Garden festival into the resort level, you don’t factor that into park levels for ride wait times. Maybe that needs to chance.
Just wanted to comment about the crowds last week. We were at Disney Feb 22 – Feb 28 and saw the larger than predicted crowds. Just curious if Touring Plans has an explanation? We enjoyed our trip but definitely the most hectic of our three trips to Disney. I looked at historical crowd levels and there wasn’t a difference. I believe this feeling comes from FastPass+ and the need to plan out the entire day on the spot as we entered the park. (We do not stay on property) I love Disney but it can be a lot of work and stress for a vacation!