
2025 Universal Orlando Crowd Calendar Retrospective
Welcome to the third week of 2025, when we’re finally getting around to reviewing how our crowd calendar predictions performed for the Universal Orlando parks. Because we need to be fair to Universal! We already reviewed Walt Disney World predictions extensively. And Universal is just as important, or so some of my good friends tell me. So let’s put on our Sorting Hats, eat mac and cheese in a cone, drink a ridiculously-adorned chocolate milkshake and crunch those Universal numbers.
Explain the Math!
If you take a peek at the Universal Orlando crowd calendar, you’ll notice that each park-day is given a predicted crowd level on a scale from 1 to 10. Crowd level 1 days are the least crowded of the year, and crowd level 10 days are wall-to-wall humans everywhere you look. These are the predicted crowd levels.
Then, after a park day happens, we can measure all of the wait times at every attraction in every park and determine what the actual crowd level was for that day. By subtracting the difference between the actual and the predicted crowd level, we can get an easy measure of how accurate our predictions were.
In this case, I’ll subtract the predicted crowd level from the actual crowd level. For example, if we predict a crowd level 10 at Islands of Adventure, but the day ends up being a crowd level 8, the difference is -2. We overpredicted the crowds by 2. But if we predict a crowd level 4 at Universal Studios Florida and the day ends up being a crowd level 7, the difference is 3. We underpredicted the crowds by 3.
In general, you’re not going to feel any difference in your park day if predictions are off by just one crowd level. Within 1 crowd level is the goal. Really anything within 2 crowd levels I’ll call “fine”. Missing by 3 or more crowd levels is a big miss, and that’s the type of thing it’s best to avoid.
2025 Performance Compared to Previous Years
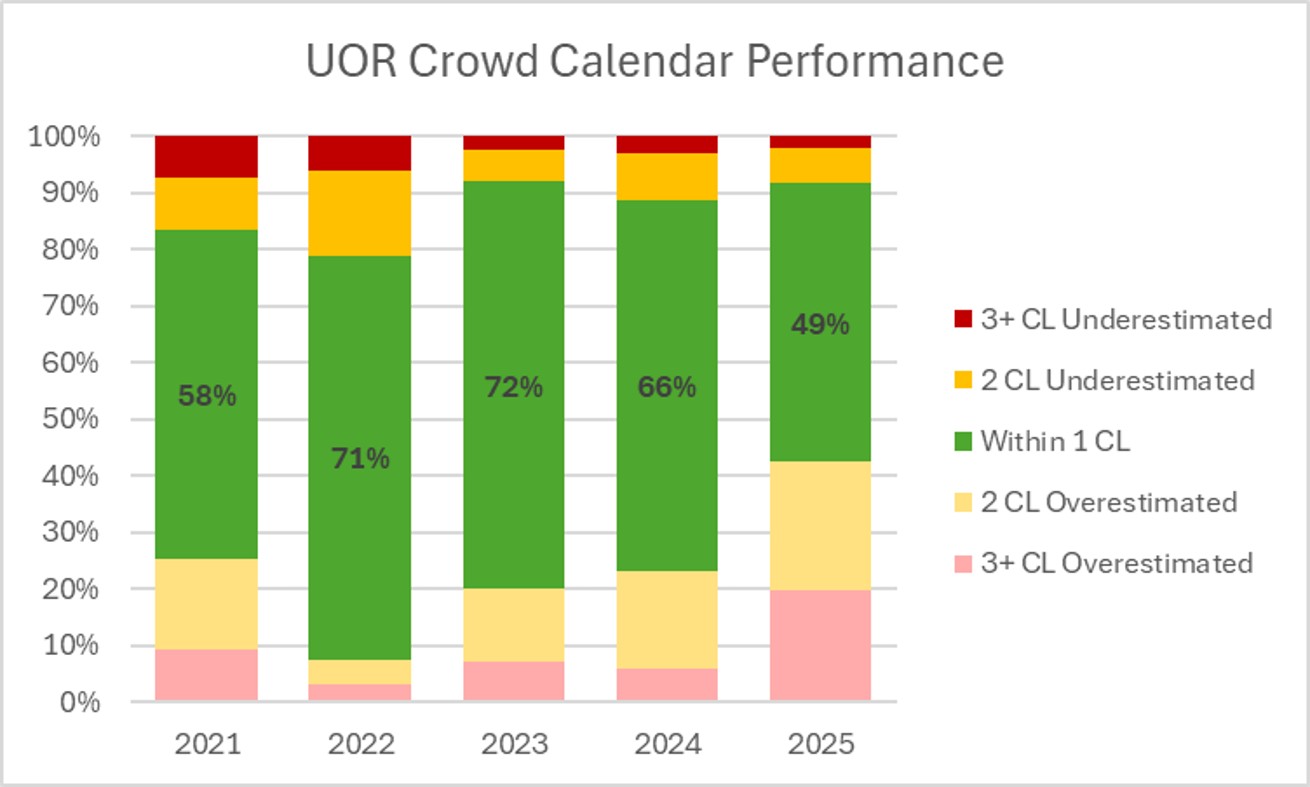
In a perfect world, that green bar would be 100% every year. Touring Plans would have ideal predictions that perfectly matched reality, everyone would use them reliably, and we’d all be best friends forever. The problem is … this isn’t a perfect world. Humans are unpredictable. And humans make the operational decisions for Universal Orlando, and humans are the ones that decide whether to visit Universal Orlando or not. Plus, Touring Plans tries to not change the predicted crowd levels constantly so that people planning have some stability. So there’s a lot working against perfect predictions. Even still, we all want that green bar in the graph to be as big as possible. And we especially want the red and pink bars (missed by 3 or more crowd levels) to be as small as possible.
What about the other bars? Well, in general, people are pleasantly surprised if the parks are less crowded than they expect (aka, Touring Plans overpredicted). And they’re unpleasantly surprised if the parks are more crowded than they expect (aka, Touring Plans underpredicted). But Touring Plans is full of math nerds, and nerds want distributions to be centered (aka, just as many underpredictions as overpredictions). Still, during a retrospective, I’m going to recognize and acknowledge that all of our lovely customers are going to be less full of rage if the stats folks can keep those underpredictions to a minimum.
2025 doesn’t look particularly great when we look at the size of that green bar in the middle. The good news is that the green bar is slightly larger for Universal than it was for Walt Disney World. Predictions were within one crowd level 49% of the time. That’s that was the worst performance of any of the past 5 years. And things got more skewed too. Again, not as skewed as Walt Disney World, but still very off-center. Bonus – they’re skewed in the “good” way. This year there were almost three times as many overestimates as there were underestimates.
2025 Performance Compared Across Parks
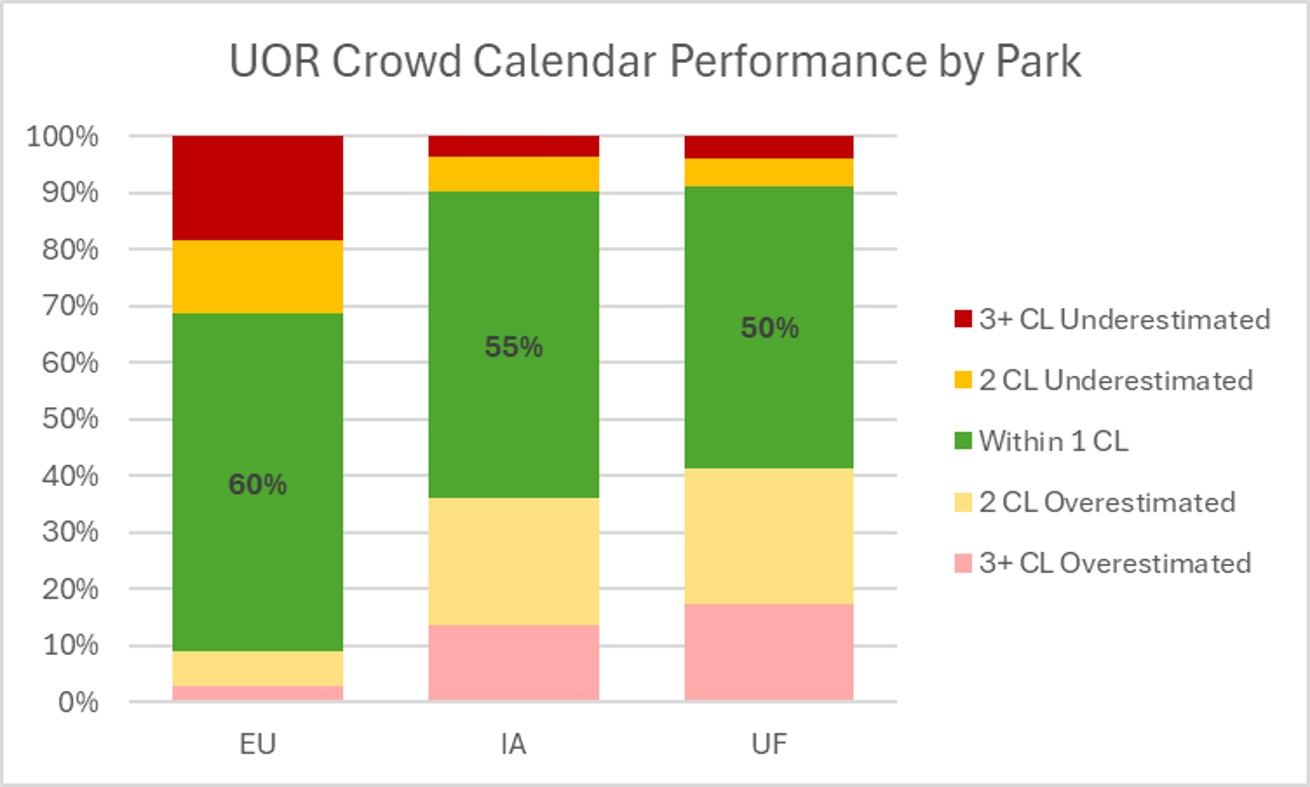
In order to understand what went right (or wrong) in 2025, we need a little more information. Otherwise you might assume something like “well, Epic Universe just opened so that was probably hard to predict and skewed everything.” And you’d be wrong! Let’s go down one level and look at how predictions performed at each park rather than the resort as a whole. This is easier at Universal, compared to Disney, since there are three parks instead of four (I’m excluding water parks from the conversation).
Like last year, no single park is responsible for most of the misses. Instead, both existing parks had pretty similar performance. And Epic performed better than either of those! All green bars are within 10% of each other, which isn’t incredibly different. But, Epic Universe was skewed toward underestimates while the other two parks were both skewed toward overestimates. At Epic, there were three times as many underestimates as overestimates. But at Islands of Adventure and Universal Studios Florida, that flipped.
Calendar Retrospective of Crowd Calendars
What better way to review calendars than with more calendars?! I know I love making and coloring calendars in Excel. So so much. One of the biggest joys of my life. So that probably means you love the results. We’ll go with that.
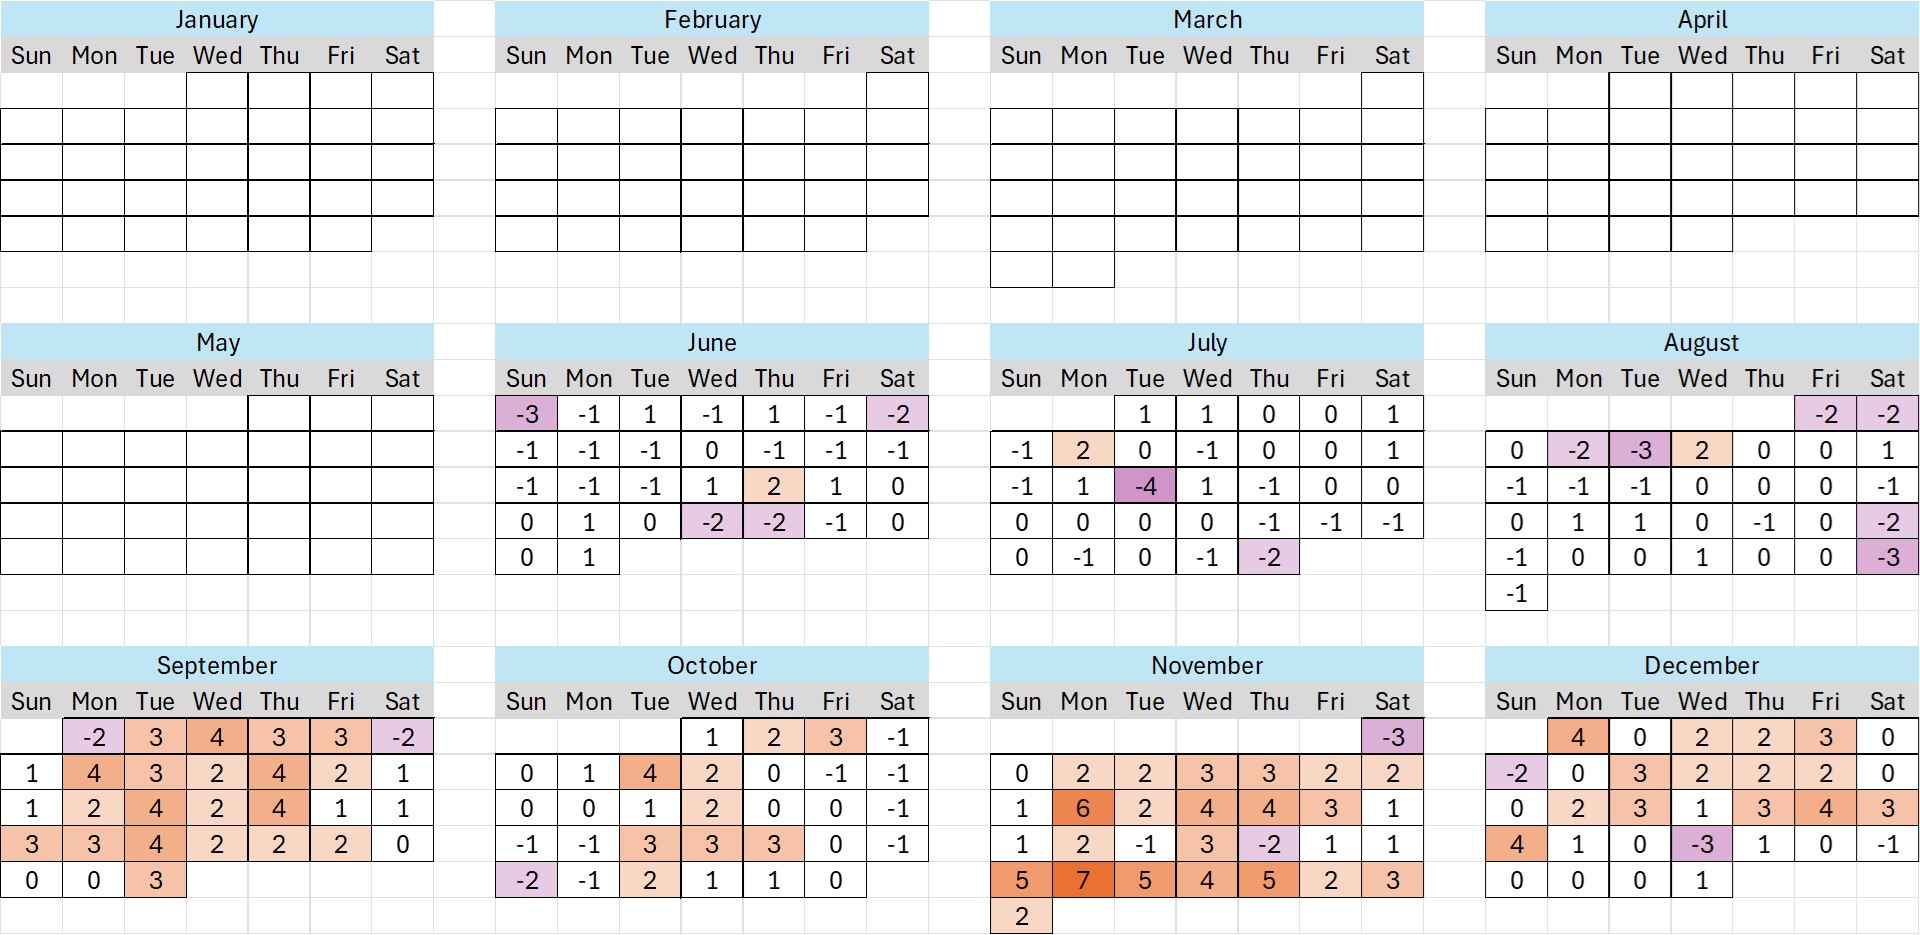
I’ll start here with Universal Studios Florida, where predictions had the lowest accuracy, provide my commentary, and then move to Islands of Adventure and Epic Universe. We can discuss park-specific issues, as well as trends that I notice affecting all parks
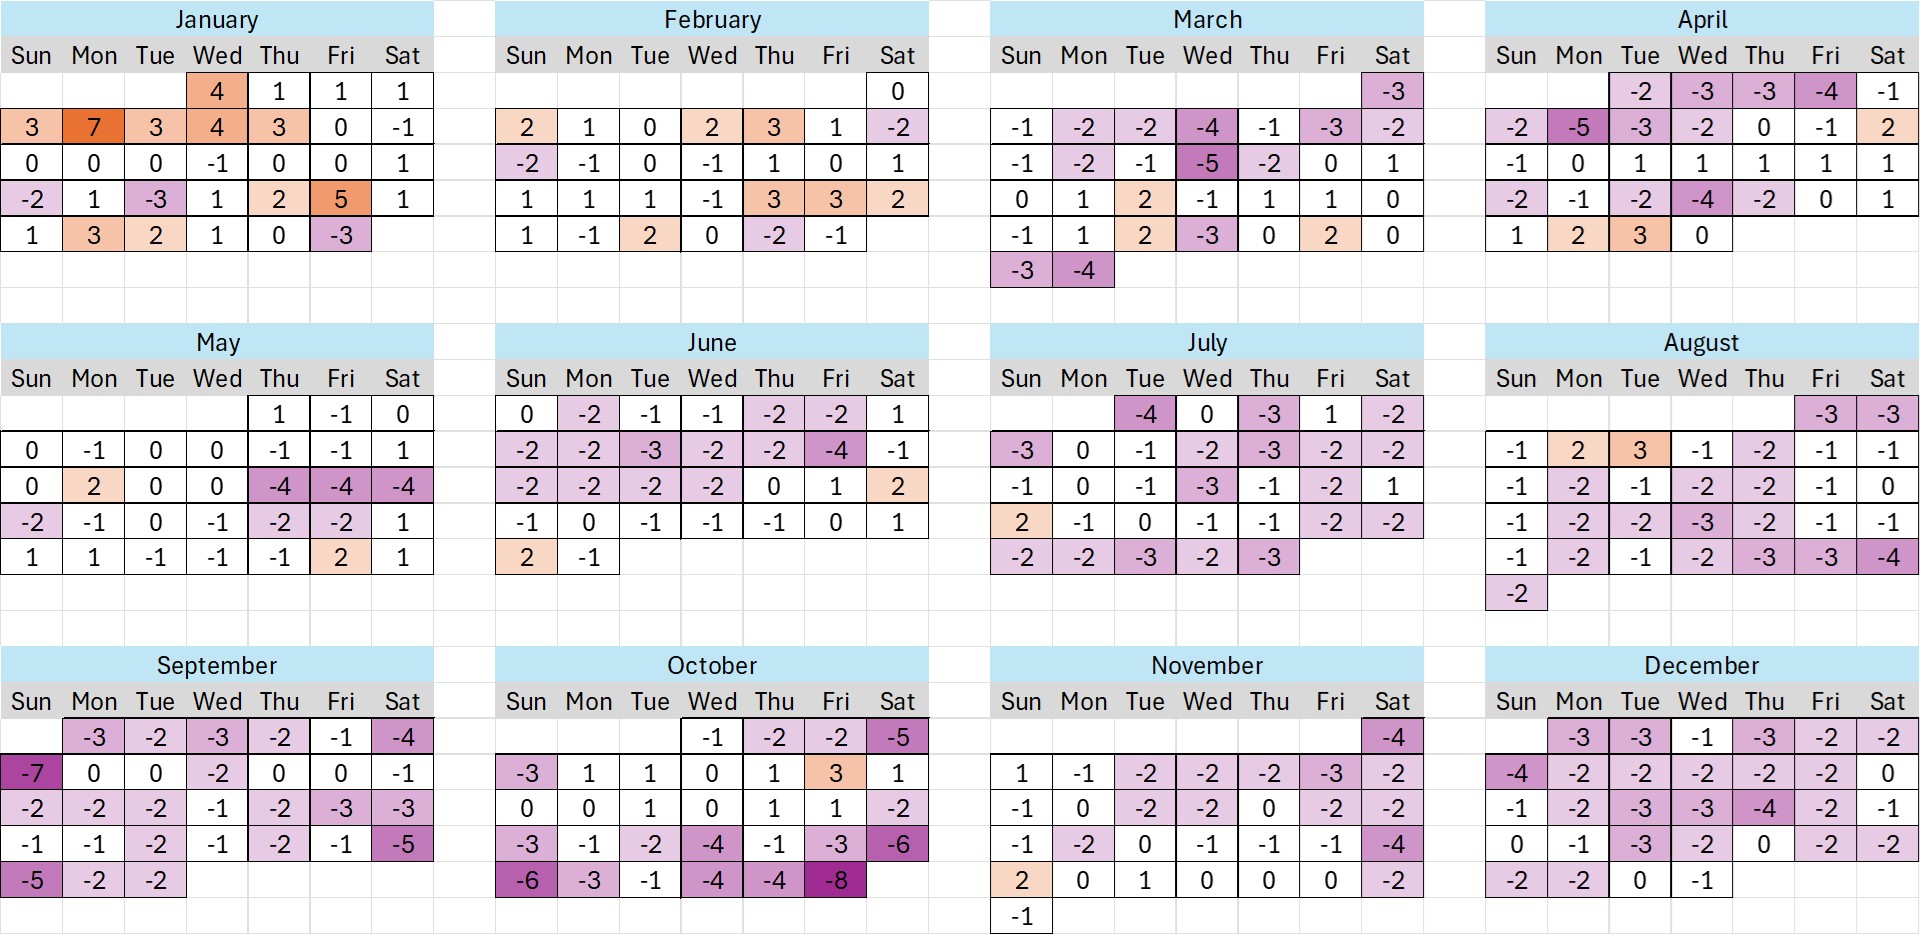
This calendar looks eerily similar to the ones we saw for Walt Disney World last week. So crowds showing up or not showing up are more likely Orlando-wide (or even nation-wide) trends based on economics and international travel more than company-specific issues.
The beginning of the year, and especially the second week, was more crowded that expected. But then things didn’t continue to outpace expectations during Spring Break season and April.
June through the end of the year was lower than estimated. September and October were especially bad, and a crowd calendar update in early November attempted to account for that. But the end of the year was still pretty uncrowded even compared to updated predictions.
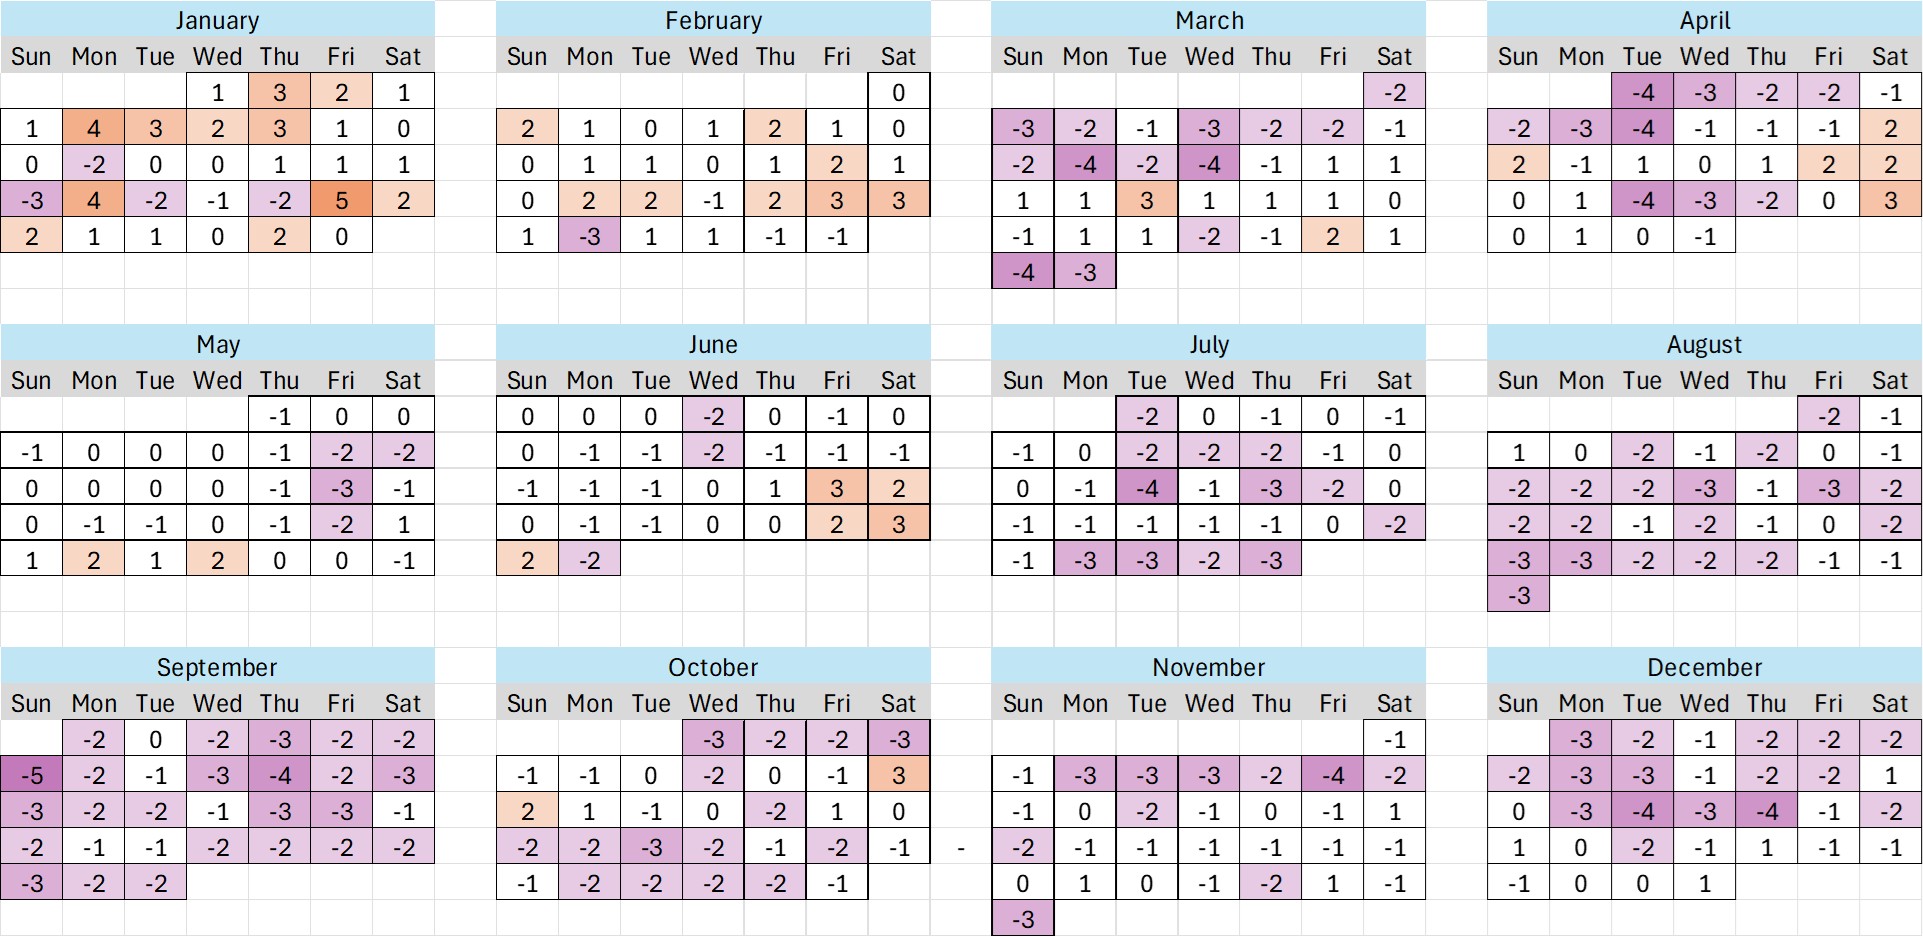
Last year, behavior at Islands of Adventure was pretty remarkably different than at Universal Studios Florida. This year, the overall trends are the same, but the severity is slightly less. January and February were still more crowded than expected, but March and April emptied out (other than April weekends).
May and June were fine, but then we see the seemingly inevitable slide back toward lower-than-expected crowds from June through the end of the year. In this case, that early November crowd calendar update actually did pretty well for the remainder of November, but then crowds still bottomed out in December.
Epic Universe is brand new, which means that we don’t have prior years to compare to. And clearly we have no results from before official park opening in June. You might assume from this graphic that Epic Universe was much more popular than Touring Plans predicted. To the contrary. Overall park capacity is still somewhat more restricted than you might guess. It’s all operational issues that are forcing wait times up at Epic. Rides are regularly opening late or breaking down, and even when they are running, it’s rarely at full capacity.
Epic Universe is a park of great potential, but for now, wait times are incredibly high, which is showing up as higher-than-expected crowd levels. Again, this is not because more people are showing up. In fact, capacity is artificially constrained. It’s just wait times that are higher than they should be.
Did any of the results of this retrospective surprise you? Were you at Universal Orlando for any of the significant overpredictions or underpredictions? Let me know in the comments!
You May Also Like...
-

Universal Orlando Crowd Calendar Update: What You Need to Know The Universal Orlando Crowd Calendar has been updated through the end…
-

Welcome to the fourth week of 2025, when we’re finally getting around to reviewing how our crowd calendar predictions performed for…