
Disney Data Dump July 29 2026
Well, well, well. It looks like late July may have finally found a tiny summer crowd bump. But don’t freak out – really all that means is average crowd levels for the week closer to 3 instead of 2.
For the third week in a row, Monday was the busiest day of the week, once again reaching a crowd level 4. That is still below average for Walt Disney World overall, but it is practically bustling compared to the crowd level 2s that have dominated most of the summer. We also got a rare Diet EPCOT crowd level 4, a much more balanced week of crowd calendar results, and – perhaps most shockingly – Test Track finally surrendered its seven-week reign as the attraction with the most downtime. So let’s dig into whether this is the beginning of a real late-summer trend, or just one last burst of families squeezing in a trip before back-to-school season takes over.
Observed Crowd Levels July 21 – 27
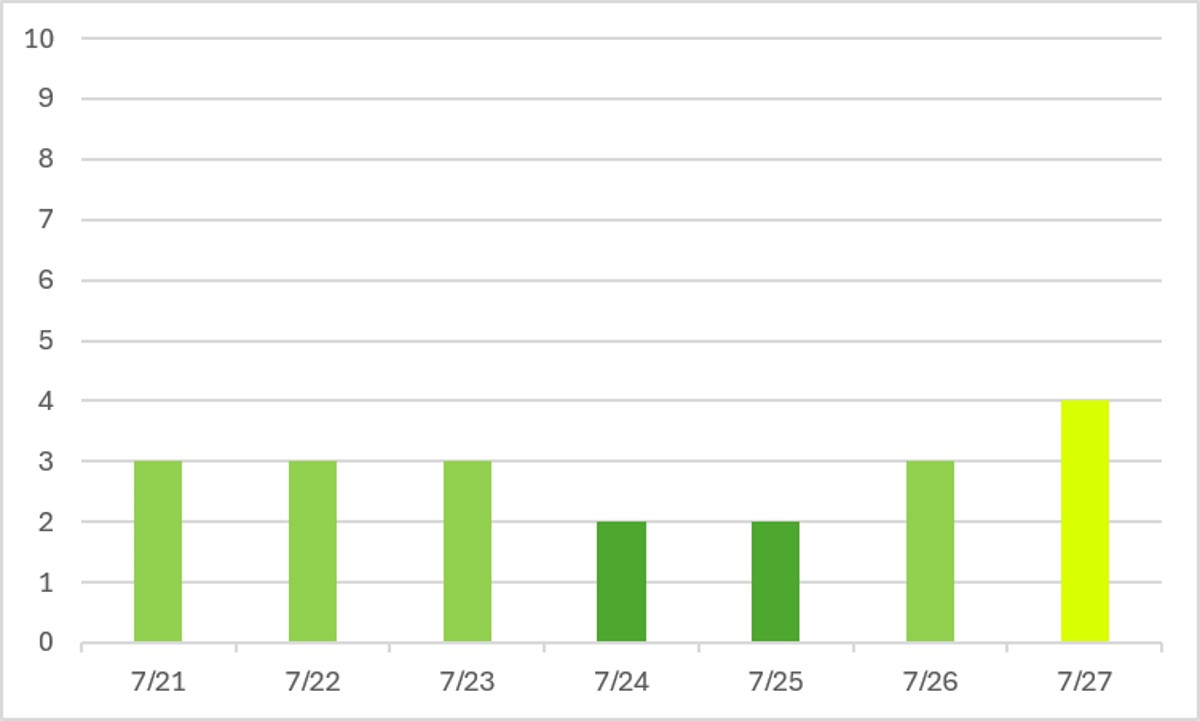
We have a trend! For the third week in a row, Monday is the most crowded day of the week, once again popping up to a whole crowd level FOUR. Clearly, this does not mean the parks are crowded on Mondays. A 4 is still below average for the year. But it is significantly above average for this summer, when we’ve had crowd levels closer to 2 on most days. And, generally speaking, this is one of the “most crowded” weeks we’ve seen since early June. Since weather wasn’t a big deal this week, this points to more families taking last-minute late July vacations before hitting the back to school circuit in August.
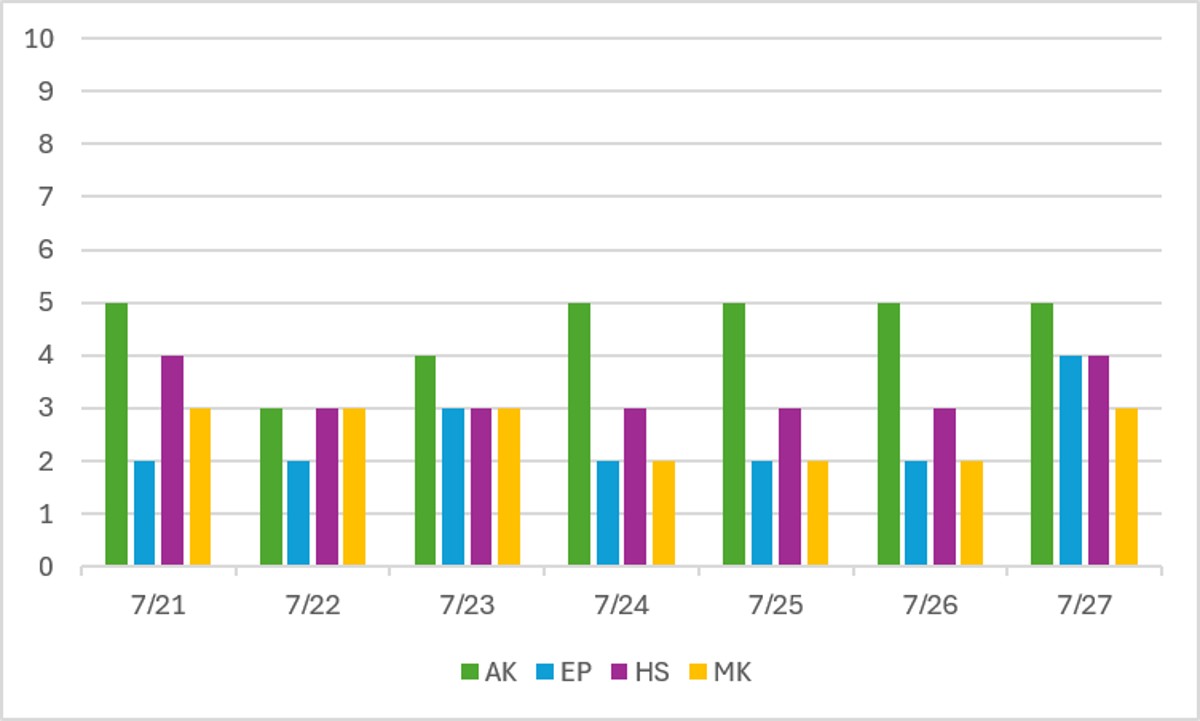
No big surprises on the park-by-park view, other than maybe EPCOT jumping up to a crowd level 4 on the 27th. That’s really rare for diet EPCOT, and wasn’t caused by any major downtime issues. Otherwise, we’ve still got Animal Kingdom leading the pack, and Magic Kingdom generally staying the least crowded of any park.
Performance of Crowd Level Predictions
Each week, I give you a very transparent look into how the TouringPlans crowd level predictions performed. Each day at each park is one data point, so each week we have 28 different crowd level predictions to evaluate. Any time a prediction is within one or two crowd levels, things won’t really “feel” much different than what was predicted. Being off by 3 or more crowd levels is where you might feel that difference in wait times throughout the day.
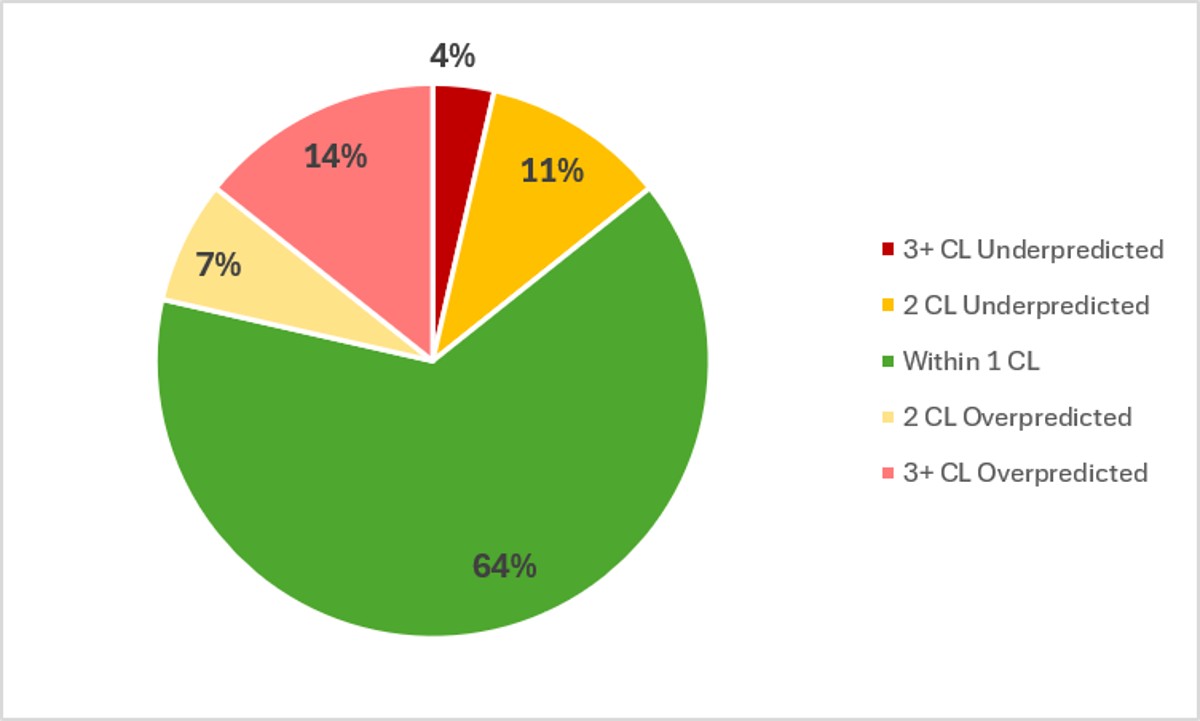
In the past week, Touring Plans predictions were either spot-on or within 1 crowd level 64% of the time, which is pretty in line with what we’ve seen for most of the summer. And 82% of the time Touring Plans predictions were within 2 crowd levels, so that’s a B- on predictions for the last week! But there’s good news in the midst of those mediocre results! This is one of the most “balanced” prediction results we’ve seen all summer, instead of being totally skewed toward overpredictions. Len made some MORE updates to the crowd calendar this week to account for ever-dropping crowd levels, and it looks like they made a good impact. In general, we’d like there to be just as many overpredictions as underpredictions because that means there’s just slight variance around what we predict. We don’t want to be skewed one way or another. This week, we did have one underprediction by 3 crowd levels – at EPCOT on the 27th, when the predicted crowd level was a 1, but it somehow hit crowd level 4. And there were four overpredictions by 3 crowd levels, all at Magic Kingdom.
Attraction Downtime July 21 – 27
If we average all of the capacity lost due to unexpected downtime over the past week, it comes out to 5.6% of attractions unexpectedly being down. This is close to being in-line with our “normal” WDW summer average. Over the past week, EPCOT was the park with the worst overall downtime, averaging 6.3% of its capacity lost to downtime. All parks fell somewhere between 4.8% downtime (Hollywood Studios) and 6.3%.
The worst day for attraction downtime in the past week was on July 26th. On that day, 8% of all capacity at WDW was lost due to unexpected downtime. And the worst park-day of the past week was also on the 26th, over at Animal Kingdom, when 14% of that park’s capacity was lost due to unexpected downtime. Animal Kingdom was open for 11 hours on the 26th, so 14% downtime is the equivalent of the entire park shutting down for more than 92 minutes. That’s like all of Animal Kingdom unexpectedly opening at 9:32 am instead of 8 am.
Attraction Downtime Worst Offender
Big news. For the first time in eight weeks, we have a new worst offender! In the past week, Expedition Everest had the worst overall downtime of any WDW attraction. It was unexpectedly down for 17% of the past week. The worst day of the past week at Everest was on July 26th, when the attraction was down for 44% of the day.
Test Track, our worst offender for each of the 7 past weeks, only had 11% downtime in the past week. Six other attractions had more downtime! Kudos to Test Track for finally having a decent week.

Rope Drop Downtime
Here are problematic offenders from the past week, with the percentage of downtime during the first hour of the day in parentheses:
- Magic Kingdom: Seven Dwarfs Mine Train (30%), Big Thunder Mountain (30%), Tiana’s Bayou Adventure (28%), Pirates of the Caribbean (16%), Jungle Cruise (15%), Under the Sea (12%), Buzz Lightyear’s Space Ranger Spin (11%), Haunted Mansion (10%)
- EPCOT: Test Track (14%)
- Hollywood Studios: Rise of the Resistance (30%), Runaway Railway (22%), Slinky Dog Dash (17%)
- Animal Kingdom: Expedition Everest (14%)
After record-short rope drop downtime lists last week, we added a bunch of attractions back onto the list this week. The one bit of good news is over at EPCOT, where only Test Track had over 10% downtime in its first hour of the day! It’s been very rare this summer for headliners at EPCOT to not have rope drop downtime issues.
Unfortunately, Magic Kingdom’s list ballooned back up with significant issues at Seven Dwarfs and Big Thunder. In fact, most of the “left side” attractions had significant rope drop downtime issues this week, which is bad news for non-early-entry rope droppers.
Wait Times July 21 – 27
Attractions with the Highest Average Posted Wait at Each Park
- EPCOT: Cosmic Rewind, average posted wait of 75 minutes (was 72 minutes at Test Track last week)
- Magic Kingdom: TRON, average posted wait time of 70 minutes (was 68 minutes last week)
- Hollywood Studios: Slinky Dog Dash, average posted wait of 69 minutes (was 71 minutes last week)
- Animal Kingdom: Flight of Passage, average posted wait time of 65 minutes (was 54 minutes last week)
An interesting mix of results with our headliners this week. Thanks to its relatively high reliability, Test Track didn’t have the highest posted wait at EPCOT! Instead, Cosmic Rewind took over that spot (barely). Test Track stayed even compared to last week, at 72 minutes. Tron and Flight of Passage, on the other hand, saw increases to their overall average posted wait, while Slinky saw a decrease.
Parks with the Highest and Lowest Average Wait
- Highest: Hollywood Studios, average park-wide posted wait of 36 minutes (was 34 minutes last week)
- Lowest: Magic Kingdom, average park-wide posted wait of 22 minutes (was 22 minutes last week)
No really huge changes in park-wide waits this week, although Hollywood Studios and EPCOT both saw 2-minute increases to their park-wide average. Otherwise, no surprising major shifts.
Most Inflated Posted Wait Times
We all know that Disney inflates their posted wait times on purpose. They have many reasons for doing this. Some are totally understandable, and some are potentially more problematic. We can figure out how much posted wait times are being inflated by comparing submitted actual wait times from the Lines App and the posted wait time when the person timing their wait entered the line.
Over the past week, actual wait times in the Lines App averaged 76% of what was posted. That’s slightly above our historical average in the era of Lightning Lanes, which means that posted wait times were less inflated than normal. Overall, if the posted wait time at a popular attraction was 60 minutes, you could’ve expected to wait just over 45 minutes instead.
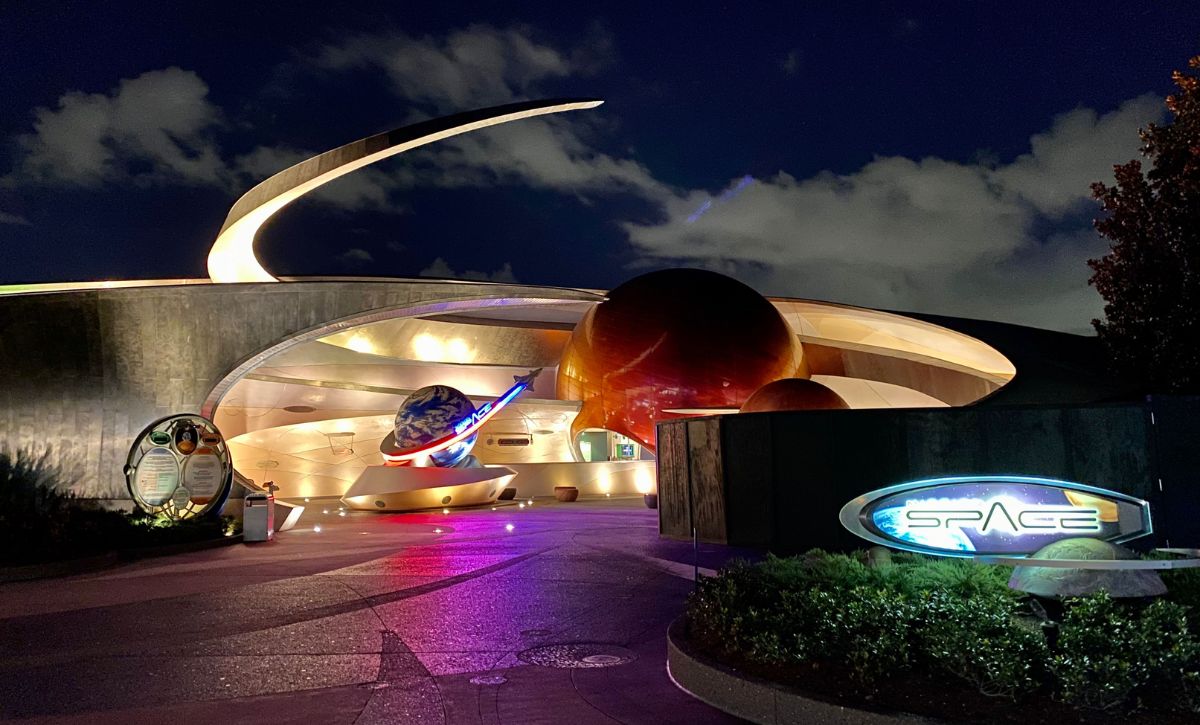
But the worst inflation offender for the past week was Mission: Space. At this one attraction, submitted actual wait times were only 33% of posted wait times in the past week. That means that if Mission: Space had a 20 minute posted wait, you probably would have actually only waited 6.5 minutes instead. A third of what was posted! Remember to always check the Lines app for predicted actual waits instead of making decisions based on what is posted.
This Week’s Wait Time Rock Star
Between July 21st and 27th, we had just under 900 timed actual waits submitted through the Lines app. The one person who recorded the most actual waits during that time was RyMika211, with 37 overall timed waits – 8 Lightning Lane waits and 29 standby waits. Thanks for all of that timing, RyMika211! It unfortunately does not compete with the the 97 timed waits in a single week from our current timing champion, preef.
Looking Ahead: July 28 – August 3
I write this article on Tuesday evenings so that you all have the very freshest of data on Wednesdays. That means the 28th will already be in the past by the time you’ve read this, so you’ve made it to the future!
Just like the rest of the summer, no big surprises should be headed our way in the next week. Normal park hours, no special events, etc. That means that unless we have huge downtime problems, crowd levels should stay in that overall 2-3 range. Except maybe on Mondays when it might hit a 4! If anything, this coming week could skew more to the 3-4 range as families take vacation before going into back to school mode.
‘Tis the season of afternoon thunderstorms. Every day on the 10-day forecast has at least some chances of storms, and highs in the upper 80s or lower 90s. That means plenty of humidity hanging around. Be prepared for temperatures that feel especially hot, and afternoon storms to temporarily make things feel a little cooler. Do your outdoor attractions in the morning, or save them for late in the evening.
Were you in the parks this past week? Or are you headed to Orlando soon? Let me know in the comments below!
You May Also Like...
-

The big news this week is that after weeks and weeks of crowd level 2s, we finally got a 4. A…
-

Crowd levels stayed right where we've been expecting them to stay this week - remarkably low. But underneath those calm overall…
