

Disney Data Dump July 22 2026
The big news this week is that after weeks and weeks of crowd level 2s, we finally got a 4. A FOUR! In July! But before anyone starts declaring that summer crowds are back, the data underneath that number is much messier. One park keeps having wild swings, Magic Kingdom had a rough Monday, and downtime pushed waits around without fundamentally changing the overall summer story. So this week, we’re digging into the mysterious return of a crowd level 4, Test Track’s seventh consecutive week of winning an award nobody wants, and why even a “busier” summer week was still pretty manageable overall.
Observed Crowd Levels July 14 – 20
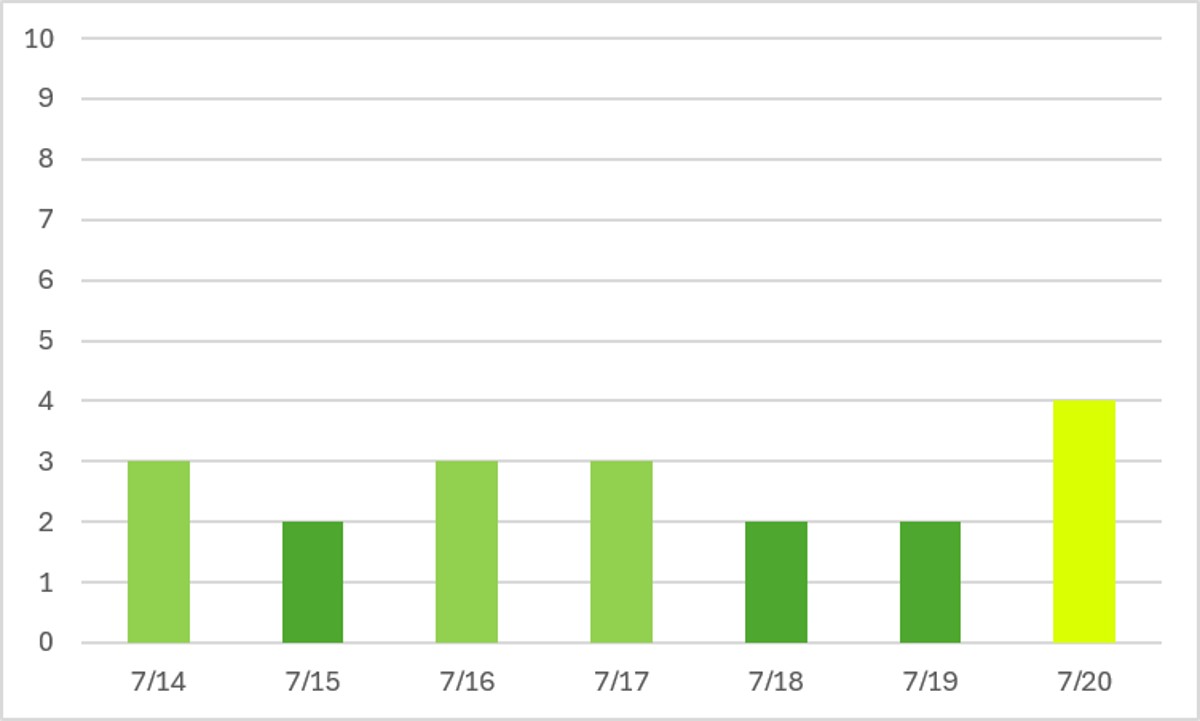
Whoa. Whoa. A crowd level FOUR?! In summer?! This is actually pretty crazy, and we’ll dig into why it happened a little later. We haven’t seen a crowd level four in weeks and weeks, and there isn’t a real reason that end of July should attraction a bunch of crowds (or y’know, a moderately low amount of crowds) other than maybe some families trying to take a last vacation before August school-related events.
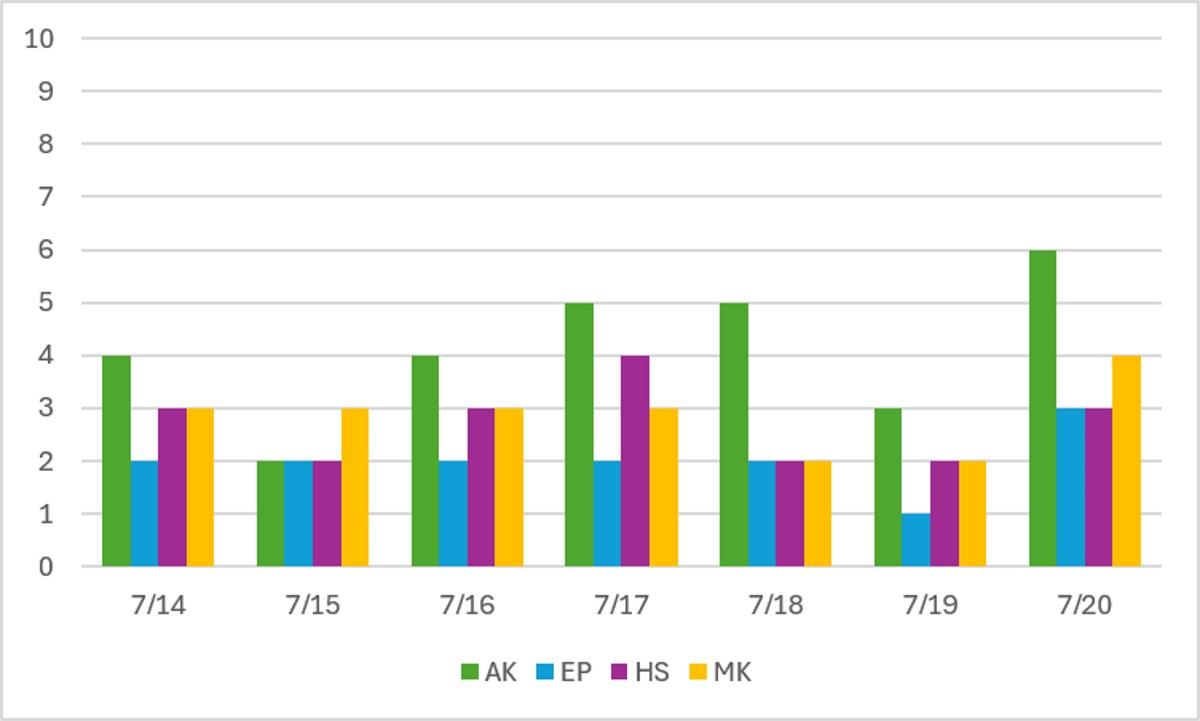
Once again, we’ve got wild swings at Animal Kingdom. Mondays at Animal Kingdom having really high crowds (compared to everywhere else) is becoming a trend. It’s still almost always achieving the highest crowd level of any park on any given day. That’s all thanks to that low number of attractions and its inability to absorb many extra humans without wait times spiking.
But Magic Kingdom has been a little higher than its summer normal this week, especially on Monday the 20th. And even Diet EPCOT hit a very rare crowd level 3 on the 20th!
Performance of Crowd Level Predictions
Each week, I give you a very transparent look into how the TouringPlans crowd level predictions performed. Each day at each park is one data point, so each week we have 28 different crowd level predictions to evaluate. Any time a prediction is within one or two crowd levels, things won’t really “feel” much different than what was predicted. Being off by 3 or more crowd levels is where you might feel that difference in wait times throughout the day.
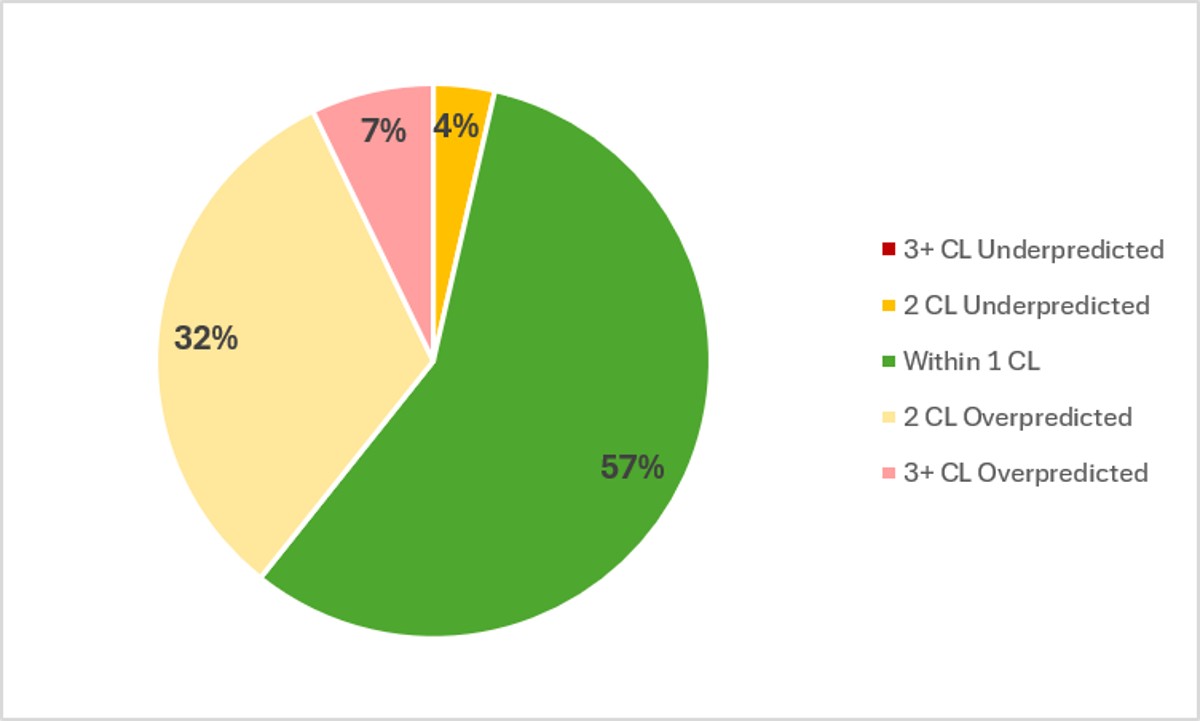
In the past week, Touring Plans predictions were either spot-on or within 1 crowd level 57% of the time, which is pretty in line with what we’ve seen for most of the summer. And 93% of the time Touring Plans predictions were within 2 crowd levels, so that’s an A on predictions for the last week! In general, as we get further into the summer, crowd levels still aren’t keeping pace with predictions that were already low, and were even adjusted lower once this summer. There was one underprediction by 2 crowd levels at Animal Kingdom on the 20th. But as discussed above, that’s mostly thanks to those random spikes that are nearly impossible to predict. But there were also two underpredictions by three crowd levels in the past week, one at EPCOT and one at Magic Kingdom.
Attraction Downtime July 14 – 20
If we average all of the capacity lost due to unexpected downtime over the past week, it comes out to 5.4% of attractions unexpectedly being down. This is close to being in-line with our “normal” WDW summer average. Over the past week, Magic Kingdom was the park with the worst overall downtime, averaging 5.9% of its capacity lost to downtime. All parks fell somewhere between 4.5% downtime (EPCOT) and 5.9%.
The worst day for attraction downtime in the past week was on July 20th. On that day, 8% of all capacity at WDW was lost due to unexpected downtime. And the worst park-day of the past week was a combination of our worst park and worst day – at Magic Kingdom on the 20th, when 10% of that park’s capacity was lost due to unexpected downtime. Thankfully this is WAY down from two 20%+ days down at Animal Kingdom last week. But 10% downtime is still a big deal, especially at Disney’s most attraction-rich park. Magic Kingdom was open for 14 hours on the 20th, so 10% downtime is the equivalent of the entire park shutting down for 84 minutes. That’s like all of Magic Kingdom opening almost an hour and a half late.
Attraction Downtime Worst Offender
In the past week, our perennial winner Test Track had the worst overall downtime again. That’s the SEVENTH week in a row for Test Track. It was unexpectedly down for 19% of the past week. Over the past two weeks, it had 33% and 30% downtime, so at least we’re trending in the right direction.
The worst day of the past week at Test Track was on July 19th, when the attraction was down for 29% of the day. It was also down on the 20th for 28% of the day, and on the 13th for 27% of the day. But after multiple weeks of three or more 30%+ down days, this is admittedly a big improvement.
For the past two weeks, we’ve had at least three attractions with 20% or more downtime for the week. This week, no attractions broke that mark. Huzzah! Mostly what this means is that there have been less storms, not that Disney is suddenly getting more reliable.
Rope Drop Downtime
Here are problematic offenders from the past week, with the percentage of downtime during the first hour of the day in parentheses:
- Magic Kingdom: Seven Dwarfs Mine Train (42%), Tiana’s Bayou Adventure (23%), TTA PeopleMover (22%), Pirates of the Caribbean (16%)
- EPCOT: Frozen Ever After (29%), Spaceship Earth (17%), Journey Into Imagination (12%), Living with the Land (10%)
- Hollywood Studios: Rise of the Resistance (27%), Slinky Dog Dash (19%)
- Animal Kingdom: No rope drop downtime issues!
The good news is that this is a much shorter list than we’ve seen for most of the summer (and most of the year)! Animal Kingdom even finally got back to its gold star status with no rope drop downtime issues. Hooray!
The bad news is that the attractions on this list include some pretty big headliners, like Seven Dwarfs Mine Train, Rise of the Resistance, Slinky Dog Dash, and Frozen Ever After. It’s always important to have a backup plan if you’re headed to a headliner first thing in the morning.
Wait Times July 14 – 20
Attractions with the Highest Average Posted Wait at Each Park
- EPCOT: Test Track, average posted wait of 72 minutes (was 74 minutes last week)
- Hollywood Studios: Slinky Dog Dash, average posted wait of 71 minutes (was 70 minutes last week)
- Magic Kingdom: TRON, average posted wait time of 68 minutes (was 62 minutes last week)
- Animal Kingdom: Flight of Passage, average posted wait time of 54 minutes (was 55 minutes last week)
It was a pretty even week at the headliners compared to last week. Test Track saw slightly lower wait times thanks to being slightly more reliable this week. But TRON had a significant increase in wait times as Magic Kingdom as a whole saw higher demand and crowd levels.
Parks with the Highest and Lowest Average Wait
- Highest: Hollywood Studios, average park-wide posted wait of 34 minutes (was 33 minutes last week)
- Lowest: Magic Kingdom, average park-wide posted wait of 22 minutes (was 20 minutes last week)
No major changes to park-wide waits either. We did see average waits at Magic Kingdom go up by about 10% compared to last week, and 15% compared to the week before that, so downtime issues there are pushing wait times up. But all other parks stayed pretty steady.
Most Inflated Posted Wait Times
We all know that Disney inflates their posted wait times on purpose. They have many reasons for doing this. Some are totally understandable, and some are potentially more problematic. We can figure out how much posted wait times are being inflated by comparing submitted actual wait times from the Lines App and the posted wait time when the person timing their wait entered the line.
Over the past week, actual wait times in the Lines App averaged 75% of what was posted. That’s slightly above our historical average in the era of Lightning Lanes, which means that posted wait times were less inflated than normal. Overall, if the posted wait time at a popular attraction was 60 minutes, you could’ve expected to wait just 45 minutes instead.
But the worst inflation offender for the past week was The Barnstormer. At this one attraction, submitted actual wait times were only 38% of posted wait times in the past week. That means that if Barnstormer had a 20 minute posted wait, you probably would have actually only waited 7.5 minutes instead. Almost a third of what was posted! Remember to always check the Lines app for predicted actual waits instead of making decisions based on what is posted.

This Week’s Wait Time Rock Star
Between July 14th and 20th, we had just over 1100 timed actual waits submitted through the Lines app. The one person who recorded the most actual waits during that time was SecondFavoriteDuck, with 31 overall timed waits – 15 Lightning Lane waits, 15 standby waits, and one single rider wait. Thanks for all of that timing, SecondFavoriteDuck! It unfortunately does not compete with the the 97 timed waits in a single week from our current timing champion, preef.
Looking Ahead: July 21 – 27
I write this article on Tuesday evenings so that you all have the very freshest of data on Wednesdays. That means the 21st will already be in the past by the time you’ve read this, so we’ve unlocked the secret of time travel!
Just like the rest of the summer, no big surprises should be headed our way in the next week. Normal park hours, no special events, etc. That means that unless we have huge downtime problems, crowd levels should stay in that overall 2-3 range.
A few more sunny days this week mean long, hot, sunny park days without the rain to cool things off at least temporarily. Having a good plan for afternoon breaks or lots of indoor attractions and shows will be critical. Then, afternoon thunderstorms should be back and you’ll need a plan for doing outdoor attractions in the morning and staying dry in the afternoon.
Were you in the parks this past week? Or are you headed to Orlando soon? Let me know in the comments below!
You May Also Like...
-

If you’ve been waiting for a quiet spring window at Walt Disney World that waits until after the wild winter crowds,…
-

Crowd levels stayed right where we've been expecting them to stay this week - remarkably low. But underneath those calm overall…

We got here last Wednesday and we are still here, and I can tell you- the crowds arrived on Monday! Last week, leaving in the morning for the parks was a walk on to all transportation. Last Saturday, there were 10 people on the bus to Magic Kingdom from Pop at 8 AM. Yesterday (Tuesday) at 8 AM, there were roughly 70 people in line for the 8 AM bus. Last Friday, we walked on the Skyliner at 8:30. This morning (Wednesday), there was a 20 minute line we had to wait in at the same time. I don’t know what caused it (The World Cup being over perhaps?) but it is definitely more crowded this week! Not crowded compared to Christmas, but definitely more than last week.