

Disney Data Dump July 15 2026
Crowd levels stayed right where we’ve been expecting them to stay this week – remarkably low. But underneath those calm overall numbers, one park had an absolutely spectacular meltdown that perfectly illustrates something I’ve been talking about all summer. When a park has very little extra capacity left to absorb problems, it doesn’t take much for wait times to spiral out of control.
So yes, we’ve got another week of great news if you’re planning a summer trip. But we’ve also got a pretty dramatic reminder that not all crowd level 2s (or 3s) are created equal. Let’s check it out!
Observed Crowd Levels July 7 – 13
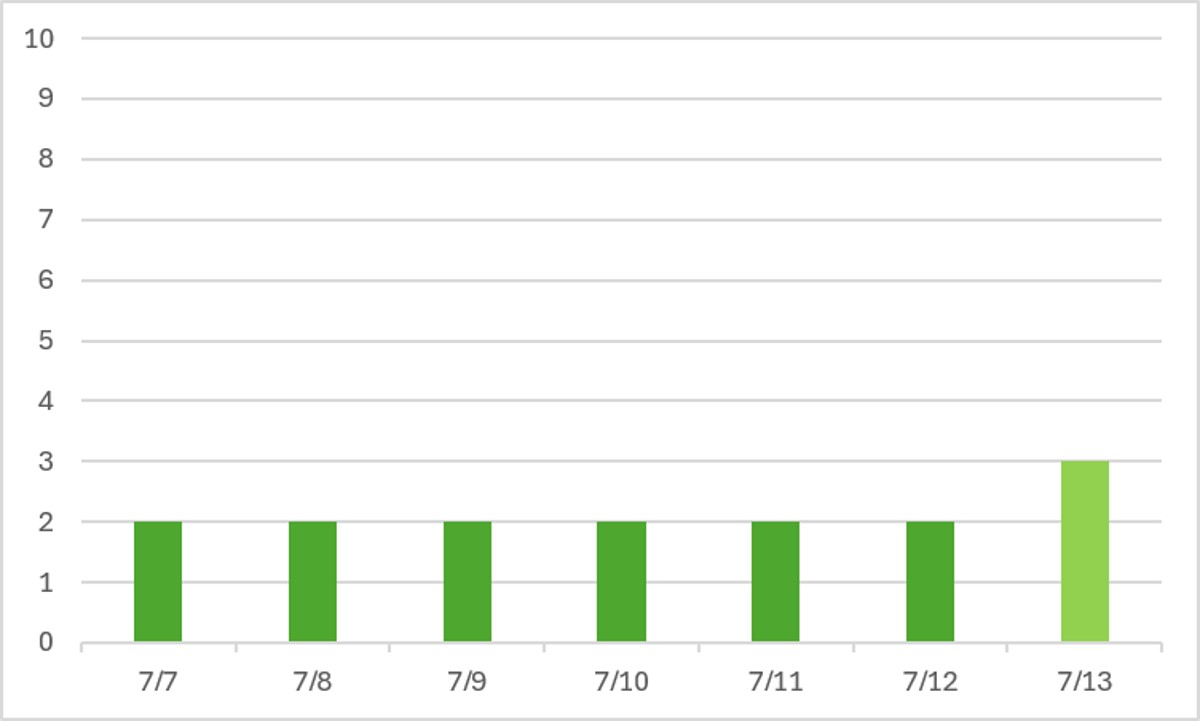
At the surface level, this was an easy and predictable week! Lots of crowd level 2 days, and then one “blip” up to a whole crowd level 3 on the 13th. If you’ve been following along at all this summer, none of this data should be surprising to you.
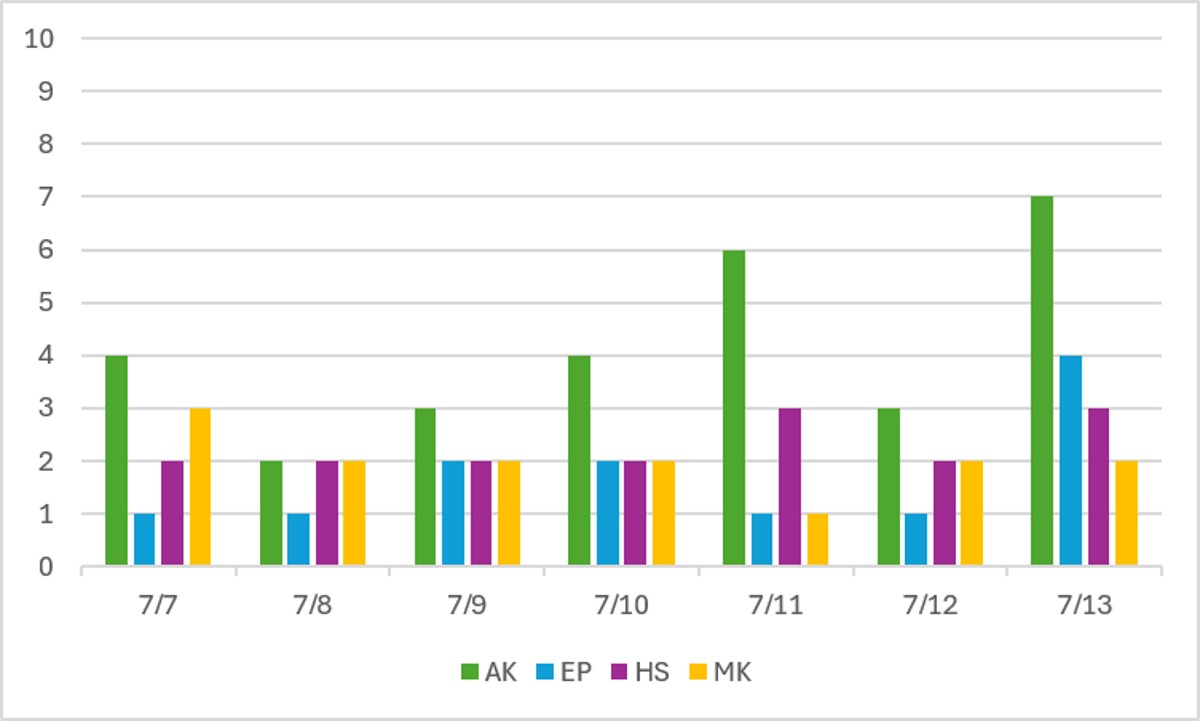
HERE’S where things get interesting! Look at those Animal Kingdom levels. I’ve been saying all summer that Animal Kingdom is the park that is most susceptible to swings in demand and capacity (aka, crowds and downtime). The 11th and 13th are great examples of the huge wait time spikes that can happen when even a little stress is added to the system. We haven’t seen a crowd level 7 at any park all summer, but Animal Kingdom lost 29% of its capacity on the 13th, so wait times everywhere else went crazy.
Performance of Crowd Level Predictions
Each week, I give you a very transparent look into how the TouringPlans crowd level predictions performed. Each day at each park is one data point, so each week we have 28 different crowd level predictions to evaluate. Any time a prediction is within one or two crowd levels, things won’t really “feel” much different than what was predicted. Being off by 3 or more crowd levels is where you might feel that difference in wait times throughout the day.
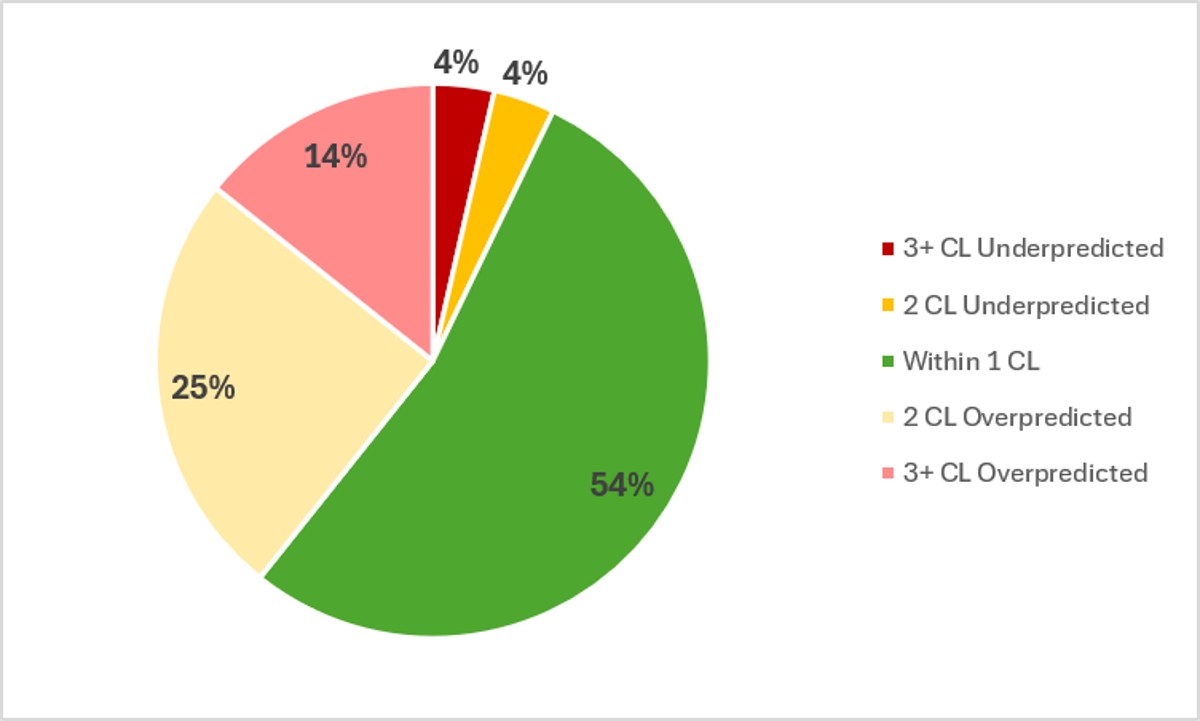
In the past week, Touring Plans predictions were either spot-on or within 1 crowd level 54% of the time, which is pretty in line with what we’ve seen for most of the summer. And 82% of the time Touring Plans predictions were within 2 crowd levels, so that’s a B- on predictions for the last week. As we get further into the summer, crowd levels still aren’t keeping pace with predictions that were already low, and were even adjusted lower once this summer. There were two significant underpredictions this week, at 2 and 3 crowd levels at Animal Kingdom. But as discussed earlier, that’s mostly thanks to those random spikes that are nearly impossible to predict. But there were also four underpredictions by three crowd levels in the past week, all at Magic Kingdom. In fact, every day at Magic Kingdom in the past week was an average of 2.6 crowd levels less crowded than predicted.
Attraction Downtime July 7 – 13
If we average all of the capacity lost due to unexpected downtime over the past week, it comes out to 5.9% of attractions unexpectedly being down. After the past two weeks being 7.7% and 8%, this is a welcome reprieve! Unfortunately, over the past week, Animal Kingdom was yet again the park with the worst overall downtime, averaging 9.4% of its capacity lost to downtime. That’s slightly lower than the past two weeks again. But it hides some truly truly awful days … more on that below.
The worst day for attraction downtime in the past week was on July 13th. On that day, 9% of all capacity at WDW was lost due to unexpected downtime. And the worst park-day of the past week was a combination of our worst park and worst day – at Animal Kingdom on the 13th, when 29% of that park’s capacity was lost due to unexpected downtime. Over a quarter of planned capacity! Even wore? 22% of the park’s capacity was lost to downtime on the 12th too. A truly unprecedented bad two-day run at Animal Kingdom. Animal Kingdom was open for 11 hours on the 13th, so 29% downtime is the equivalent of the entire park shutting down for 191 minutes. That’s over 3 hours of an 11 hour day! Imagine showing up to Animal Kingdom to have your full park day, but then Disney suddenly announces at 8 am that instead of opening the park as planned, they’re going to delay opening until 11:11 am. From a capacity standpoint, that’s what happened on the 13th.
Attraction Downtime Worst Offender
In the past week, our perennial winner Test Track had the worst overall downtime again. That’s the SIXTH week in a row for Test Track. It was unexpectedly down for 30% of the past week. Last week, it had 33% downtime, so …. progress? But in the past two weeks, there were lots of weather-related issues, and that didn’t have as much of an impact this week. So something else is going on.
The worst day of the past week at Test Track was on July 12th, when the attraction was down for 62% of the day. It struggled in the morning when the weather was fine, and then afternoon storms really doomed it. But it was also down for more than 30% of the day on the 10th and 13th.
Last week there were 5 attractions with over 20% downtime for the week. This week, only Test Track, Slinky Dog Dash, and Tiana’s Bayou Adventure cracked the 20% downtime mark.
Rope Drop Downtime
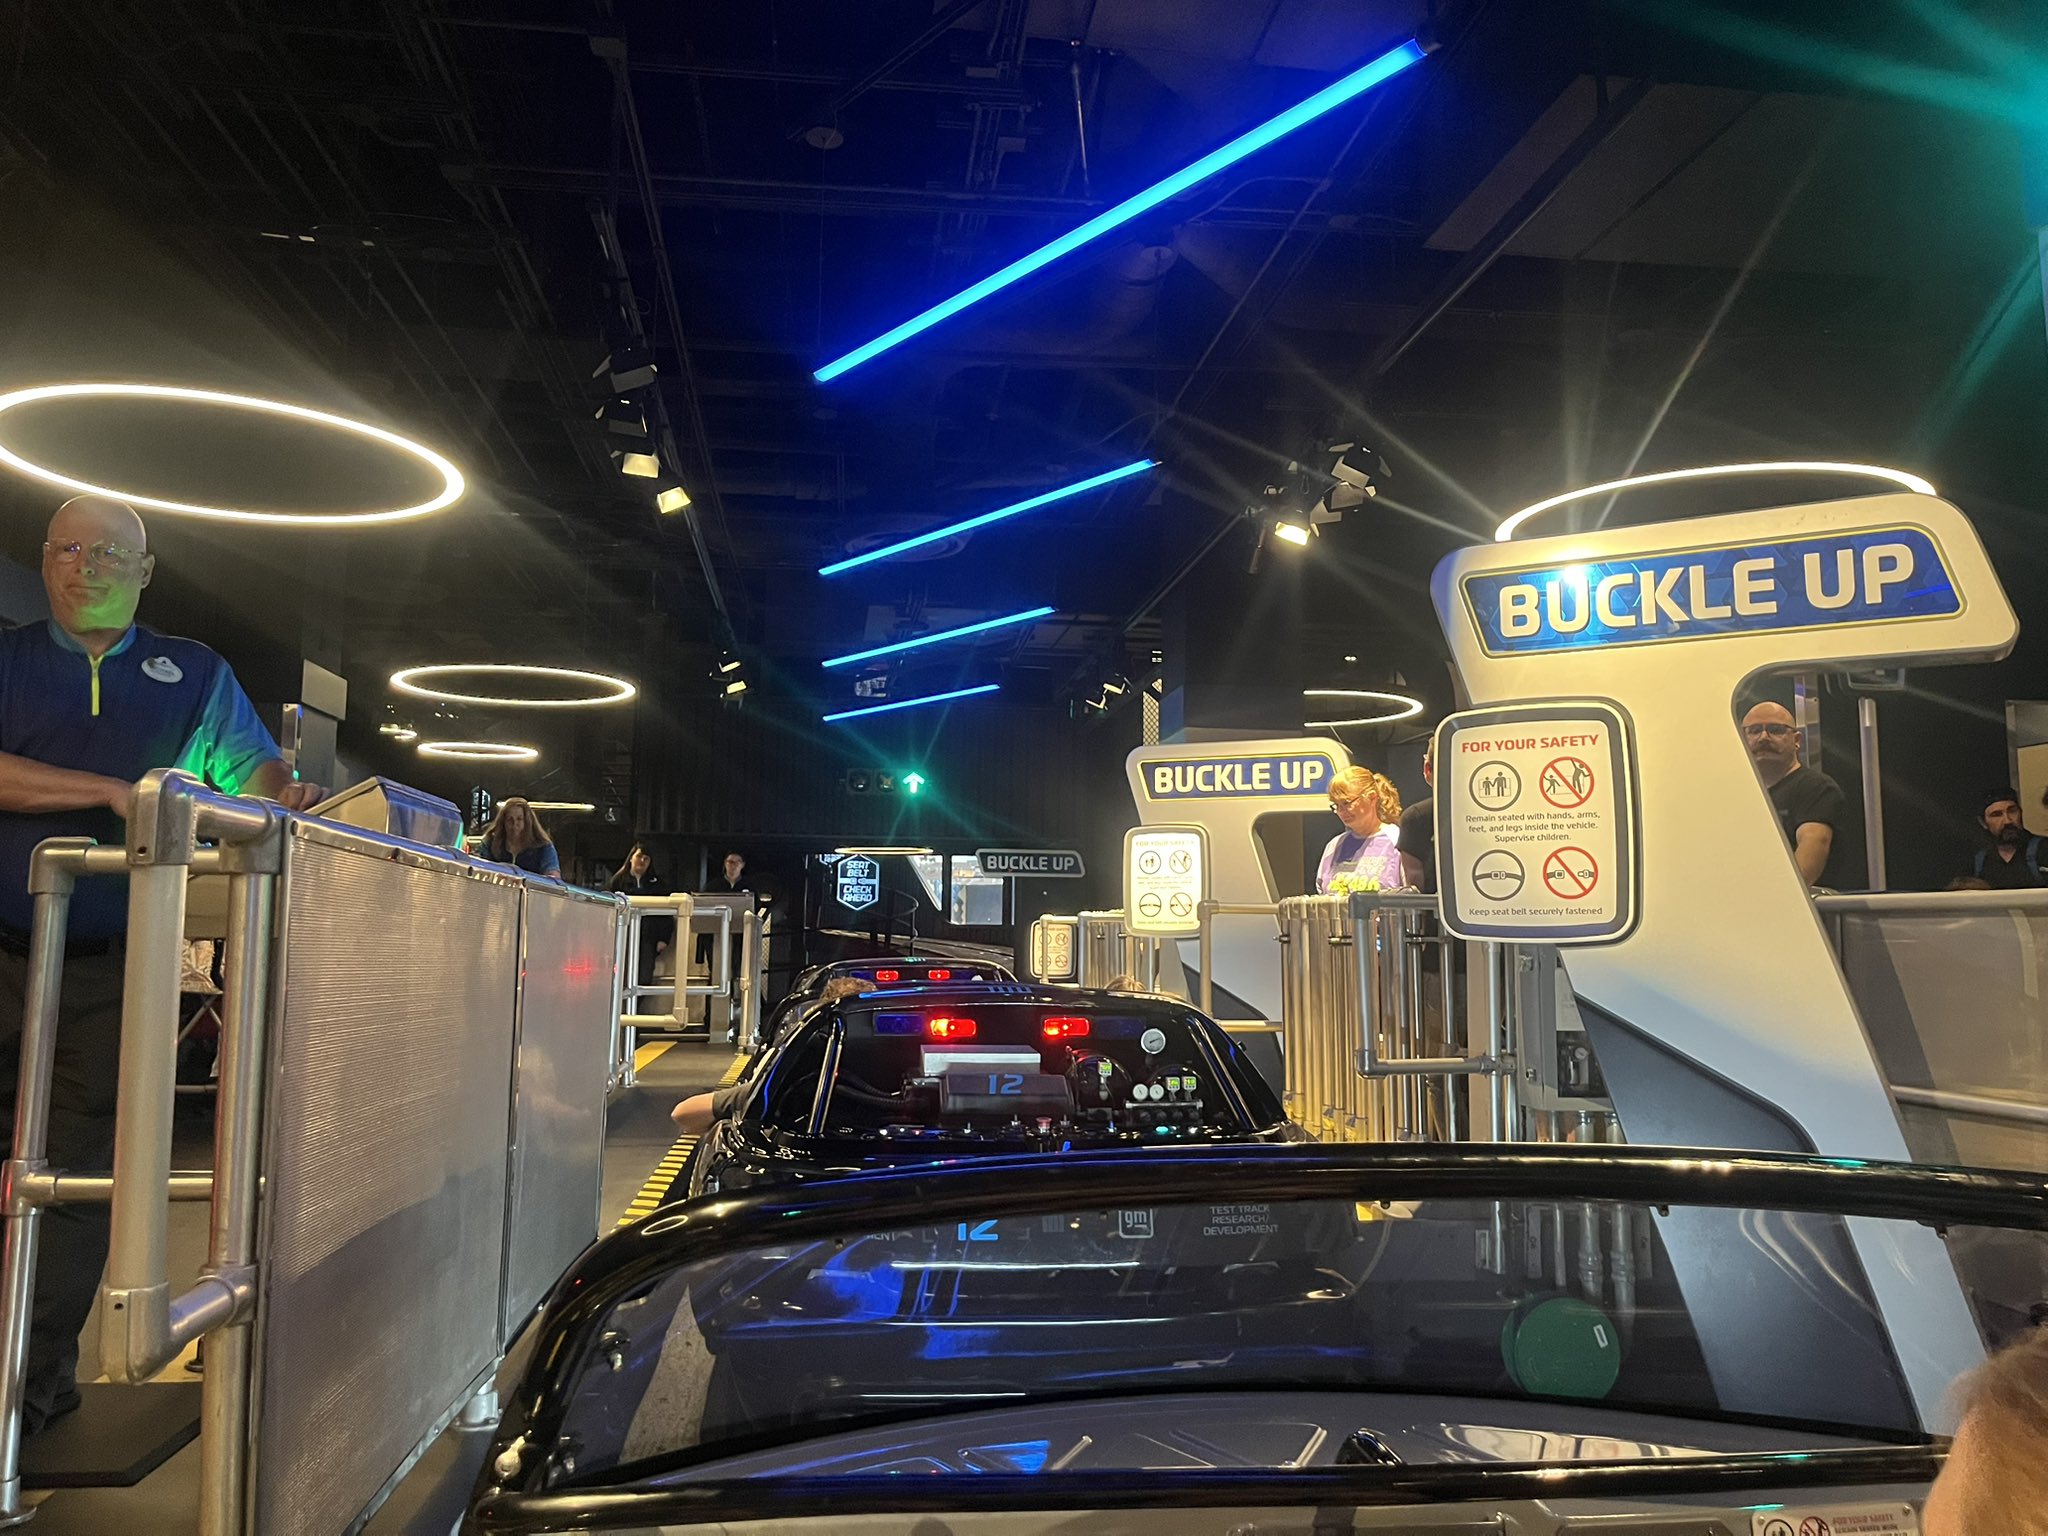
Here are problematic offenders from the past week, with the percentage of downtime during the first hour of the day in parentheses:
- Magic Kingdom: Tiana’s Bayou Adventure (48%), Under the Sea (33%), Haunted Mansion (26%), Big Thunder Mountain Railroad (20%), Space Mountain (11%), Pirates of the Caribbean (11%)
- EPCOT: Test Track (27%), Frozen Ever After (27%), Journey Into Imagination (11%)
- Hollywood Studios: Rise of the Resistance (26%), Rock’n’Roller Coaster (13%)
- Animal Kingdom: Na’vi River Journey (23%), Kali River Rapids (17%)
Alas, our one good week at Magic Kingdom was just one good week at Magic Kingdom, not a reversal of the trend of lots of rope drop downtime. Plenty of headliners were having trouble there over the last few days.
The Test Track/Frozen combo at EPCOT is also worrisome, since rope drop crowds tend to get split four ways (Cosmic Rewind – Test Track – Frozen – Remy), and having two of those options go down has a HUGE impact on wait times at the others.
Wait Times July 7 -13
Attractions with the Highest Average Posted Wait at Each Park
- EPCOT: Test Track, average posted wait of 74 minutes (was 72 minutes last week)
- Hollywood Studios: Slinky Dog Dash, average posted wait of 70 minutes (was 68 minutes last week)
- Magic Kingdom: TRON, average posted wait time of 62 minutes (was 61 minutes last week)
- Animal Kingdom: Flight of Passage, average posted wait time of 55 minutes (was 53 minutes last week)
Slight increases across the board this week! Clearly, the average waits at Test Track were pretty high, thanks to being down for almost a third of the entire week. Slinky was impacted by a lot of downtime this week too. Otherwise, indoor and otherwise-reliable headliners barely saw their low average posted waits change from last week.
Parks with the Highest and Lowest Average Wait
- Highest: Hollywood Studios, average park-wide posted wait of 33 minutes (was 29 minutes last week)
- Lowest: Magic Kingdom, average park-wide posted wait of 20 minutes (was 19 minutes last week)
Thanks to average waits bouncing up at Slinky Dog Dash and Rock’n’Roller Coaster this week, the average posted wait at Hollywood Studios peaked up over 30 minutes again. But it was the only park where the average posted wait was over half an hour. Everywhere else was under that “uncrowded” mark. And Magic Kingdom almost made it back into the teens for a second week in a row!
Most Inflated Posted Wait Times
We all know that Disney inflates their posted wait times on purpose. They have many reasons for doing this. Some are totally understandable, and some are potentially more problematic. We can figure out how much posted wait times are being inflated by comparing submitted actual wait times from the Lines App and the posted wait time when the person timing their wait entered the line.
Over the past week, actual wait times in the Lines App averaged 76% of what was posted. That’s quite a bit above our historical average in the era of Lightning Lanes, which means that posted wait times were less inflated than normal. Overall, if the posted wait time at a popular attraction was 60 minutes, you could’ve expected to wait a little over 45 minutes instead.
But the worst inflation offender for the past week was Meet Beloved Disney Pals at EPCOT. At this one attraction, submitted actual wait times were only 21% of posted wait times in the past week. That means that if Meeting Mickey and his friends had a 20 minute posted wait, you probably would have actually only waited 4 minutes instead. Less than a quarter of what was posted! Remember to always check the Lines app for predicted actual waits instead of making decisions based on what is posted.

This Week’s Wait Time Rock Star
Between July 7th and 13th, we had just under 1000 timed actual waits submitted through the Lines app. The one person who recorded the most actual waits during that time was lizzieboardman, with 44 overall timed waits – 17 Lightning Lane waits and 27 standby waits. Thanks for all of that timing, lizzieboardman! It unfortunately does not compete with the the 97 timed waits in a single week from our current timing champion, preef.
Looking Ahead: July 14 – 20
I write this article on Tuesday evenings so that you all have the very freshest of data on Wednesdays. That means the 14th will already be in the past by the time you’ve read this, so Welcome To Your Future!
No big surprises should be headed our way in the next week. Normal park hours, no special events, etc. That means that unless we have huge downtime problems, crowd levels should stay in that overall 2-3 range.
A few more sunny days this week mean long, hot, sunny park days without the rain to cool things off at least temporarily. Having a good plan for afternoon breaks or lots of indoor attractions and shows will be critical. Then, afternoon thunderstorms should be back and you’ll need a plan for doing outdoor attractions in the morning and staying dry in the afternoon.
Were you in the parks this past week? Or are you headed to Orlando soon? Let me know in the comments below!
You May Also Like...
-

Remember a few weeks ago when I said summer was off to the slowest start since 2014? Somehow it's gotten even…
-

If you were in the parks over the past 7 days, it might have felt like two completely different trips stitched…

Heading to Orlando TODAY, with a game plan for managing the heat and a hope crowd levels stay super low. Thanks for your data dump updates!