Crowd Calendar Updates For Summer 2017 And Beyond
Summer 2017 is in full swing, and it is time to refresh the the Disney World Crowd Calendar. We now know a little about the popularity of Pandora at Animal Kingdom and how the crowds at that park are affected by the new land. Disney’s Hollywood Studios is affected, too, as Animal Kingdom draws more than its usual share of guests visiting a third park after Magic Kingdom and Epcot. We have completed a full review of 2017-2018 school schedules, as well, so we have more accurate forecasts for Fall 2017 and Winter 2018. But first, let’s take a look at how the calendar has been doing lately.
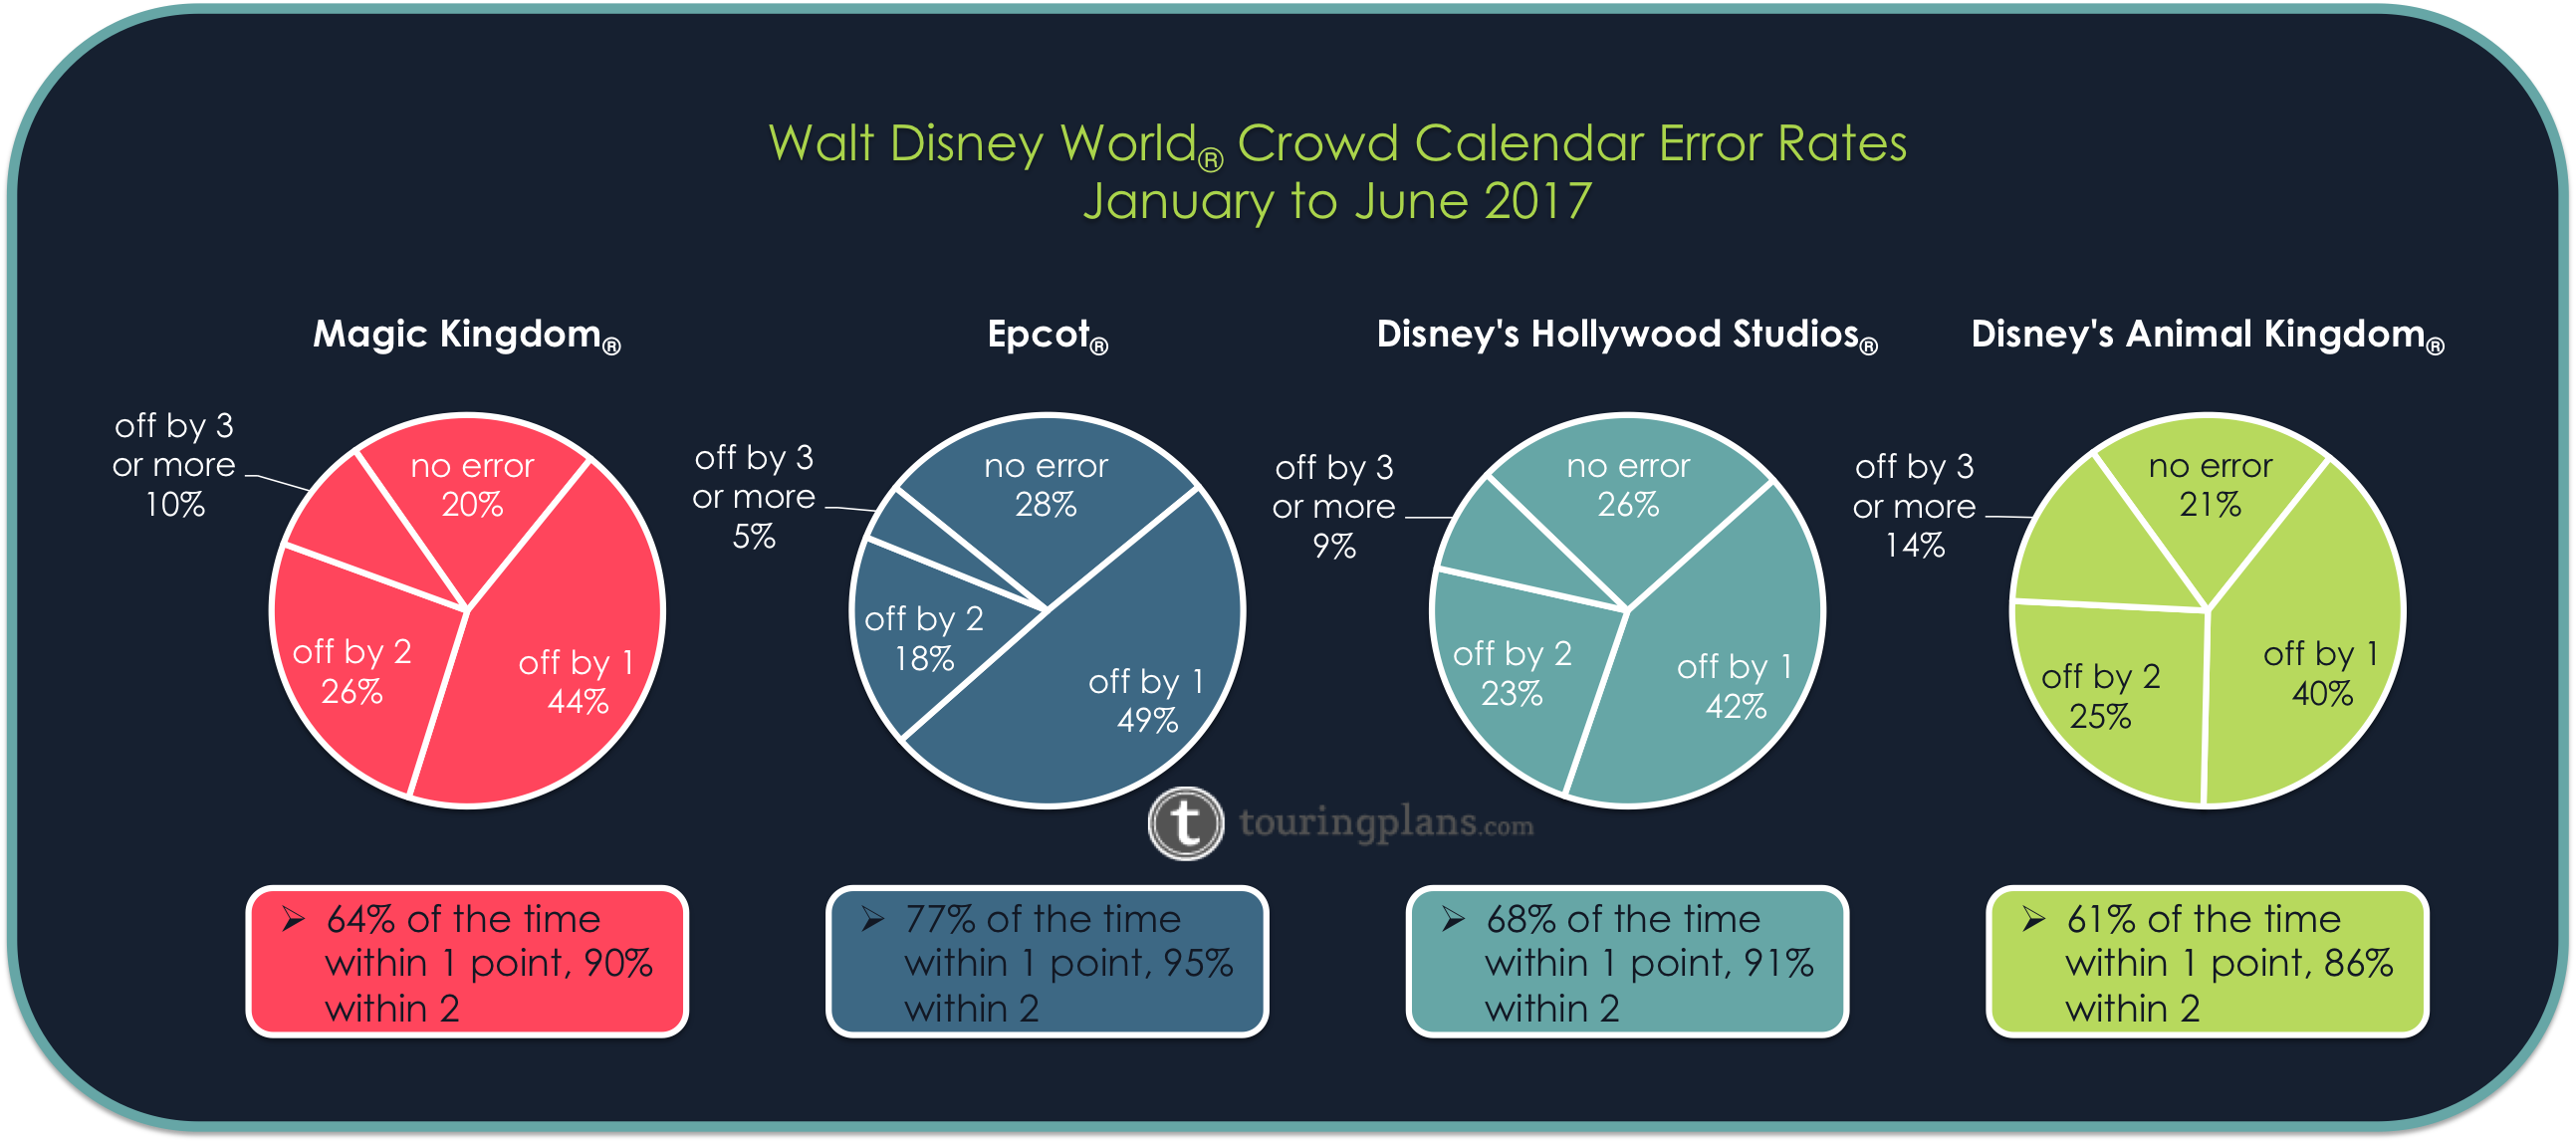
After some atypical crowds in 2016, the Disney World Crowd Calendar appears to be performing better thanks to some reworking of our models. In June the average error at Magic Kingdom is one index point, and for 11 of the last 14 days the calendar has been bang-on. Predictions at the other three parks also did well, with average errors less than 1.5 index points since June 1. Animal Kingdom remains as the most volatile park, as expected. Not only does it have the newest attractions on property, but the park has the fewest attractions of the four parks, so swings in the wait times there have a greater effect on the crowd calendar than at the other parks. In 2017 about 90% of the time the crowd calendar figures are correct within two index points, and about two-thirds of the time they are within one. That is an improvement of 4-5 percentage points over what we saw last year. As a guest using a touring plan, a difference of one index point is virtually unnoticeable, and a difference of two index points represents just 2-3 minutes of wait time per attraction. The error rates are nicely balanced, as well, with as many days overestimated as underestimated. So, if the calendar is off by two points, it is just as likely that you will wait 2-3 minutes less per attraction than 2-3 minutes more.
There are still odd days when we see crowds drastically different than what was predicted, but they are less frequent in 2017 compared to 2016. If you arrive in a park that appears to be much more crowded than predicted, don’t panic – stick to the plan and make sure to refresh it so that it can re-optimize using the latest wait times observed during the day.
So, now on to the update. This batch of changes is mostly minor, with movement of a point or two on some days. Most days will not change. When a day does change as a result of this update, it is most likely due to updated information about the summer schedule, the schedule for Halloween and Christmas parties in the fall, or new school schedule data. Let’s take a look by month.
July
Hollywood Studios doesn’t appear to have any special Fourth of July fireworks this year, so you will see a drop of four points at that park. They still have the Star Wars: A Galactic Spectacular, and we highly recommend that park on July 4th because Magic Kingdom and Epcot are expected to be very busy. With international travel down significantly and more families willing to take children out of school to do Disney World, our forecasts are showing drops for wait times this summer. Many days in July will see a dip of one to three points. It is still very crowded, however, so make sure to follow a plan.
August
This update brings only minor adjustments to crowd levels in August, mostly at Animal Kingdom. Pandora has shown some indications of holding its popularity through the summer, so the forecasts are nudging up the numbers until schools start to go back in session at the end of the month.
September
As always, September still looks like a great month to visit with several ‘1’s and ‘2’ on the calendar. No major changes on this update.
October
You may see some changes in October, and those are due partly to confirmed dates for Mickey’s Not-So-Scary Halloween Parties. We have placeholders that allow us to make forecasts well in advance, but once we know that real dates the models need adjusting. Still, most changes are minor, with movement of a single point.
November
By November we expect the Pandora hype to settle down and Animal Kingdom to have normal crowd levels for that time of year. You will see a drop by a point or two at that park on some days to reflect this. Elsewhere crowd levels remain mostly unchanged by this update. Thanksgiving week will be packed, of course, and days around Veterans Day will have their typical bump.
December
We have minor changes for December in reaction to the latest schedule information for Mickey’s Very Merry Christmas Parties. Park hours for December are confirmed, but there is a reasonable chance that we will make further adjustments as December approaches.
January
There aren’t a lot of changes to report for January, but the changes you do see are most likely due to the confirmation of school schedules for January 2018 (and beyond). When looking at dates in 2018 it is important to note that we are still six months away, so further changes are likely.
February
Our models seem to want to bump up forecasts for Presidents Week in February. You will see some bumps between February 15 and 25, especially at Magic Kingdom. These seem influenced by slight underestimates in 2017 during the same week. School schedule data may be a factor, as well. The other parks should be the same as the previous calendar most days in February.
March
When we see updates in March 2018 we can be fairly certain they stem from updates to the spring break schedule for the 100+ school districts we track. Combine that with observations from March 2017, and we get some significant bumps in crowd level for March 2018 across all four parks. The increases occur between March 7 and 17, 2018.
April
Updates in April are mostly going the other way, dips of one or two points, although many days remain unchanged from the previous calendar. Early in the month we do see an increase of a point or two for some parks.
May
In 2017, May was a great month to visit Walt Disney World. Crowds were moderate and predictable. We have no major changes to the crowd levels on this update, but the more we look at crowd patterns in May the more we like this month as a good choice, especially now that the window for really low crowds in September seems to be getting shorter every year.
June
It is a little early to analyze crowd levels for June 2018, but for the sake of completeness this calendar update includes some changes for June. They are minor changes and these figures will certainly be adjusted at least once more before we arrive at summer 2018.
You May Also Like...
-

We have had a few weeks to observe the wait times at Universal Orlando Resort since the parks reopened in June.…
-

Our latest Universal Crowd Calendar update was incomplete. We have now updated the dates that were missed. For a description of…
-
Disney World parks have reopened and we were surprised to see that Universal Crowd levels appear to be unaffected. Saturday crowds…
-
This Crowd Calendar update is a bit of fine-tuning to the Walt Disney World and Universal Orlando. Walt Disney World Most…
I’m tracking Marathon weekend right now and saw that your updates bumped up HS and AK to 9s on January 6th? Why are they higher than MK and Epcot that particularly day? They both bump the next Sunday too. Just curious as we are prepping for ADRs this weekend. Thanks, been subscribing since 2013.
Maybe it would be easier if you just admitted there’s a giant ass at Len Testa’s house, and you just pull random crowd estimates out of it?
Wrong. Everyone knows LT lives out of his car, parked at that S Apopka Vineland Rd Winn Dixie. No way the giant ass could be located there.
It’s the Publix in Celebration, thank you very much.
We had to get rid of the ass. Not as accurate as what we have.
I’d offer it to you at a good price, but it looks like you’re already covered.
LMAO
LIKE.
Big ol fat thumbs up! BTW: I always post using my real name anywhere online….
Thanks for all of the info on your site (and in the book)! When I heard that MK was going to close at 4:30pm on 11/30/17, I was guessing that the crowd level would go down when you updated the calendar. But it actually went up from a 3 to a 4. And the following Thursday, 12/7/17, is only at a 1. Any reason or is that just the way the averages worked out?
Love this post! Thank you for all the hard work that you do, I would be lost without your touring plans. Thank you also for your transparency in showing us your successes and opportunities for improvement.
Thanks Dawn, any statistical model must be transparent about its error rates in my opinion.
Has any model been added to the Epcot predictions to account for the fact that crowds during the two big festivals are not very correlated to ride times, especially on weekends during the festivals?
Hi Lee. The crowd calendar projects wait times onto a 1-10 scale so no, large crowds due to festivals (that do not increase wait times at the attractions) are not a factor for the estimates. Instead, we note special events and strongly suggest you avoid them unless the festival is important to you. A list of how special events affect crowds can be found here: Special Events
Fred:
Have you ever thought about adding user-supplied wait times for the booths during festivals? Our experience is that the crowd calendar poorly predicts crowds during festivals, especially on weekends. An example was a “6” Saturday during F&W where it was almost impossible to walk for the crowds in WS. Even though Disney doesn’t supply official wait times for the booths, I would think user-supplied ones would give you a better handle on the actual crowds.
Thanks for the update Fred. Even though most of the changes are slight (if at all) when will the touring plans be use the new numbers? If I remember correctly it is not immediate and the plans I have saved didn’t change when I optimized today.
Actually, Chris, the changes to the wait time estimates come first so your touring plans (if optimized within the last month) should reflect the latest forecasts. Updating the calendar is the last step.