
Disney Data Dump August 5 2026
It was the summer-est of times, it was the fall-est of times. Because this week brought us one of the “most crowded” weeks of an extremely uncrowded summer, and next week brings the first Mickey’s Not-So-Scary Halloween Party. Time is weird.
We’ve also got a lot of strange data to unpack. Monday hit crowd level 4 for the fourth week in a row, Animal Kingdom somehow managed a crowd level 1 on a day that it lost 17% of its capacity to downtime, and Test Track found its way back to the top of the downtime list—this time tied with another EPCOT headliner. So let’s dig into the last-minute summer vacation bump, some deeply unhelpful rope drop unreliability, and why Friday may be one of the best Magic Kingdom days we see for a while.
Observed Crowd Levels July 28 – August 3
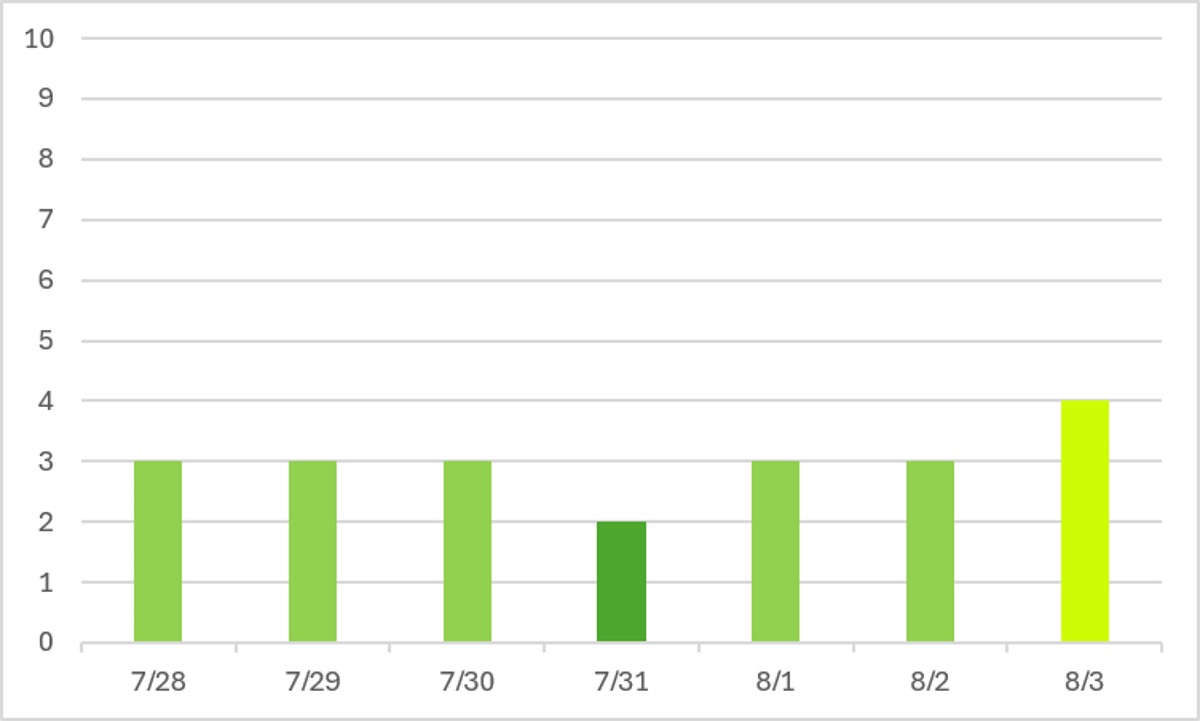
The trend continues! This is now the fourth week in a row that Monday is the most crowded day of the week, once again popping up to a whole crowd level FOUR. Like I called out last week, this does not mean the parks are crowded on Mondays. A 4 is still below average for the year. But it is still significantly above average for this summer, when we’ve had crowd levels closer to 2 on most days. And, this past week is arguably the most crowded week of the summer. Lots of last-minute summer vacations before kids start going back to school. We should see things start to calm down as we head into next week.
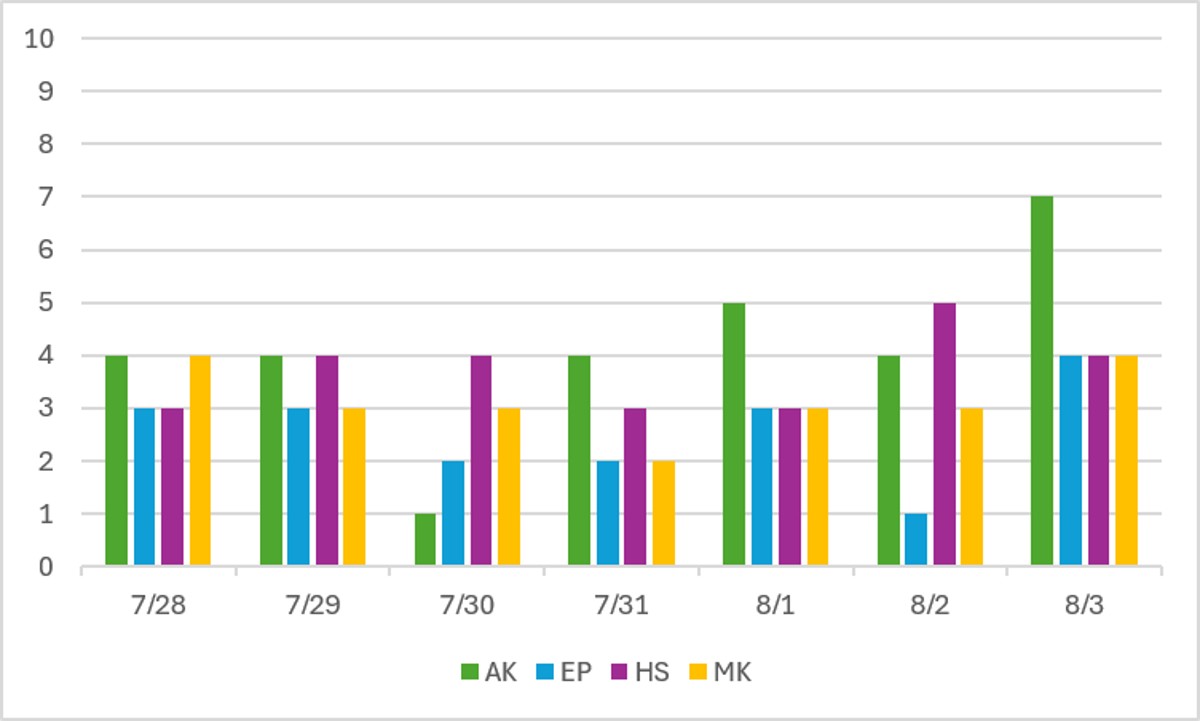
There are some very interesting trends at the park-by-park level this week – especially at Animal Kingdom! Animal Kingdom has been the most-crowded park (or tied for the most-crowded park) every day since Memorial Day. But on July 30th … it was suddenly empty! And then Diet EPCOT has been running slightly more crowded than the rest of summer for the past two weeks, but on the 2nd it also randomly emptied out.
Monday’s results are particularly telling – with all parks hitting at least a crowd level 4, and Animal Kingdom rocketing up to a 7!
Performance of Crowd Level Predictions
Each week, I give you a very transparent look into how the TouringPlans crowd level predictions performed. Each day at each park is one data point, so each week we have 28 different crowd level predictions to evaluate. Any time a prediction is within one or two crowd levels, things won’t really “feel” much different than what was predicted. Being off by 3 or more crowd levels is where you might feel that difference in wait times throughout the day.
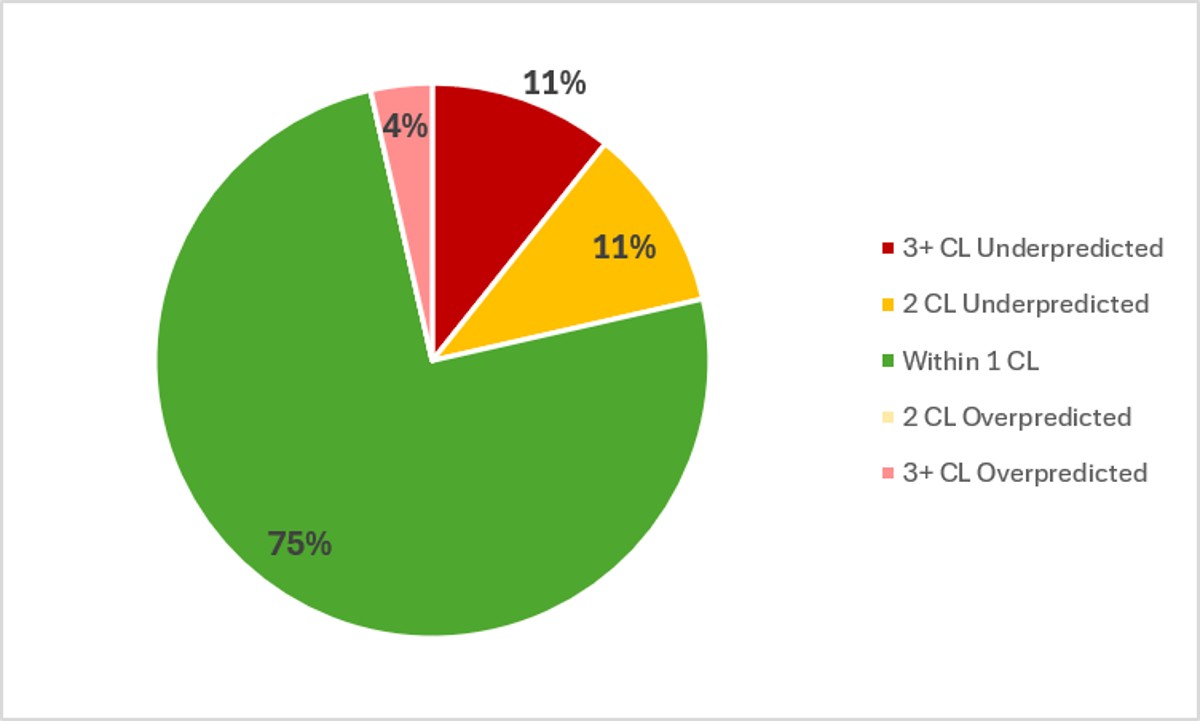
In the past week, Touring Plans predictions were either spot-on or within 1 crowd level 75% of the time, which is better than what we’ve seen for most of the summer. And 85% of the time Touring Plans predictions were within 2 crowd levels, so that’s a B on predictions for the last week! Interestingly, this is the first week in …. months and months where underpredictions outpaced overpredictions. In general, we’d like overpredictions and underpredictions to be pretty even because that means there’s just slight variance around what we predict. We don’t want to be skewed one way or another. But the adjustments that Len has made over the past few weeks are now catching up with how low crowds have dropped this summer, which is a good thing. This week, our biggest misses were all overpredictions or underpredictions by three crowd levels. There was one overprediction and three underpredictions, impacting every park other than Magic Kingdom.
Attraction Downtime July 28 – August 3
If we average all of the capacity lost due to unexpected downtime over the past week, it comes out to 6.3% of attractions unexpectedly being down. This is slightly above our “normal” WDW summer average. Over the past week, Hollywood Studios was the park with the worst overall downtime, averaging 6.9% of its capacity lost to downtime. All parks fell somewhere between 5.3% downtime (Animal Kingdom) and 6.9%.
The worst day for attraction downtime in the past week was on August 1st. On that day, 12% of all capacity at WDW was lost due to unexpected downtime. But the worst park-day of the past week was on the 30th, over at Animal Kingdom, when 17% of that park’s capacity was lost due to unexpected downtime. Animal Kingdom was open for 11 hours on the 30th, so 17% downtime is the equivalent of the entire park shutting down for more than 112 minutes. That’s like all of Animal Kingdom unexpectedly opening at 9:52 am instead of 8 am. But impressively, Animal Kingdom still only managed a crowd level 1 on the 30th despite all of that downtime!
Attraction Downtime Worst Offender
Interesting result alert! We’ve got a tie for the worst downtime offender of the past week – and I calculated this down to the thousandth of a percent! Unfortunately, one of the attractions tied for the “win” is our repeat offender of the summer, Test Track. And even more unfortunately, the attraction it tied with is also at EPCOT: Frozen Ever After. Both of these popular headliners were unexpectedly down for 26.857% of the past week (told you I calculated it down to the thousandth). That’s two major draws that were down for over a quarter of the week, which has a huge impact on park day planning and wait times elsewhere throughout the park.
Only one other attraction had over 20% downtime this week – Space Mountain, with 22% downtime.
Rope Drop Downtime
Here are problematic offenders from the past week, with the percentage of downtime during the first hour of the day in parentheses:
- Magic Kingdom: Tiana’s Bayou Adventure (44%), Haunted Mansion (32%), Space Mountain (15%), Peter Pan’s Flight (15%)
- EPCOT: Frozen Ever After (28%), Test Track (16%), Remy’s Ratatouille Adventure (13%)
- Hollywood Studios: Slinky Dog Dash (28%), Rock’n’Roller Coaster (25%), Rise of the Resistance (17%), Runaway Railway (16%)
- Animal Kingdom: No rope drop downtime issues this week!
First things first. Peter Pan’s Flight?! That’s the one attraction at Magic Kingdom that I generally call out as being your best rope drop option! How dare.
Next things next: Gold start for the week goes to Animal Kingdom for no rope drop downtime issues. Hooray!
On the other hand, EPCOT had a particularly rough rope drop week, with Frozen, Test Track, and Remy all showing up on the naughty list. All three are smart rope drop options … but apparently you need a Plan D in case your top 3 options are all down.
Wait Times July 28 – August 3
Attractions with the Highest Average Posted Wait at Each Park
- EPCOT: Cosmic Rewind, average posted wait of 80 minutes (was 75 minutes last week)
- Magic Kingdom: TRON, average posted wait time of 74 minutes (was 70 minutes last week)
- Hollywood Studios: Slinky Dog Dash, average posted wait of 70 minutes (was 69 minutes last week)
- Animal Kingdom: Flight of Passage, average posted wait time of 61 minutes (was 65 minutes last week)
These numbers confirm that this was one of the most crowded weeks of summer! That’s not difficult to do, because this summer has been remarkably uncrowded. Even these average posted waits aren’t terribly high compared to fall and winter. We’ll start seeing significant increases as we head into October.
Parks with the Highest and Lowest Average Wait
- Highest: Hollywood Studios, average park-wide posted wait of 36.5 minutes (was 36 minutes last week)
- Lowest: Magic Kingdom, average park-wide posted wait of 22.5 minutes (was 22 minutes last week)
Minor increases compared to last week, but they’re still increases, which points to more families taking those last-minute summer vacations! I expect things to ease back over the rest of August.
Most Inflated Posted Wait Times
We all know that Disney inflates their posted wait times on purpose. They have many reasons for doing this. Some are totally understandable, and some are potentially more problematic. We can figure out how much posted wait times are being inflated by comparing submitted actual wait times from the Lines App and the posted wait time when the person timing their wait entered the line.
Over the past week, actual wait times in the Lines App averaged 71% of what was posted. That’s significantly lower than our historical average in the era of Lightning Lanes, which means that posted wait times were more inflated than normal. Overall, if the posted wait time at a popular attraction was 60 minutes, you could’ve expected to wait just under 43 minutes instead.
But the worst inflation offender for the past week was Meet Anna & Elsa. At this one attraction, submitted actual wait times were only 31% of posted wait times in the past week. That means that if Anna & Elsa had a 30 minute posted wait, you probably would have actually only waited a little over 9 minutes instead. Less than a third of what was posted! Remember to always check the Lines app for predicted actual waits instead of making decisions based on what is posted.
This Week’s Wait Time Rock Star
Between July 28th and August 3rd, we had just over 1000 timed actual waits submitted through the Lines app. The one person who recorded the most actual waits during that time was passesforsix, with 43 overall timed waits – 31 standby waits and 12 single rider waits. Thanks for all of that timing, passesforsix! It unfortunately does not compete with the the 97 timed waits in a single week from our current timing champion, preef.
Looking Ahead: August 4 – 10
I write this article on Tuesday evenings so that you all have the very freshest of data on Wednesdays. That means the 4th will already be in the past by the time you’ve read this, so you’ve time-travelled!
We’ve made it to fall! Ok, maybe not based on weather … or by the calendar. But the first Mickey’s Not-So-Scary Halloween Party is in this look ahead, which is basically Disney’s definition of fall. That means that the 7th should be a great day to visit Magic Kingdom. I’ll be there that day! Am I attending the party? No. Do I want to experience emptiness of the first party day of the year? Absolutely! You can also expect Hollywood Studios to absorb some extra guests on the 7th as that tends to be the backup park of choice for people who don’t want a short Magic Kingdom day.
Otherwise, we should stay hovering around the crowd level 3 range for the upcoming week.
Every day of the next week has some threat of thunderstorms throughout the day, especially in the afternoons. Humidity will also be high, with feels-like temperatures about 10 degrees hotter than the actual temperature. Highs are pretty steady in the low 90s, so you’ll be dealing with plenty of heat and rain throughout the week. Stay prepared!
Extra bonus: I’ll be in the parks this weekend with my Big Kid for her 1:1 trip. Don’t tell her, but we’re dining at Victoria & Albert’s, doing Wild Africa Trek and visiting the Grand Floridian Spa. Let me know if you want reviews of any of those experiences!
Were you in the parks this past week? Or are you headed to Orlando soon? Let me know in the comments below!
You May Also Like...
-

Well, that Starlight Summer Surge was ... brief. It fizzled fast, and now we’re solidly in empty August territory. Blame school…
-

What we saw this past week is a really good reminder that Spring Break season isn’t one clean spike. It’s a…

From disneys earnings report they seem to say that the parks are doing well which doesn’t jive with the results you are seeing. To quote
And yet, at Disney, domestic park attendance was up 3% and guest spending rose 4%, Chief Financial Officer Hugh Johnston told CNBC. He also called out the “very strong attendance” at Walt Disney World in Orlando.
“Those numbers are somewhat different than what you would have seen from our competitor down there, as well as some of the reported traffic coming through Orlando [International] Airport,” he added.
The company attributed strong attendance to its Cool Kids Summer promotion, which features kid-focused character meet-and-greets, dance parties and air-conditioned hangout spots as well as free water park admission for hotel
Both things can be true, Jerry 🙂
2025 was the lowest summer ever, so a 3% increase isn’t particularly impressive. And I’m willing to bet most of that was actually at Disneyland, which hasn’t seen the empty parks that Disney World has this summer.
Wait time data doesn’t like, and overall summer wait times this summer are lower than they were last summer, and are the lowest since at least 2014.
Would love an updated review of Africa Trek, and the kids short review of Victoria and Alberts!