
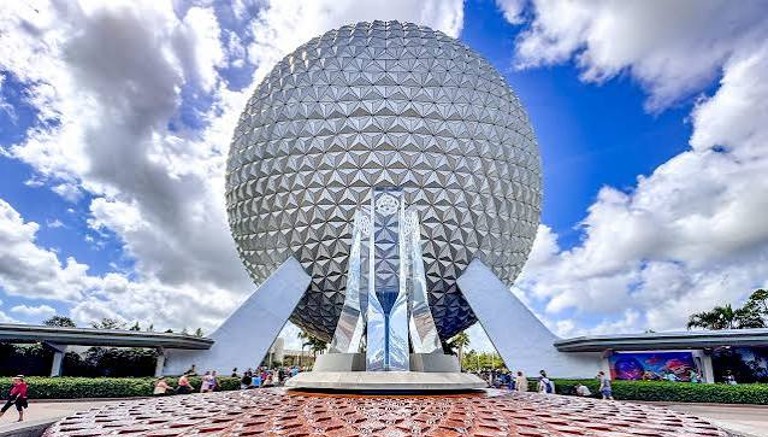
Disney Data Dump August 19 2026
If you enjoy crowd-calendar whiplash, Walt Disney World delivered beautifully this week. We went straight from the most crowded week of the summer to the least crowded week of the summer, with not a single resort-wide day making it above a crowd level 2.
And underneath those very pretty overall numbers, there’s even better news. Magic Kingdom party days are producing some genuinely ridiculous (in a good way) wait times, headliners across all four parks dropped by at least 10 minutes compared to last week, and rope drop downtime was unusually well-behaved. EPCOT did have one attraction spend almost half the week unexpectedly closed, because I guess we aren’t allowed to have all nice things at once. But overall? If this is what the rest of August wants to look like, I will happily take it.
Observed Crowd Levels August 11 – 17
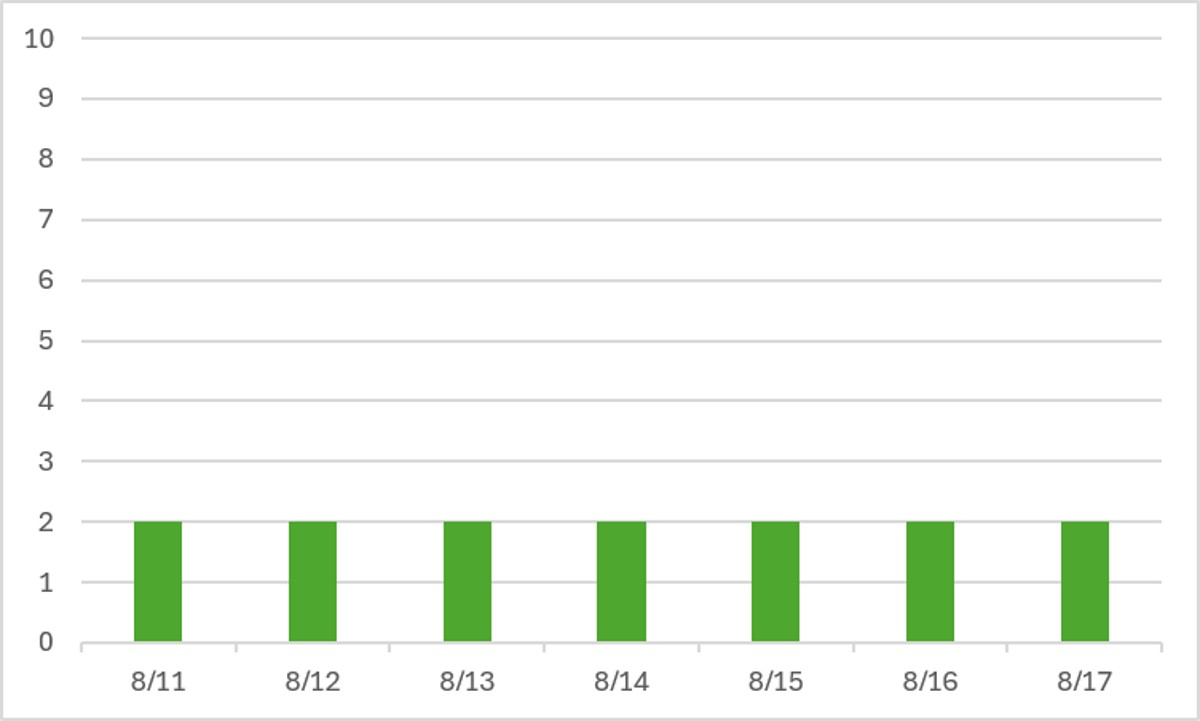
What a change! Last week was the most crowded week of the summer, and this week is the least crowded week of summer! Not a single day managed to pop above a crowd level 2. This is what I love to see from a Disney summer (although I’m sure Disney executives love it less).
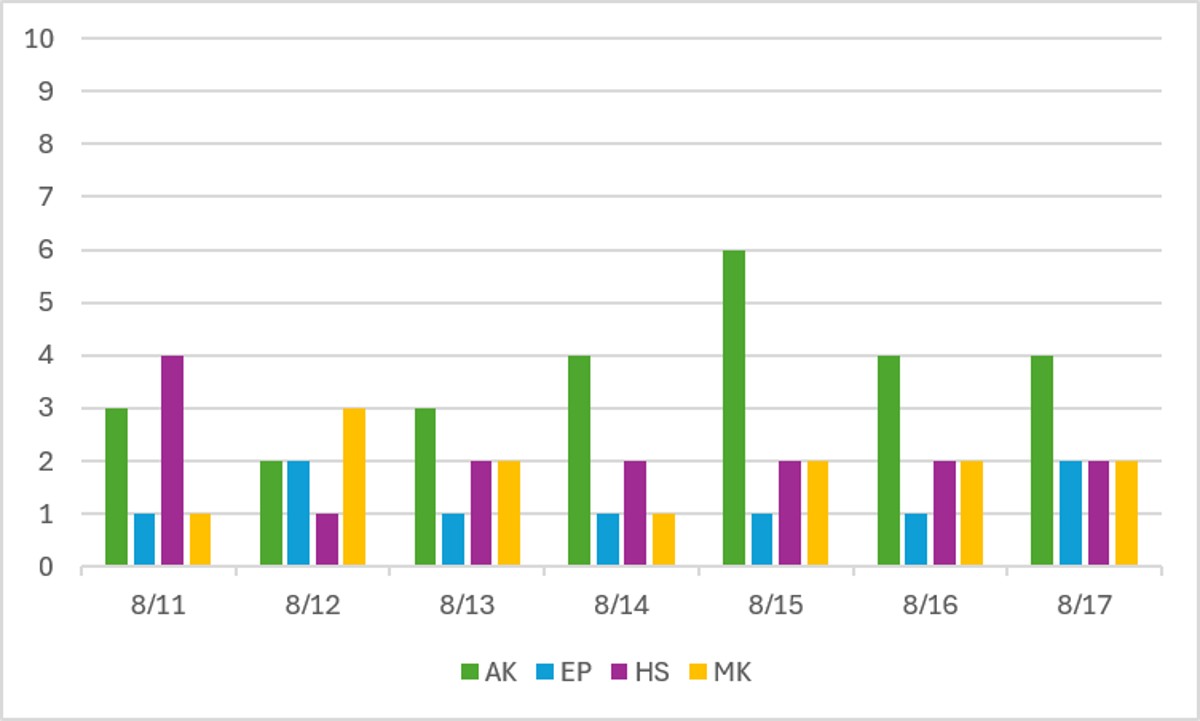
Underneath that steady results of 2s all week was a little more interesting-ness. Magic Kingdom had such low crowds that you can barely even tell where the party days are, but the 11th and 14th did drop down to crowd level one. That being said, party days aren’t meaningless. The average posted wait at Magic Kingdom on non-party days so far this season has been 21 minutes (still very low), but on party days that average wait drops to 15.5 minutes. That’s CRAZY low.
Animal Kingdom is the only park that was still slightly difficult to tour this week. It even managed to go up to a crowd level 6 once, and crowd level 4 three different times. It has such low capacity that it’s difficult for wait times to really drop too low.
Performance of Crowd Level Predictions
Each week, I give you a very transparent look into how the TouringPlans crowd level predictions performed. Each day at each park is one data point, so each week we have 28 different crowd level predictions to evaluate. Any time a prediction is within one or two crowd levels, things won’t really “feel” much different than what was predicted. Being off by 3 or more crowd levels is where you might feel that difference in wait times throughout the day.
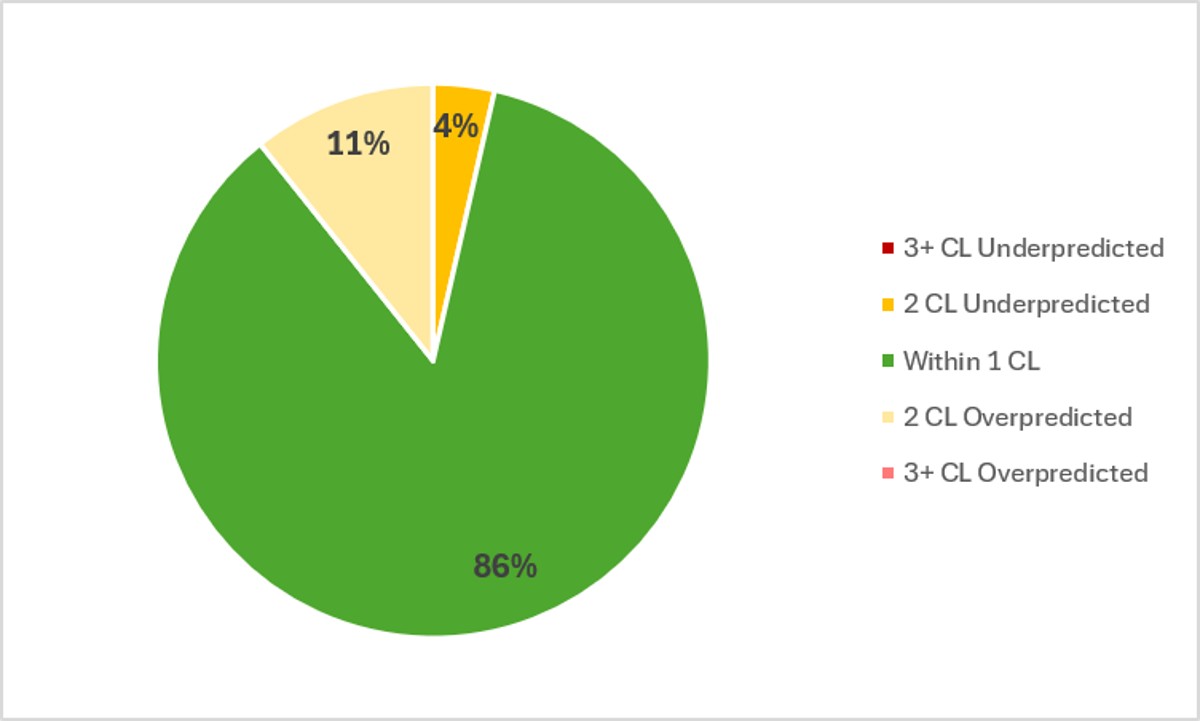
In the past week, Touring Plans predictions were either spot-on or within 1 crowd level 86% of the time, which is a much better result than we’ve been seeing so far this year. And 100% of the time Touring Plans predictions were within 2 crowd levels, so that’s a very rare A+ on predictions for the last week! The middle of August is expected to have low crowds, and we got low crowds. Huzzah! This week, we don’t even need to talk about the biggest misses, because everything was within 2 crowd levels.
Attraction Downtime August 11 – 17
If we average all of the capacity lost due to unexpected downtime over the past week, it comes out to 5.6% of attractions unexpectedly being down. This is still slightly above our “normal” WDW summer average. Over the past week, EPCOT was the park with the worst overall downtime, averaging 8.3% of its capacity lost to downtime. All other parks were at 5% downtime or less. So it was a terrible week for downtime at EPCOT and a pretty decent week everywhere else.
The worst day for attraction downtime in the past week was on August 14th. On that day, 7% of all capacity at WDW was lost due to unexpected downtime. And the worst park-day of the past week was a predictable combination of our worst day and worst park – on the 14th at EPCOT, when 14% of that park’s capacity was lost due to unexpected downtime. EPCOT was open for 12 hours on the 14th, so 14% downtime is the equivalent of the entire park shutting down for more than 100 minutes. That’s a lot of downtime spread throughout a big park.
Attraction Downtime Worst Offender
Our summer-long “champion” of this category has been dethroned, at least for this week (it’s Test Track, and it’s still in second place for most overall downtime this week). Instead, Spaceship Earth ran away with the competition this week for the highest unexpected downtime. Unfortunately, Spaceship Earth was unexpectedly down for 41% of its operating hours. That’s a HUGE number, and it absolutely has a major impact on wait times at EPCOT. It’s definitely a big part of the overall downtime issues at EPCOT this week, because it’s such a popular and high-capacity attraction. Good thing some major love (refurbishment) was semi-announced for Spaceship Earth at D23 this weekend!

Rope Drop Downtime
Here are problematic offenders from the past week, with the percentage of downtime during the first hour of the day in parentheses:
- Magic Kingdom: Pirates of the Caribbean (23%), Under the Sea (15%), Mad Tea Party (12%)
- EPCOT: Spaceship Earth (20%)
- Hollywood Studios: Rock’n’Roller Coaster (14%)
- Animal Kingdom: No rope drop downtime issues this week!
What a weird and wonderful week for rope drop downtime! All of our typical repeat offenders are missing from the list?! No Space Mountain, no Seven Dwarfs, no Rise of the Resistance, no Slinky Dog Dash, no Test Track. Hooray!
Instead, we get Pirates and Spaceship Earth and Rock’n’Roller Coaster. Not great, but certainly better than the other headliners that usually appear.
Wait Times August 11 – 17
Attractions with the Highest Average Posted Wait at Each Park
- EPCOT: Cosmic Rewind, average posted wait of 69 minutes (was 82 minutes last week)
- Magic Kingdom: TRON, average posted wait time of 56 minutes (was 71 minutes last week)
- Hollywood Studios: Slinky Dog Dash, average posted wait of 55 minutes (was 68 minutes last week)
- Animal Kingdom: Flight of Passage, average posted wait time of 51 minutes (was 61 minutes last week)
This is a fun one to look at, since last week was the most crowded week of summer and this week is the least crowded week of summer. You can see that there are differences. But they’re not crazy differences. Drops of at least 10 minutes week-to-week at every headliner does make a large difference in your touring day. But it’s not the difference between Christmas and summer.
There were only two attractions this week where the average posted wait was over an hour – Cosmic Rewind and Test Track (61 minutes). Everything else at WDW was under an hour. That’s an incredible week.
Parks with the Highest and Lowest Average Wait
- Highest: Hollywood Studios, average park-wide posted wait of 33 minutes (was 37.5 minutes last week)
- Lowest: Magic Kingdom, average park-wide posted wait of 18.5 minutes (was 23 minutes last week)
Those wait time drops are obvious at the park level too. FWIW, EPCOT and Animal Kingdom both had park-wide averages of roughly 25 minutes. No parks were crowded at all. But a result under 20 minutes at Magic Kingdom is next-level bonkers. And drops of ~5 minutes in the park-wide average at every park makes a HUGE difference when you’re trying to tour the park efficiently.
Most Inflated Posted Wait Times
We all know that Disney inflates their posted wait times on purpose. They have many reasons for doing this. Some are totally understandable, and some are potentially more problematic. We can figure out how much posted wait times are being inflated by comparing submitted actual wait times from the Lines App and the posted wait time when the person timing their wait entered the line.
Over the past week, actual wait times in the Lines App averaged 73% of what was posted. That’s pretty close to our historical average in the era of Lightning Lanes. Overall, if the posted wait time at a popular attraction was 60 minutes, you could’ve expected to wait less than 44 minutes instead.
But the worst inflation offender for the past week was (once again) Gran Fiesta Tour. At this one attraction, submitted actual wait times were only 20% of posted wait times in the past week. That means that if Gran Fiesta Tour had a 10 minute posted wait, you probably would have actually only waited 2 minutes instead. A fifth of what was posted! Probably what actually happened was that Gran Fiesta Tour ran a 5 minute posted wait for most of the week (because it can’t post less than that), and almost everyone just walked right on. Remember to always check the Lines app for predicted actual waits instead of making decisions based on what is posted.

This Week’s Wait Time Rock Star
Between August 11th and 17th, we had just under 1500 timed actual waits submitted through the Lines app. And the person who recorded the most actual waits during that time was QueenofHearts, with 46 overall timed waits – 33 Lightning Lane waits, 12 standby waits and 1 single rider wait. Thanks for all of that timing, QueenofHearts! It unfortunately does not compete with the the 97 timed waits in a single week from our current timing champion, preef.
Looking Ahead: August 18 – 24
I write this article on Tuesday evenings so that you all have the very freshest of data on Wednesdays. That means the 18th will already be in the past by the time you’ve read this, so congratulations on conquering time travel!
There is nothing in the upcoming week that should majorly shift overall crowd levels away from the glorious results of this week. Schools are heading back into session across the country, and no major events are kicking off until the following week (oh hey, Food & Wine).
But at the park-by-park level, we do have a pretty big shift happening this week. We go from very sporadic Halloween parties at Magic Kingdom, to a season where they are sometimes happening every other day. When parties become that frequent, it exaggerates party day/non-party day behavior, and nights get REALLY crowded at Magic Kingdom when it’s open, and mornings get REALLY uncrowded at Magic Kingdom on those more-frequent party days. This week, there are parties on the 18th, 21st, and 23rd (with another following quickly on the 25th). So expect more crowds than you might otherwise expect in this uncrowded season at Magic Kingdom on the evenings of the 22nd and 24th.
‘Tis also the season for heat and humidity and afternoon thunderstorms. Still. Expect highs in the low 90s, but feels-like temperatures up in the triple digits, and at least a passing shower or storm during the day. Be prepared for the heat and the rain!
Were you in the parks this past week? Or are you headed to Orlando soon? Let me know in the comments below!
You May Also Like...
-

It was the summer-est of times, it was the fall-est of times. Because this week brought us one of the “most…
-

After two months of unusually low summer crowds, Walt Disney World finally remembered that August can, occasionally, attract people. Crowd levels…

Gran Fiesta Tour has low wait times almost all year round at this point. A retheme to CoCo is right there, Disney!