Disney Data Dump January 11 2023
After all of the excellent news coming from Disney yesterday, I think we all just need a minute to do a happy dance. Right? Right. Okay, step away and dance, I’ll be here when you get back. We good now? I’m speculating that bookings were very soft for 2023 – there has been increased advertising, new deals, and now this huge tome of opening dates and big news. Disney wants you to come to Walt Disney World and Disneyland. We’ll see how that impacts crowd levels later this spring and early in the summer. But for now let’s look back and go over the data from this past week.
Observed Crowd Levels 1/3 – 1/9

January, coming in hot! Those early days of January were a bit more crowded than expected. Usually we see things come down from the between-Christmas-and-New-Year high. And instead they actually ticked back up a little. And don’t let that lone little green bar throw you off – that’s marathon day. Park hours get messed up, transportation gets mess up, a lot of tired people don’t care about doing attractions later in the day. We always expect that specific day to have pretty low wait times. But you’ll have a hassle getting to and around the parks that may not be “worth” any time savings if you stress out about that sort of thing.
Note: Initial After Hours Event Data
I’ve gotten several questions about the “new” After Hours events at Hollywood Studios and Magic Kingdom over the past couple of weeks. The most popular questions are:
- Will parks be uncrowded on those days since they close a little early-ish? Sorta like party days?
- Will you be writing up strategies for After Hours events?
The answer to the first question is no. The parks don’t close early enough compared to surrounding days to discourage people from attending. In fact, After Hours doesn’t force Hollywood Studios to close any earlier than it normally does, and at Magic Kingdom, it only shift closing time for day guests from 11 pm to 10 pm. No big deal. Hollywood Studios was a crowd level 10 (predicted 9) on the day of its first event, and Magic Kingdom was a crowd level 8 (predicted 6) on the day of its first event.
The answer to the second question is yes. Stay tuned to the blog for the Magic Kingdom After Hours strategy soon, with the Hollywood Studios to follow sometime after I get back from my cruise. In general – there will be very minimal waits. Ticket sales were capped at 3000 tickets, and 3000 people spread throughout the park is not many. We were seeing minimal posted wait times during the event, and many empty queues.

Each week, I’m giving you a very transparent look into how our crowd level predictions performed. Each day at each park is one data point, so we have 28 different crowd level predictions to evaluate each week. Any time a prediction is within one or two crowd levels, things won’t really “feel” much different than what we predicted. Being off by 3 or more crowd levels is where we’d like to be more accurate because you might feel that difference in wait times throughout the day.
In the past week, our predictions were either spot-on or within 1 crowd level 79% of the time. This ties an all-time high! These were skewed pretty heavily to underpredicting by 1 crowd level, but a miss by 1 is still pretty good. 96% of the time we were within 2 crowd levels, and that means we earn an A for our predictions this past week. Highest score ever. Our biggest miss of the week was at EPCOT on January 7th, when we overestimated by 3 crowd levels. We predicted an 8, and it ended up being a 6. Overall, WDW was a crowd level 7 that day, so EPCOT was just under the resort average.
Attraction Downtime 1/3 – 1/9
If we average out all of the capacity lost due to unexpected downtime over the past week, it comes out to 3% of attractions unexpectedly being down. This is close to our historic low since we started tracking the metric in these posts, and matches exactly what we saw last week. The park with the biggest issues was Magic Kingdom, with 3.6% of capacity its lost due to unexpected downtime. This is slightly up from last week, but still really not bad compared to what we’ve seen in the past.
The worst day for attraction downtime in the past week was on January 9th. On that day, 5% of all capacity at WDW was lost due to unexpected downtime. The single worst park-day of the week was also on January 9th, at Magic Kingdom. On that day, 10% of the the capacity at that park was lost due to unexpected downtime. Magic Kingdom was open for 14 hours on that day (before After Hours started), so 10% downtime is the equivalent of the whole park being down for 84 minutes – almost an hour and a half. This may have impacted the crowd level at Magic Kingdom, which was expected to be an 6, but ended up being an 8 instead.
Attraction Downtime
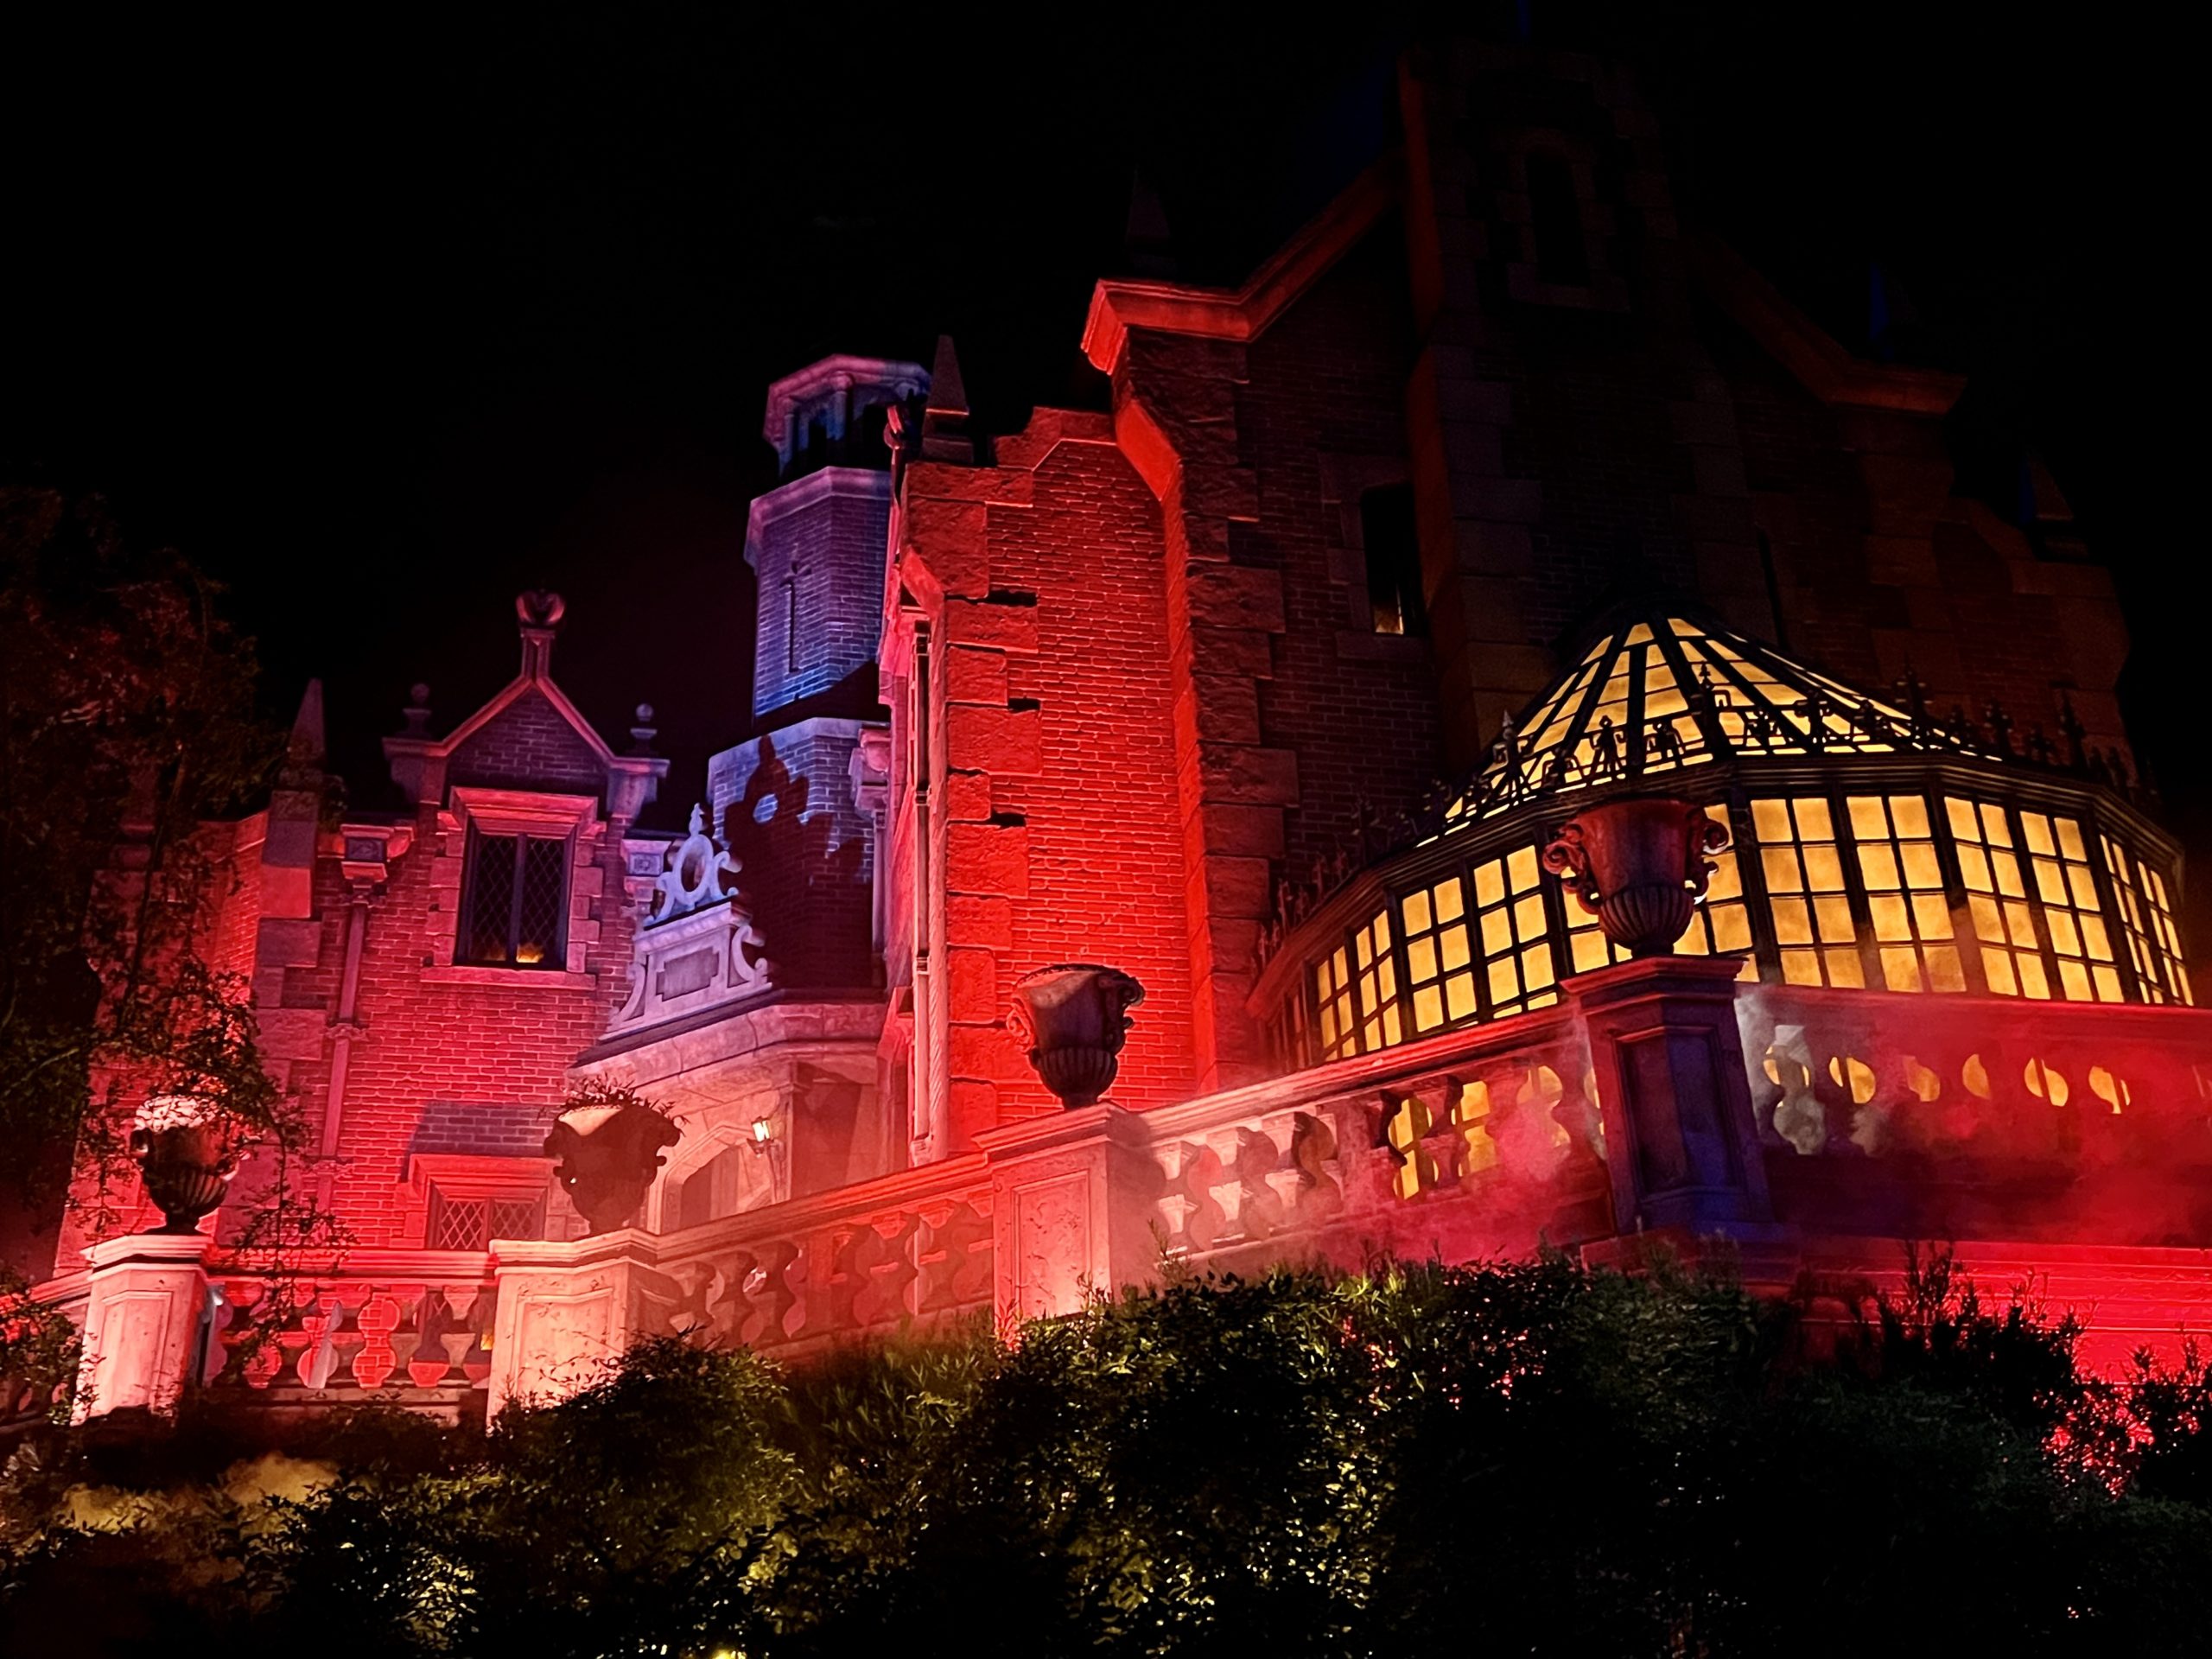
The worst offender was the Haunted Mansion, which was unexpectedly down for approximately 15% of the week. Its worst day was easily January 9th, when it was unavailable for 79% the park day. On that day, the Haunted Mansion didn’t come up in the morning, and wasn’t available reliably until about 7:30 pm. After that, it remained open for the rest of normal operating hours and the After Hours event. At least Haunted Mansion is spookier in the evening anyway.
Rope Drop Downtime
Here are this week’s problematic offenders:
- Magic Kingdom: Splash Mountain (unavailable for 28% of its first hour of the day), Haunted Mansion (unavailable for 21% of its first hour of the day), TTA PeopleMover (unavailable for 14% of its first hour of the day)
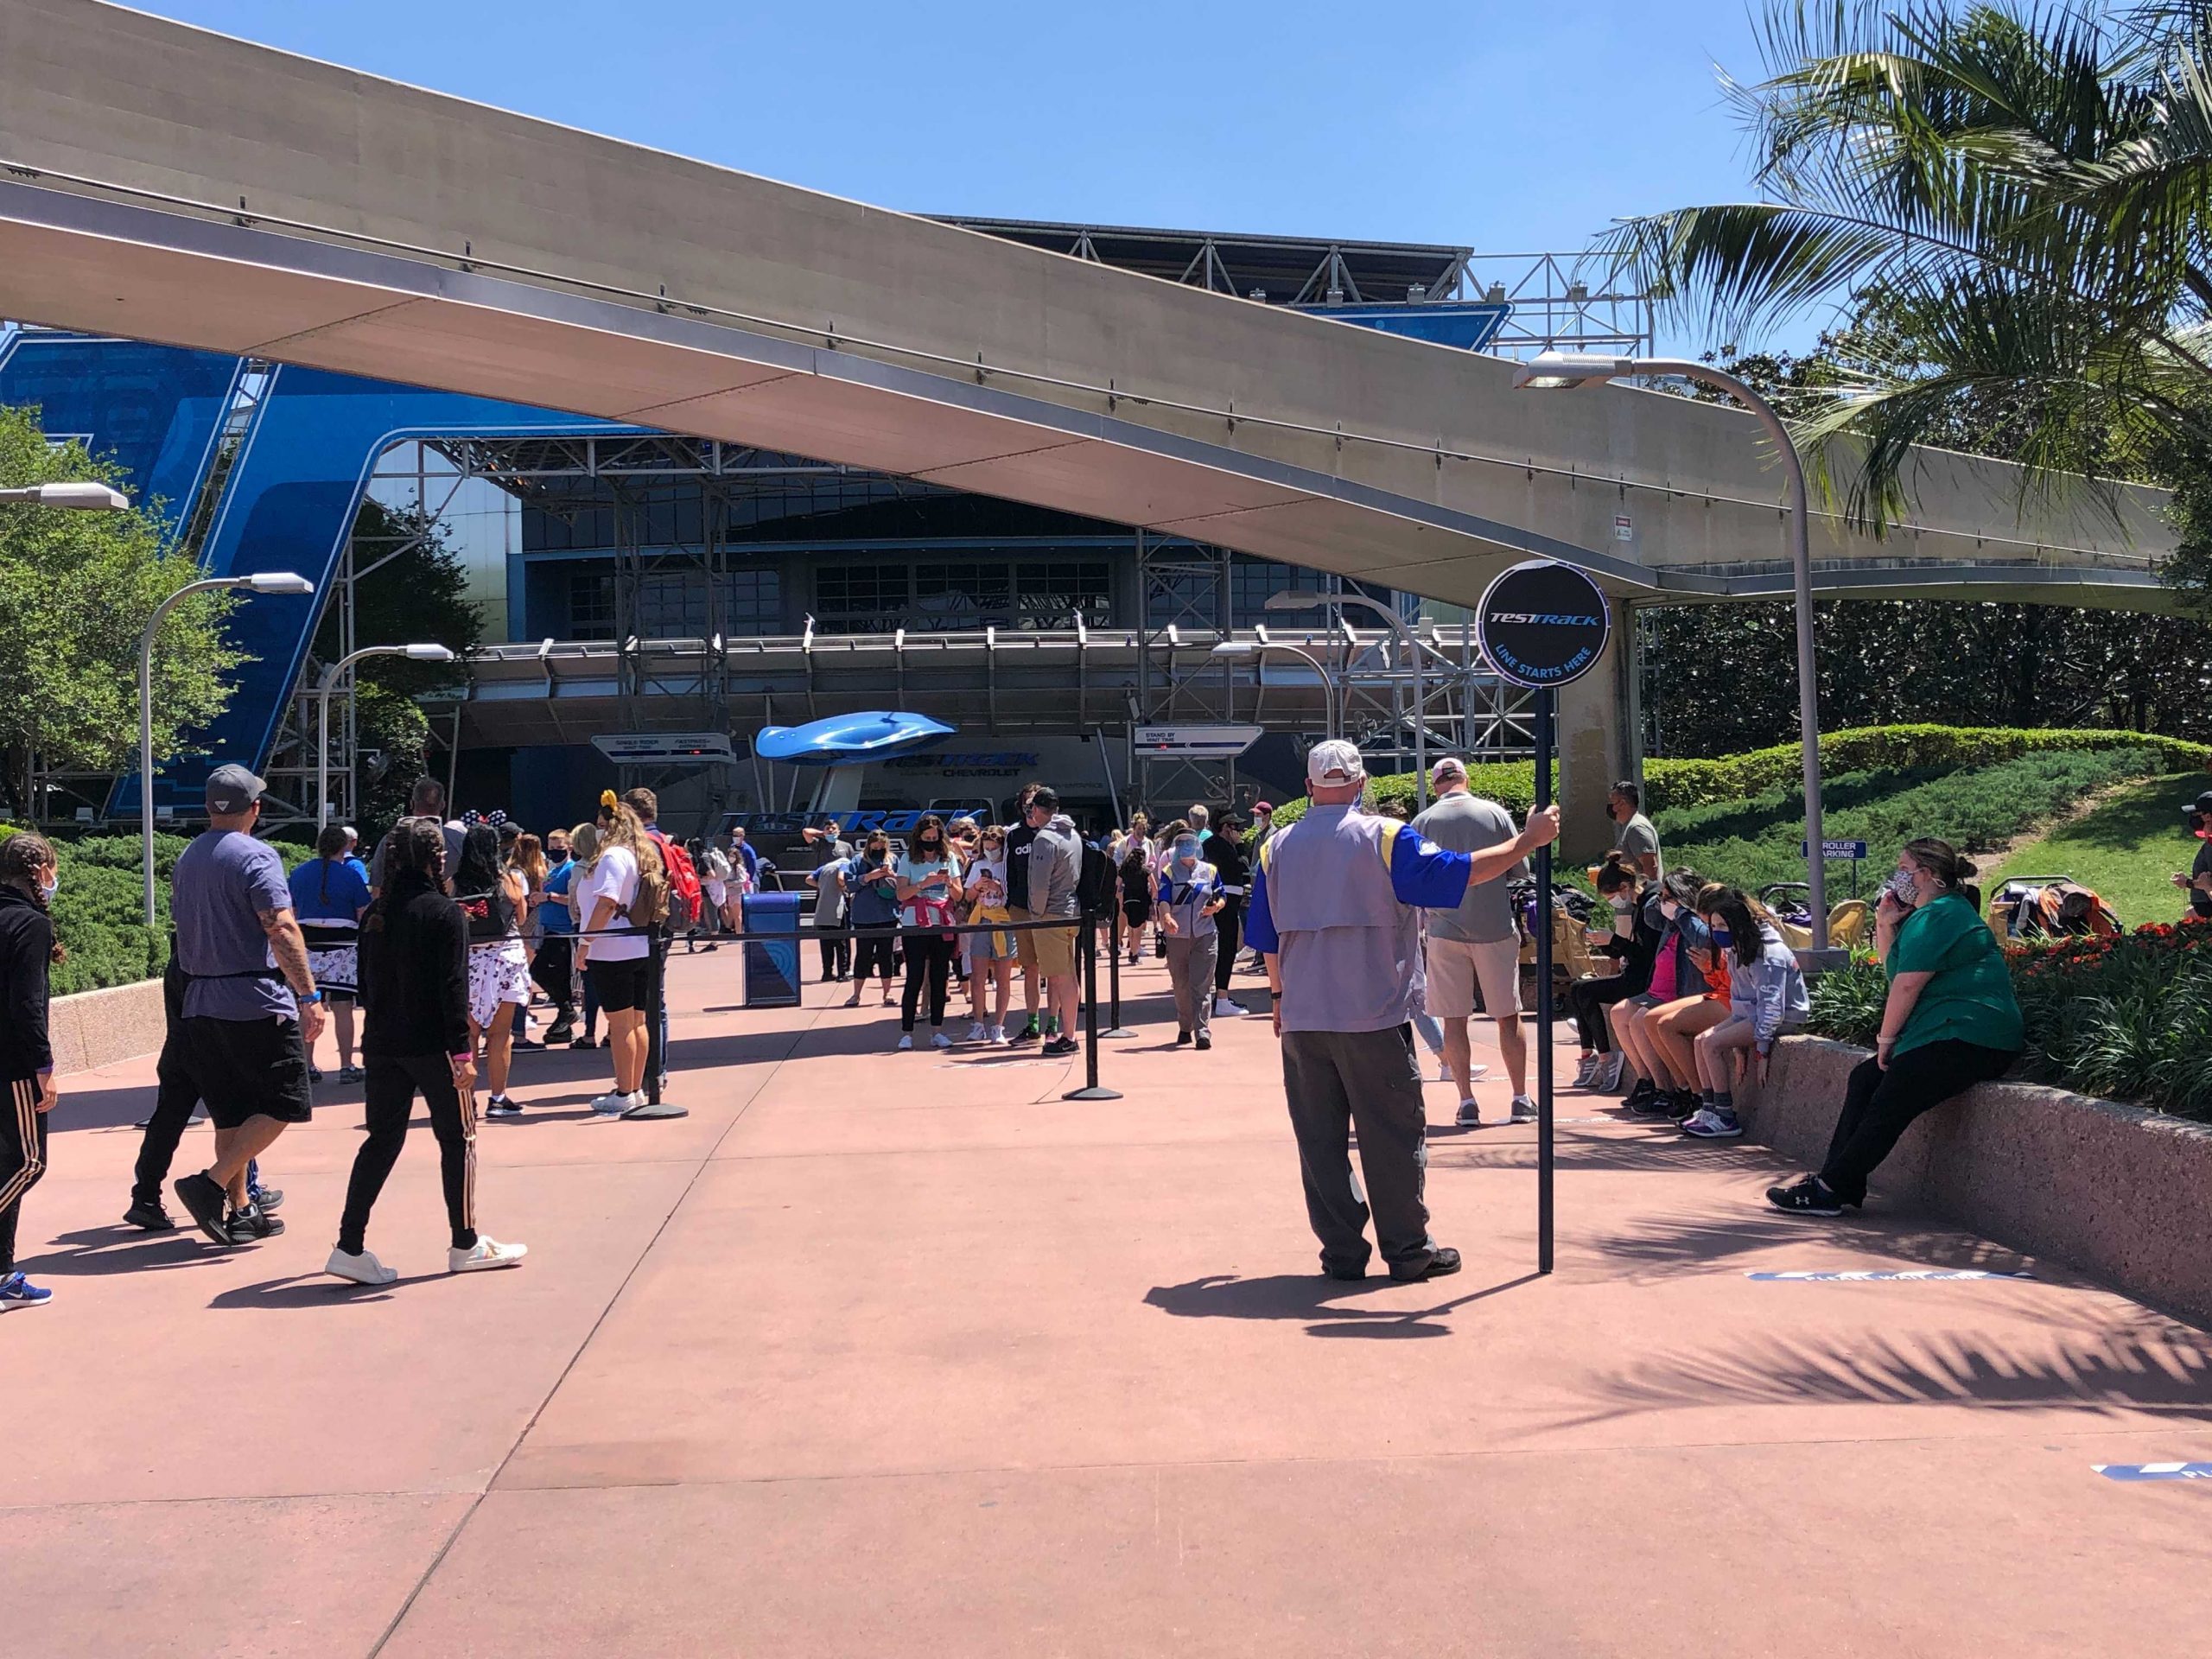
- EPCOT: Test Track (unavailable for 29% of its first hour of the day)
- Hollywood Studios: Rise of the Resistance (unavailable for 18% of its first hour of the day), Runaway Railway (unavailable for 15% of its first hour of the day)
- Animal Kingdom: No first-hour issues!
Ah, the return of some of our reliable favorites. Test Track and Rise of the Resistance are back on the list, after having a reprieve last week. Splash Mountain is back to struggling to get up in the morning, even as people scramble to have their last ride. And PeopleMover’s issues from last week haven’t quite fixed themselves this week.
The only major touring problems this week would be rope-dropping EPCOT from the Main Entrance (International Gateway is still the way to go, if you can ride the Skyliner or stay at a Crescent Lake resort), and hopping into line at Rise of the Resistance at Hollywood Studios. Have a backup plan for either of those two headliners since they show up so often.
Wait Times 1/3 – 1/9
Attractions with the Highest Average Posted Wait at each park
- Hollywood Studios: Tower of Terror, average posted wait of 128 minutes (135 minutes last week)
- Animal Kingdom: Flight of Passage, average posted wait time of 147 minutes (180 last week)
- EPCOT: Remy’s Ratatouille Adventure, average posted wait time of 100 minutes (117 last week)
- Magic Kingdom: Seven Dwarfs Mine Train, average posted wait time of 100 minutes (103 last week)
Well, the good news is that things are mostly better than last week. The crowd level 4 wait times on January 8th certainly helped bring these averages down. But these wait times are still WAY above average and show that the holiday crowds have been sticking around (or trading out with the marathon crowds). There was a rumor going around last week that Tower of Terror had finished its stealthy refurbishment, but the wait times dispute that rumor.
Parks with the Highest and Lowest Average Wait
These parks likely won’t change week-to-week unless something ridiculous happens, but these data points will give us a high-level view of how wait times are trending from week to week.
- Highest: Hollywood Studios, average park-wide posted wait of 58 minutes (last week 63 minutes)
- Lowest: Magic Kingdom, average park-wide posted wait of 31 minutes (last week 33 minutes)
The good-ish news continues here. The average posted wait at Hollywood Studios back under an hour (barely). And its posted average exactly matches what we saw two weeks ago, which was still a very crowded week. Magic Kingdom also saw a drop, but is more crowded than it was two weeks ago.
Most Inflated Posted Wait Times
We all know that Disney inflates their posted wait times on purpose. They have many reasons for doing this. Some are totally understandable, and some are potentially more problematic. We can figure out how much posted wait times are being inflated by comparing submitted actual wait times from the Lines App and the posted wait time when the person timing their wait entered the line.
From January 3rd through 9th, actual wait times in the Lines App averaged 64% of what was posted. By the way, this number has been steady for the past 3 weeks. So if the posted wait time was 20 minutes, you could’ve expected to wait just under 13 minutes instead.
But the worst offender for the week was Peter Pan’s Flight. At this one attraction, submitted actual wait times were only 45% of posted wait times, which means that if Peter Pan’s Flight had a 60 minute posted wait, you probably would’ve waited just 27 minutes. Less than half of what was posted. Remember to always check the Lines app for predicted actual waits instead of believing what is posted.

Actual Wait Time Rock Star
The Actual Wait Time Rock Star for this past week was nncybry, who submitted 33 wait times through the Lines App over the last 7 days. This includes 19 Lightning Lane waits, 12 Standby waits, and 2 Virtual Queue waits. Thanks for your hard work, nncybry!
mbcollins still holds our “all-time” record (for all of the past 2 weeks) here, with 41 actual wait times submitted between December 27th and January 2nd.
In the next week, we could especially use standby wait times for the WDW Railroad stations in Magic Kingdom. They’ve been seeing totally unprecedented demand (because they’re awesome), and Disney doesn’t post wait times for them, so we need ALL of the actual wait times we can get.
Looking Ahead: January 10th through 23rd
Since it takes time to pull data and write a post, you’ll be reading this on the 11th when the 10th is already in the past. But we’re staying as close to real-time as possible.
You didn’t read those dates wrong – my family will be cruising in the Caribbean next week for Marvel Day at Sea. So your next Disney Data Dump won’t be until January 25th. Never fear! If you miss me, just give me a follow (@raisingminniemes) on Instagram and you can see all of the fun we get up to on our cruise. It’s Marvel Day at Sea, my husband and I have our first-ever Remy dinner booked, we’re stopping at Castaway Cay and Cozumel, and it’s all going to be amazing.
Okay, but what about those of you headed to Walt Disney World in the next two weeks? We’ve got a long weekend coming up, and that usually means a slight bump up in crowds. The kiddos in our family have a 4.5-day weekend, and I know a lot of families are in a similar situation across the country. So MLK weekend may be up in the 7/8/9 range at some parks. Otherwise, we should hopefully be going back to a more steady 5/6/7 cadence for the rest of January.
Remember that Splash Mountain’s last day of operations is January 22nd. There will likely be some increase in wait times at that attraction leading up to its last day as people try to fit in “one last ride” on a classic. Of less importance, the Frozen Sing-Along Celebration is closed at Hollywood Studios through January 27th. This removes some capacity from that already-troubled park.
Evenings should start getting more pleasant as the full slate of evening entertainment and special events spreads crowds out. Nighttime spectaculars are running at Magic Kingdom, EPCOT, and Hollywood Studios. And, as an example, on January 16th there are Extended Evening Theme Park Hours at EPCOT and After Hours at Magic Kingdom. Similarly, January 18th sees Extended Evening Theme Park Hours at Magic Kingdom and After Hours at Hollywood Studios. If you are eligible for EETPH or buy tickets to After Hours, those are the lowest wait times of any park on any day. Take advantage of them!
You May Also Like...
-

Welcome to 2023, Disney data friends! A time for setting goals and dreaming big dreams. A time for reviewing where we've…
-

New blog series, who dis? We know that you come to TouringPlans because of all of our data. And other than…
-

Welcome to December, Disney data friends! The Festival of Holidays is in full swing, along with the Candlelight Processional. Fantasmic continues…
-

Holy crowds, Batman! Spiderman? Fall is here, and so are the beginnings of October crowds, ramping up into the holiday seasons…
I attended after hours Hollywood Studios on January 11th which I believe was a sold out event. I arrived at the park around 9:05pm Walk on’s were Toy Story Mania, Star Wars Rise of Resistance, Mickey & Minnie’s Runaway Railway. I waited 8 mins for Slinky Dog, 20 minutes for Tower of Terror. I did not ride the other rides. I did get free ice cream, popcorn, and bottled drinks and left around 11:30pm. Did not seem crowded at all. Very enjoyable and worth every penny!
Nancy, thank you so much for sharing your experience! It confirmed my hopes. And I’m glad you enjoyed your evening 🙂