
Disney Data Dump July 8 2026
If crowds were going to show up for summer, surely it would’ve been over the July 4th holiday weekend. Instead, we got the least-crowded Independence Day stretch in FIFTEEN YEARS. Low crowds are officially the story of the summer, and they’ll stay that way for the next two-ish months.
That doesn’t mean everything was smooth sailing, though. In fact, one set of numbers this week was about as bad as we’ve ever seen in the history of the Data Dump, while another was surprisingly excellent. It’s a very strange combination of results this week. Let’s look through it together!
Observed Crowd Levels June 30 – July 6
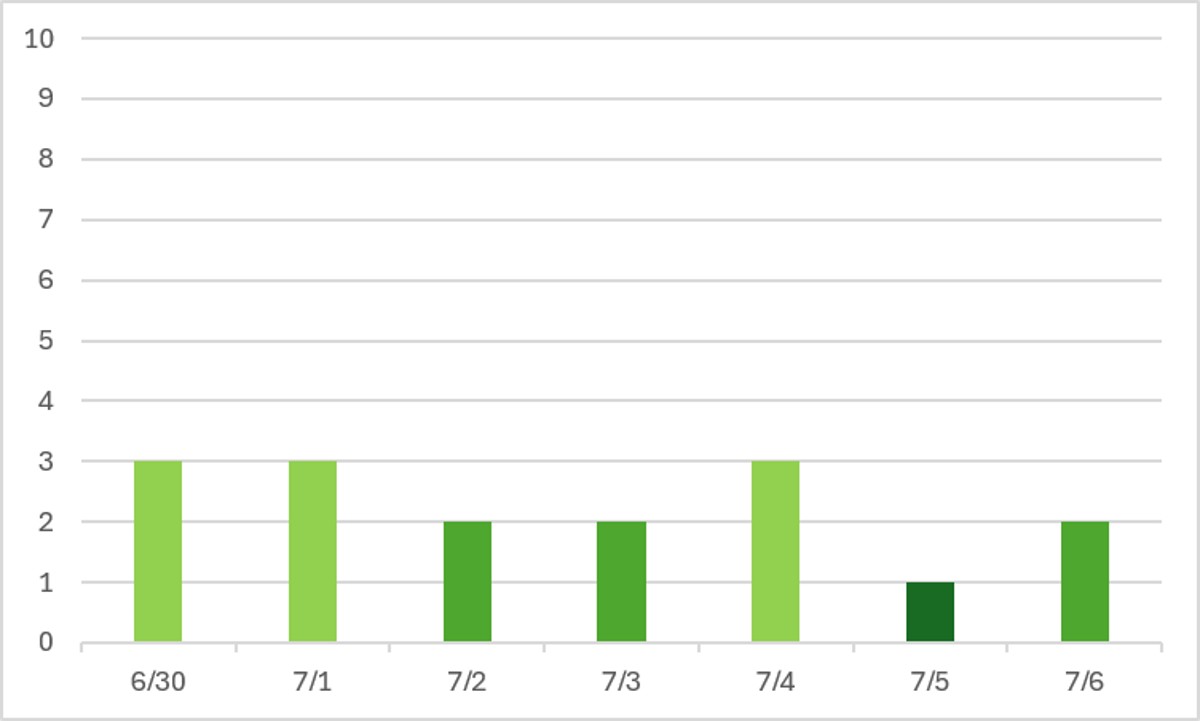
I got to use the very rare crowd level 1 color from my crowd level column graph color palette! I call this out last week – July 5th over the past few years is one of the statistically least crowded days of the year. Too many people recovering from late-night fireworks and ‘Murica birthday partying. Otherwise, no big holiday weekend crowds appeared, as expected.
To be clear – this does not mean that fireworks were uncrowded. Reservations for EPCOT and Magic Kingdom were gone on the 4th because everyone did show up for fireworks. But they were only there for fireworks. These weren’t normal guests touring the parks, which is what our crowd levels (based on wait times) measure.
As measured by wait times and crowd levels, this was the least-crowded 4th of July (as measured by July 3 – July 5) since 2011! I made that same claim last year, and it was shocking, but this year was even lower. That’s the story of this summer.
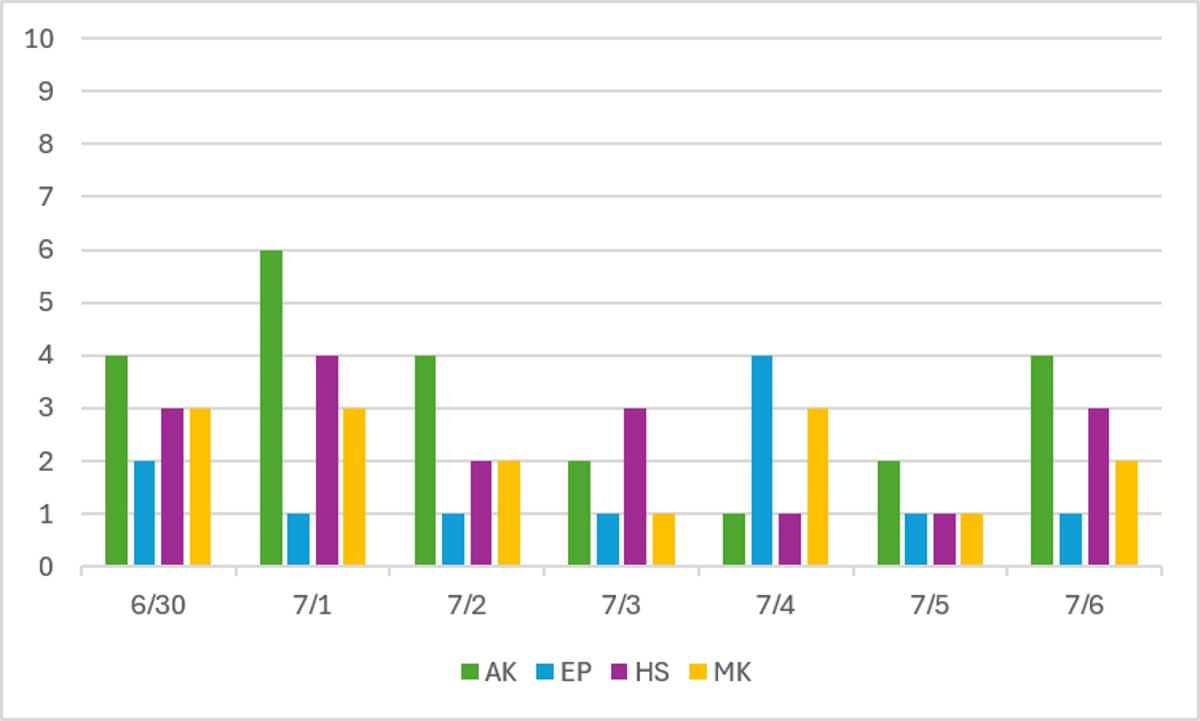
Even with very low crowds, there are some interesting trends when we break it down by park. Once again, Animal Kingdom had the spikiest crowds thanks to its low overall ride capacity. EPCOT and Magic Kingdom were the most crowded on the 4th, but the least crowded on the 3rd and 5th (when both were still offering their July 4th fireworks!). There have been continued downtime issues that are increasing wait times at attractions that remain open – more on that later – but generally these are great results for anyone who wants low waits in the parks.
Performance of Crowd Level Predictions
Each week, I give you a very transparent look into how the TouringPlans crowd level predictions performed. Each day at each park is one data point, so each week we have 28 different crowd level predictions to evaluate. Any time a prediction is within one or two crowd levels, things won’t really “feel” much different than what was predicted. Being off by 3 or more crowd levels is where you might feel that difference in wait times throughout the day.
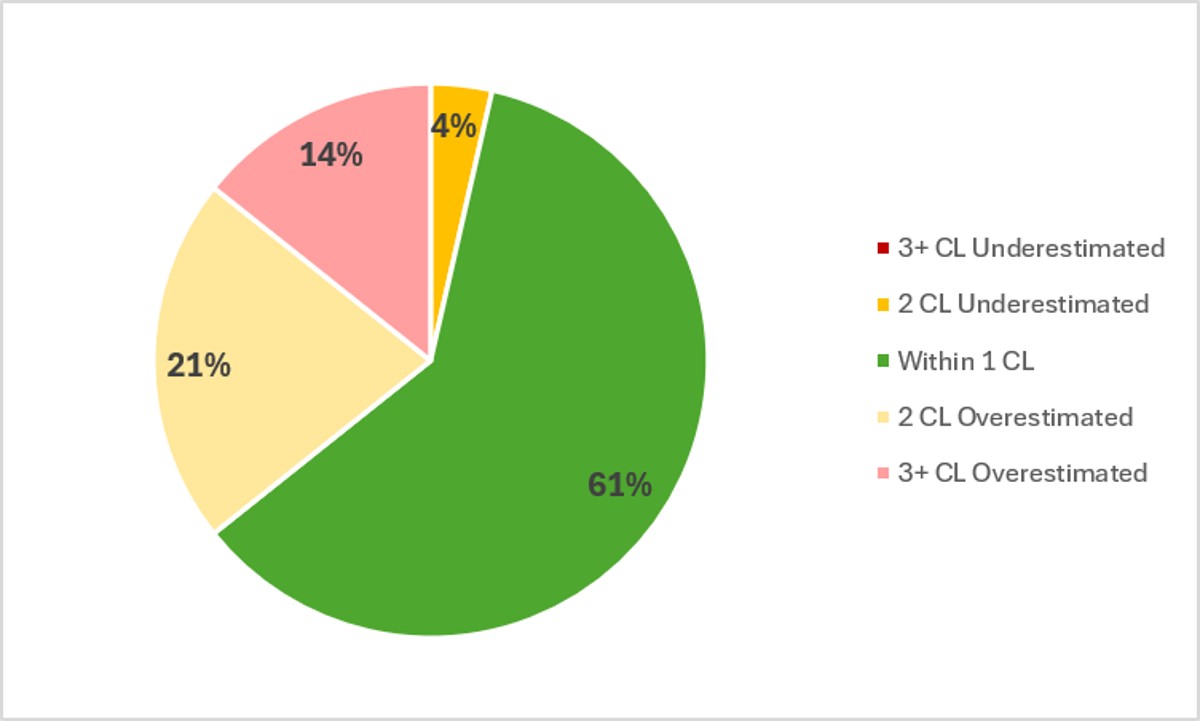
In the past week, Touring Plans predictions were either spot-on or within 1 crowd level 61% of the time, which is slightly higher than the last two weeks. And 86% of the time Touring Plans predictions were within 2 crowd levels, so that’s a B on predictions for the last week. As we get further into the summer, crowd levels still aren’t keeping pace with predictions that were already low, and were even adjusted lower once this summer. There was one underprediction by two crowd levels, which happened at Animal Kingdom on the 1st, when it spiked up to a crowd level 6. But the biggest miss of the week was an overprediction by FIVE crowd levels, which happened at EPCOT on the 3rd, when it was predicted to be a crowd level 6 and only ended up at a 1. EPCOT has been underperforming on crowd level all summer. In the past week, the crowd level averaged 2.1 crowd levels lower than predicted.
Attraction Downtime June 30 – July 6
If we average all of the capacity lost due to unexpected downtime over the past week, it comes out to 8% of attractions unexpectedly being down. Last week I called out the 7.7% downtime result as an all-time record, and then this week comes in even higher! And over the past week, Animal Kingdom was yet again the park with the worst overall downtime, averaging 11% of its capacity lost to downtime. That’s exactly the same as last week. This was a second week in a row of truly awful downtime that happened all across every park.
To put it in perspective, any time any park day has 5% or more downtime, you’ll likely “feel” it during your day. This week, out of 28 park days, there were only 6 with less than 5% downtime. On the other hand, 13 different park days had 10% or more downtime. At that point you’re losing hours of touring time and you’re probably running into multiple headliners being down when you want to ride them. Summer downtime is always bad thanks to weather, but this is much worse than what we normally see.
The worst day for attraction downtime in the past week was on June 30th. On that day, 14% of all capacity at WDW was lost due to unexpected downtime. That’s again one of the worst “winning” numbers we’ve ever seen here on the Data Dump. And the worst park-day of the past week was a combination of our worst park and worst day – at Animal Kingdom on the 30th, when 24% of that park’s capacity was lost due to unexpected downtime. A quarter of planned capacity! Animal Kingdom was open for 11 hours on the 30th, so 24% downtime is the equivalent of the entire park shutting down for 158 minutes. That’s over 2.5 hours of an 11 hour day! Imagine showing up to Animal Kingdom to have your full park day, but then Disney suddenly announces at 4:22 pm that they’re closing immediately rather than staying open until 7 like they had advertised. From a capacity standpoint, that’s what happened on the 30th.
Attraction Downtime Worst Offender
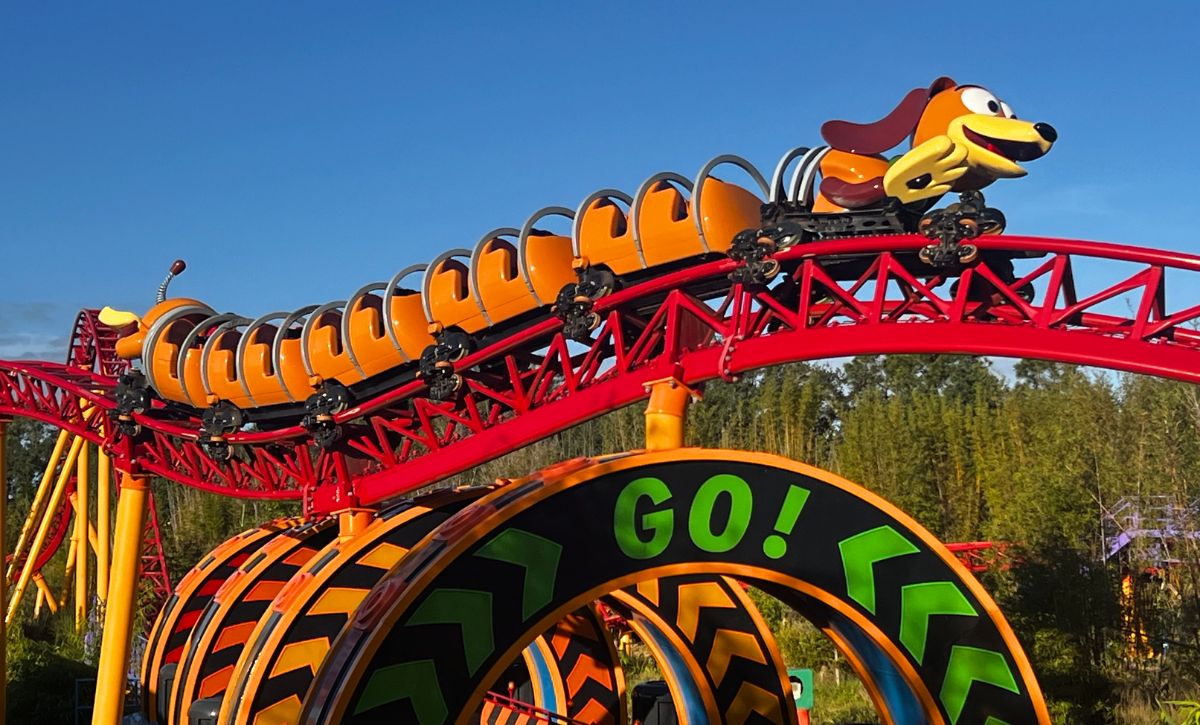
For perhaps the first time ever, we have a tie for worst downtime percentage for the week! I even went down to the thousandth of a percentage point to try to break the tie, but the results were still exactly the same. In the past week, Test Track and Slinky Dog Dash both had the worst overall downtime. That’s the FIFTH week in a row for Test Track. Both attractions were unexpectedly down for 33% of the past week. That result is higher than any of Test Track’s previous “winning” numbers, and it’s way out of the normal downtime range for Slinky Dog Dash. Keep in mind, this means that both of these important headliners missed a third of the week. It’s like they were shut down for more than two full days!
The worst day of the past week at Test Track was on June 30th, when the attraction was down for 59% of the day. But it was also down for 56% of the 6th. And over at Slinky Dog Dash, the worst day was on July 4th, when it was down for 50% of the day. But it was also down for 46% of the 3rd and 45% of the 6th.
Last week there were 4 attractions with over 20% downtime for the week (Test Track, Kali River Rapids, Expedition Everest, and Slinky Dog Dash). This week, all four of those attractions were still over 20% downtime, and Big Thunder Mountain Railroad joined them.
Rope Drop Downtime
Here are problematic offenders from the past week, with the percentage of downtime during the first hour of the day in parentheses:
- Magic Kingdom: Seven Dwarfs Mine Train (17%), Haunted Mansion (16%)
- EPCOT: Test Track (34%), Remy’s Ratatouille Adventure (17%), Journey Into Imagination (12%)
- Hollywood Studios: Slinky Dog Dash (19%), Rock’n’Roller Coaster (16%), Tower of Terror (15%)
- Animal Kingdom: Kali River Rapids (11%)
Look. These results are weird in the context of one of the worst downtime weeks ever. Because this is one of the best (aka shortest) rope drop downtime lists we’ve seen in a very long time. TWO attractions at Magic Kingdom? NINE attractions total? We’ve been easily doubling that so far this summer. Now, a bunch of headliners still had issues. But this isn’t a terrible list.
Wait Times June 30 – July 6
Attractions with the Highest Average Posted Wait at Each Park
- EPCOT: Test Track, average posted wait of 72 minutes (was 71 minutes last week)
- Hollywood Studios: Slinky Dog Dash, average posted wait of 68 minutes (was 67 minutes at Rock’n’Roller Coaster last week)
- Magic Kingdom: TRON, average posted wait time of 61 minutes (was 63 minutes last week)
- Animal Kingdom: Flight of Passage, average posted wait time of 53 minutes (was 59 minutes last week)
I had one lady on Instagram this week who slammed my claims of low crowds by saying that headliner waits were all over 30 minutes. So let me clarify here … I don’t think we’d see headliner waits under 30 minutes unless a hurricane was imminently hitting Orlando but somehow the parks were still open. Even dipping under an hour is extremely rare. But having only 4 attractions in all parks averaging a posted wait of over an hour is crazy-good (Rock’n’Roller Coaster was the fourth one). And these are day-long, posted waits. Actual waits are likely lower, and so are waits early in the morning and late in the evening.
Parks with the Highest and Lowest Average Wait
- Highest: Hollywood Studios, average park-wide posted wait of 29 minutes (was 30.5 minutes last week)
- Lowest: Magic Kingdom, average park-wide posted wait of 19 minutes (was 20 minutes last week)
Let’s keep in mind that these park-wide average waits are in the context of 8% overall downtime for the week! Imagine how much lower they would go if everything was running all of the time! It’s very very very rare for all four parks to have average waits under 30 minutes, but we finally managed to break that barrier for the first time this summer. I expect it to happen again in August and September … unless downtime throws us off.
Most Inflated Posted Wait Times
We all know that Disney inflates their posted wait times on purpose. They have many reasons for doing this. Some are totally understandable, and some are potentially more problematic. We can figure out how much posted wait times are being inflated by comparing submitted actual wait times from the Lines App and the posted wait time when the person timing their wait entered the line.
Over the past week, actual wait times in the Lines App averaged 71% of what was posted. That’s below our historical average in the era of Lightning Lanes, which means that posted wait times were more inflated than normal. Overall, if the posted wait time at a popular attraction was 60 minutes, you could’ve expected to wait less than 43 minutes instead.
But the worst inflation offender for the past week was Gran Fiesta Tour. At this one attraction, submitted actual wait times were only 33% of posted wait times in the past week. That means that if Gran Fiesta Tour had a 15 minute posted wait, you probably would have actually only waited 5 minutes instead. Just a third of what was posted! Remember to always check the Lines app for predicted actual waits instead of making decisions based on what is posted.

This Week’s Wait Time Rock Star
Between June 30th and July 6th, we had just under 1300 timed actual waits submitted through the Lines app. The one person who recorded the most actual waits during that time was PackTheCar, with 36 overall timed waits – 25 Lightning Lane waits, 10 standby waits, and one single rider wait. Thanks for all of that timing, PackTheCar! It unfortunately does not compete with the the 97 timed waits in a single week from our current timing champion, preef.
I love weeks where crowd levels are way down, but timed waits are way up from our average. That means you all are paying attention and going when the crowds are going to be low! That makes my heart happy.
Looking Ahead: July 7 – 13
I write this article on Tuesday evenings so that you all have the very freshest of data on Wednesdays. That means the 7th will already be in the past by the time you’ve read this, so you’re time travelling now!
Now we’re back to the “normal” part of summer. Weirdly, we have less than a month until the first Halloween Party of the year. So it’s basically fall? But we should be in a stretch of reliably low crowds, if downtime doesn’t screw it up for us. No major events or festivals or operating hours changes in the upcoming week, so expect crowd levels in the 2-3 range.
There might be a few sunny days this week?!?! A rarity for this summer, and it should help downtime numbers. But if you’re going to be in the parks, be prepared for intense heat and afternoon storms. Get your outdoor attractions done early!
I’ll be in the parks July 10th-12th with my Little Kid, so be sure to say hello if you see us.
Were you in the parks this past week? Or are you headed to Orlando soon? Let me know in the comments below!
You May Also Like...
-

Remember a few weeks ago when I said summer was off to the slowest start since 2014? Somehow it's gotten even…
-

The big news this week is that after weeks and weeks of crowd level 2s, we finally got a 4. A…

MK was virtually empty early on the 4th and then about 10AM it seemed to get slammed with people in Tomorrowland. Buzz went from walk right on to 60 minutes in about 10 minutes. As info, there was a huge storm late afternoon to approximately 930 on Monday July 6 that would have affected crowds and shut outdoor rides at all the parks.
We were at Disney July 4th and 5th and it was blissfully empty! On July 4th, we did Flight of Passage twice with a 20 min wait!! I would guess the terrible downtime on the 30th was due to the rain storm that lasted almost 7 hours! Florida afternoon storms are common, but they usually don’t last that long. That was the storm that lightning struck Velocicoaster. So pretty much all the outside rides were down that whole afternoon/evening