
Disney Data Dump July 1 2026
Remember a few weeks ago when I said summer was off to the slowest start since 2014? Somehow it’s gotten even quieter. Week after week the data keeps pointing in the same direction, and at this point it’s hard to ignore. If the pattern from the past few years holds, July could end up being even less crowded than June. And with an average crowd level of 2.8 in June, that’s crazy to even imagine.
Of course, low crowds don’t automatically mean smooth park days. This week had one trend that should make anyone planning a summer trip pay close attention, even though the wait times stayed remarkably low overall. Let’s look through the data together!
Observed Crowd Levels June 23 – 29
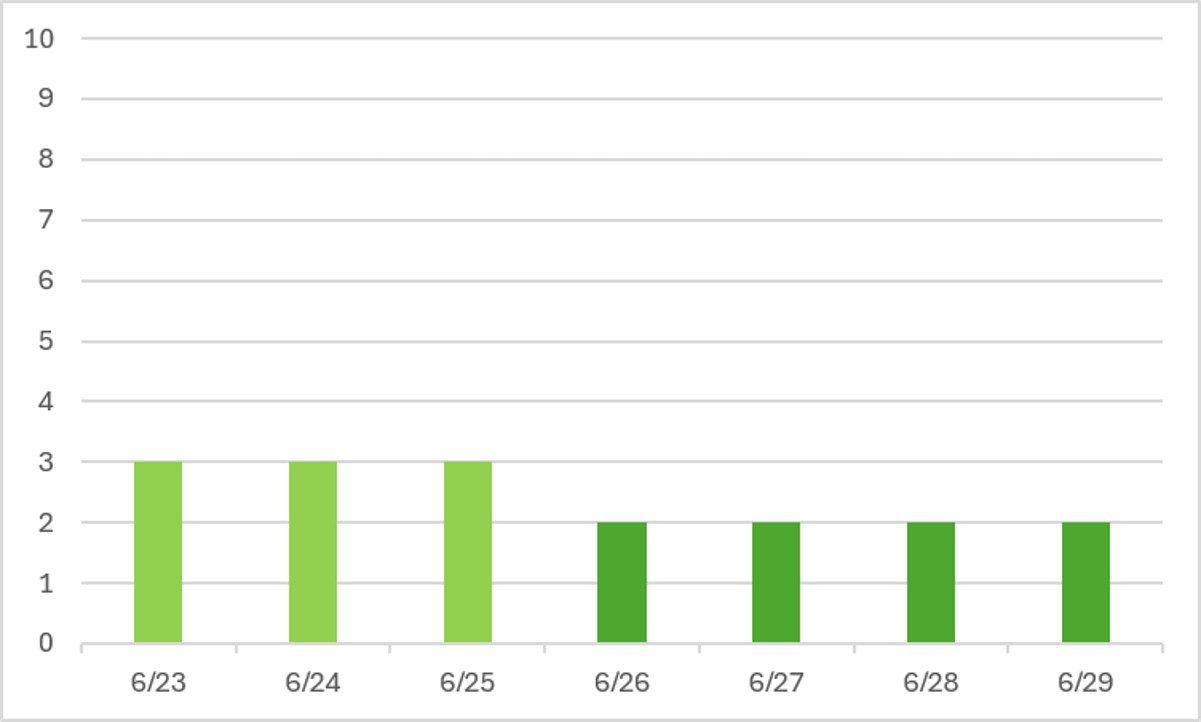
Once again, we didn’t even get close to a crowd level four. These are solidly, statistically LOW crowds. And the thing is, ever since 2022, July has been even less crowded than June. That’s another reliable trend. If that holds true this year, July is going to be very very empty, with an overall crowd level of 2.5 or lower for the month. If you can handle the heat and you hate lines, now is the time to go!

For at least the fourth week in a row, Animal Kingdom had the highest crowd level of any park every day of the past week. And EPCOT almost always has the lowest. That’s all thanks to low capacity at Animal Kingdom and no festival at EPCOT, both of which will continue throughout July and into August. Otherwise there’s really nothing remarkable to discuss here – no parks ever getting above crowd level 4 makes for a great week.
Performance of Crowd Level Predictions
Each week, I give you a very transparent look into how the TouringPlans crowd level predictions performed. Each day at each park is one data point, so each week we have 28 different crowd level predictions to evaluate. Any time a prediction is within one or two crowd levels, things won’t really “feel” much different than what was predicted. Being off by 3 or more crowd levels is where you might feel that difference in wait times throughout the day.
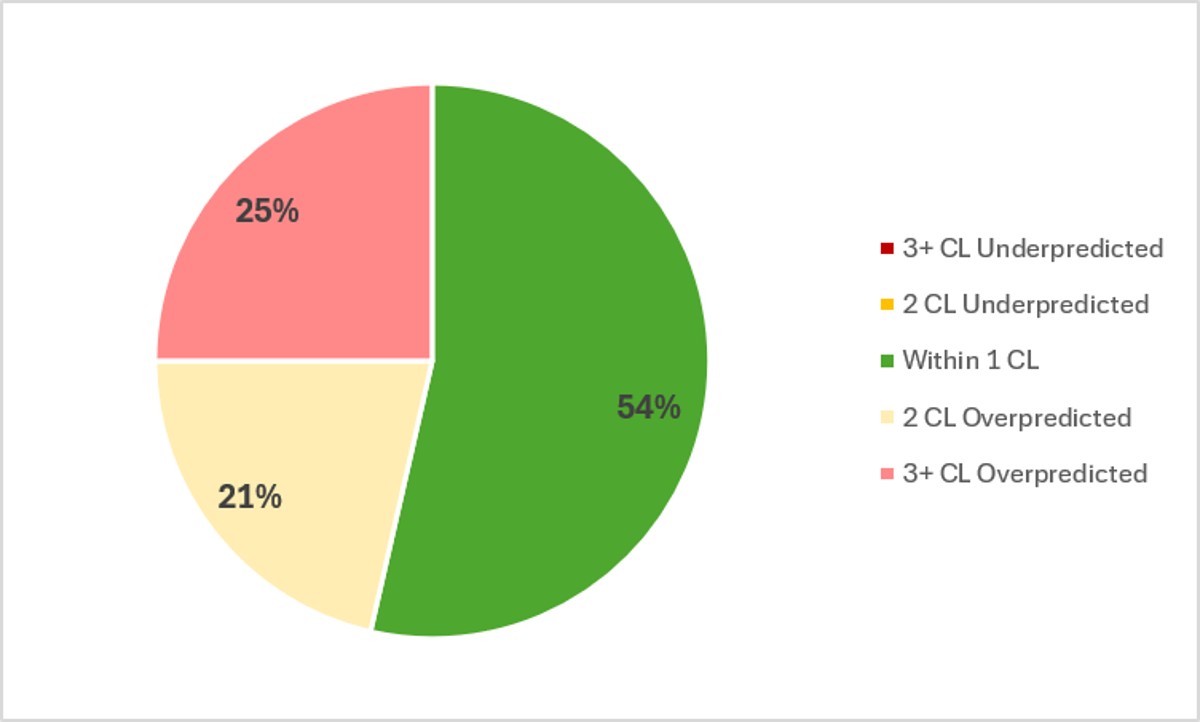
In the past week, Touring Plans predictions were either spot-on or within 1 crowd level 54% of the time, which is exactly the same as last week. And 75% of the time Touring Plans predictions were within 2 crowd levels, so that’s a C on predictions for the last week, which continues a downward trend. As we get further into the summer, crowd levels keep dropping at a higher-than-predicted pace. In fact, if you average all results, each park day was 1.6 crowd levels lower than predicted for the week. The biggest miss of the week was an overprediction by 3 crowd levels, which happened at 7 different times – 6 times at EPCOT (this happened 5 times there last week too), and once at Animal Kingdom.
Attraction Downtime June 23 – 29
If we average all of the capacity lost due to unexpected downtime over the past week, it comes out to 7.7% of attractions unexpectedly being down. That might be an all-time record, excluding weeks with day-long closures for hurricanes. Yikes! And over the past week, Animal Kingdom was yet again the park with the worst overall downtime, averaging 11% of its capacity lost to downtime. That’s another really big number. I’ve actually gotten a lot of messages on Instagram over the past week from people in the parks who were commenting that it felt like everything was breaking down. And you’re not crazy – this was a really really terrible week for attraction downtime.
The worst day for attraction downtime in the past week was on June 27th. On that day, 14% of all capacity at WDW was lost due to unexpected downtime. That’s again one of the worst “winning” numbers we’ve ever seen here on the Data Dump. But the worst park-day of the past week was at Hollywood Studios on June 23rd, when 19% of that park’s capacity was lost due to unexpected downtime. Hollywood Studios was open for 13 hours on the 23rd, so 19% downtime is the equivalent of the entire park shutting down for 148 minutes. That’s almost 2.5 hours! Imagine showing up to Hollywood Studios at park opening and being told that they decided to actually not open until 11:30 that day. That’s a MASSIVE difference in your park day. Really disappointing.
Attraction Downtime Worst Offender
In the past week, Test Track was again the WDW attraction with the worst overall downtime. That’s the FOURTH week in a row. It was unexpectedly down for 29% of the past week. And that result is higher than any of its previous “winning” numbers. The worst day of the past week at Test Track was on June 24th, when the attraction was down for 59% of the day. But there were other days of the week when it was down for 44%, 40%, and 39%. When it’s having a bad day, it’s having a really bad day.
Another thing worth calling out is that there were 3 other attractions with 20% or more downtime this week – Kali River Rapids, Expedition Everest, and Slinky Dog Dash. And Rock’n’Roller Coaster was right behind at 18% downtime. That’s a lot of headliners with a lot of downtime. It’s a miracle that crowd levels and wait times stayed as low as they did through all of it.
Rope Drop Downtime
Here are problematic offenders from the past week, with the percentage of downtime during the first hour of the day in parentheses:
- Magic Kingdom: Pirates of the Caribbean (29%), Big Thunder Mountain Railroad (26%), Haunted Mansion (26%), The Many Adventures of Winnie the Pooh (17%), Seven Dwarfs Mine Train (15%), Under the Sea (14%), TTA PeopleMover (14%), Peter Pan’s Flight (14%)
- EPCOT: Test Track (17%)
- Hollywood Studios: Rock’n’Roller Coaster (25%), Runaway Railway (23%), Slinky Dog Dash (19%), Tower of Terror (11%)
- Animal Kingdom: Expedition Everest (21%)
Let’s call out the good here – other than Test Track, EPCOT actually had a reliable rope drop week! Hooray!
Otherwise, it’s hard to be very positive with these results. Plenty of issues at Magic Kingdom, even with our usually-reliable favorites like Peter Pan’s Flight! And lots of headliner downtime at Hollywood Studios, other than Rise of the Resistance, which is a weird and rare bright spot.
Wait Times June 23 – 29
Attractions with the Highest Average Posted Wait at Each Park
- EPCOT: Test Track, average posted wait of 71 minutes (was 68 minutes last week)
- Hollywood Studios: Rock’n’Roller Coaster, average posted wait of 67 minutes (was 61 minutes at Slinky Dog Dash last week)
- Magic Kingdom: TRON, average posted wait time of 63 minutes (was 57 minutes last week)
- Animal Kingdom: Flight of Passage, average posted wait time of 59 minutes (was 46 minutes last week)
Here is where we see the impact of high downtime throughout the parks this week. Crowd levels were not significantly higher than last week, but thanks to downtime at headliners and some surrounding attractions, wait times went up at the super-headliners this week. Sometimes by a little, sometimes by a lot. Rock’n’Roller Coaster snuck back ahead of Slinky Dog Dash, and Test Track stayed ahead of Cosmic Rewind thanks to its extensive downtime driving up wait times when it was actually available.
Parks with the Highest and Lowest Average Wait
- Highest: Hollywood Studios, average park-wide posted wait of 31.5 minutes (was 31 minutes last week)
- Lowest: Magic Kingdom, average park-wide posted wait of 20 minutes (was 19 minutes last week)
Overall average waits edged up a little bit this week from the crazy-low results last week, but this is still great if you enjoy low waits.
Most Inflated Posted Wait Times
We all know that Disney inflates their posted wait times on purpose. They have many reasons for doing this. Some are totally understandable, and some are potentially more problematic. We can figure out how much posted wait times are being inflated by comparing submitted actual wait times from the Lines App and the posted wait time when the person timing their wait entered the line.
Over the past week, actual wait times in the Lines App averaged 73% of what was posted. That’s exactly our historical average in the era of Lightning Lanes. Overall, if the posted wait time at a popular attraction was 60 minutes, you could’ve expected to wait less than 44 minutes instead.
But the worst inflation offender for the past week was Tomorrowland Speedway. At this one attraction, submitted actual wait times were only 37% of posted wait times in the past week. That means that if the Speedway had a 20 minute posted wait, you probably would have actually only waited under 8 minutes instead. Almost a third of what was posted! Remember to always check the Lines app for predicted actual waits instead of making decisions based on what is posted.

This Week’s Wait Time Rock Star
Between June 23rd and 29th, we had just over 1000 timed actual waits submitted through the Lines app. The one person who recorded the most actual waits during that time was jdelehanty244 , with 49 overall timed waits – 26 Lightning Lane waits and 23 standby waits,. Thanks for all of that timing, jdelehanty244! It unfortunately does not compete with the the 97 timed waits in a single week from our current timing champion, preef.
Looking Ahead: June 30 – July 6
I write this article on Tuesday evenings so that you all have the very freshest of data on Wednesdays. That means the 30th will already be in the past by the time you’ve read this, so welcome to your future!
For the first time in three weeks, I won’t lead with “Same Old Story” … because we’ve got excitement this week! July 4th is on Saturday, which means a long weekend full of festivities. This year, Disney is offering special fireworks at Magic Kingdom on the 3rd, 4th, and 5th, and the fireworks “tag” after Luminous at EPCOT on the same dates. You could have three fireworks shows for the 4th! Or, I recommend doing EPCOT on the 3rd, Magic Kingdom on the 5th, and dining somewhere with elevated viewing on the 4th. That would be my idea of a perfect weekend.
If the weather plays nice (more on that in just a bit), we could see some higher wait times over the weekend – especially on the 3rd and 4th. But the 5th and 6th should be some of the least-crowded days of the year as people recover from all of the late-night firework festivities.
‘Tis the season for afternoon storms. Or in the case of some days this week, all-day storms. The 30th is in the past for you, gentle readers, but it looks to be the rainiest. The 3rd, 4th, and 5th all look really rainy too. But hopefully things will clear up before the sun goes down so that the fireworks can go off as planned!
Were you in the parks this past week? Or are you headed to Orlando soon? Let me know in the comments below!
You May Also Like...
-

For the first time ever, this week’s Data Dump comes to you from the back porch of Jambo House, with giraffes…
-

What we saw this past week is a really good reminder that Spring Break season isn’t one clean spike. It’s a…