Disney Data Dump June 17
At this point, I think we can stop calling it a slow start to summer. It’s just slow summer. Summer has already been slow for a few years, but it’s even slower than those years now.
Schools are out. Cool Kid Summer is underway. The weather is doing its usual Florida thing. And yet crowd levels somehow managed to be even lower this week than they were last week. There are still some interesting stories hiding underneath those low crowd numbers, but if you have a summer trip coming up, the overall headline remains a very good one.
Observed Crowd Levels June 9 – 15
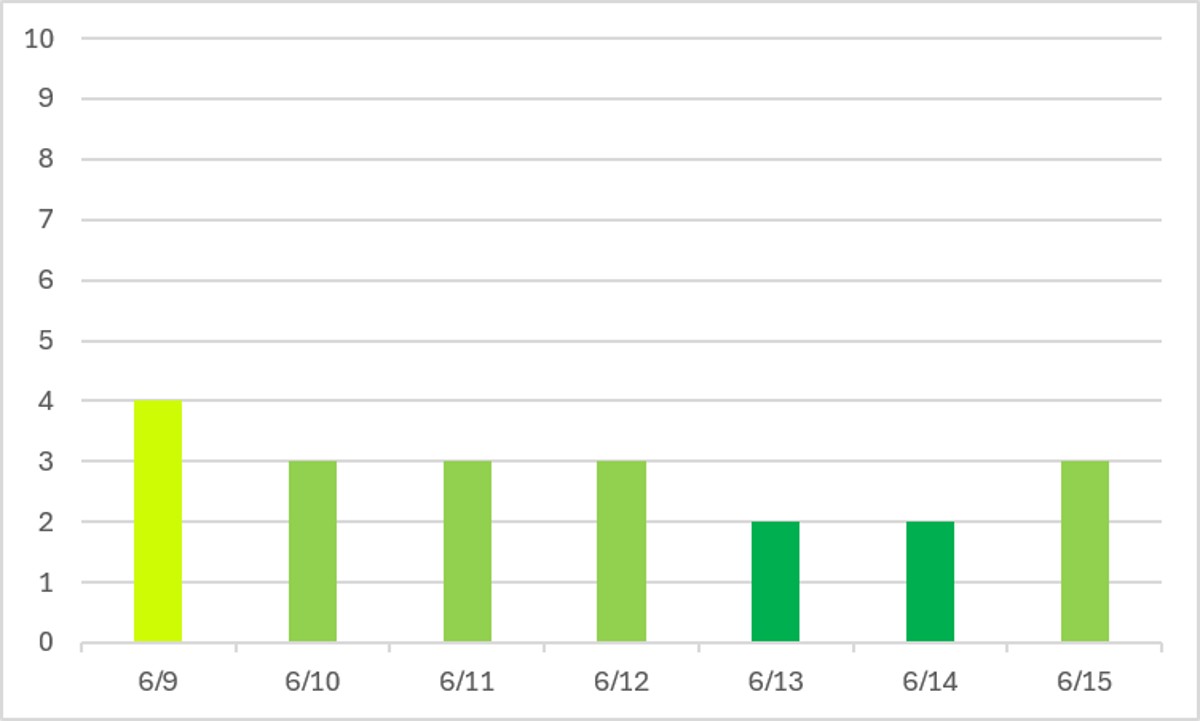
Summer was already off to a slow start with a string of crowd level 4 days … and this week we barely hit a 4 on a single day. Instead, the average crowd level for the week was below three. That’s crazy. What was already the slowest start to summer since 2014 is now decelerating even further.
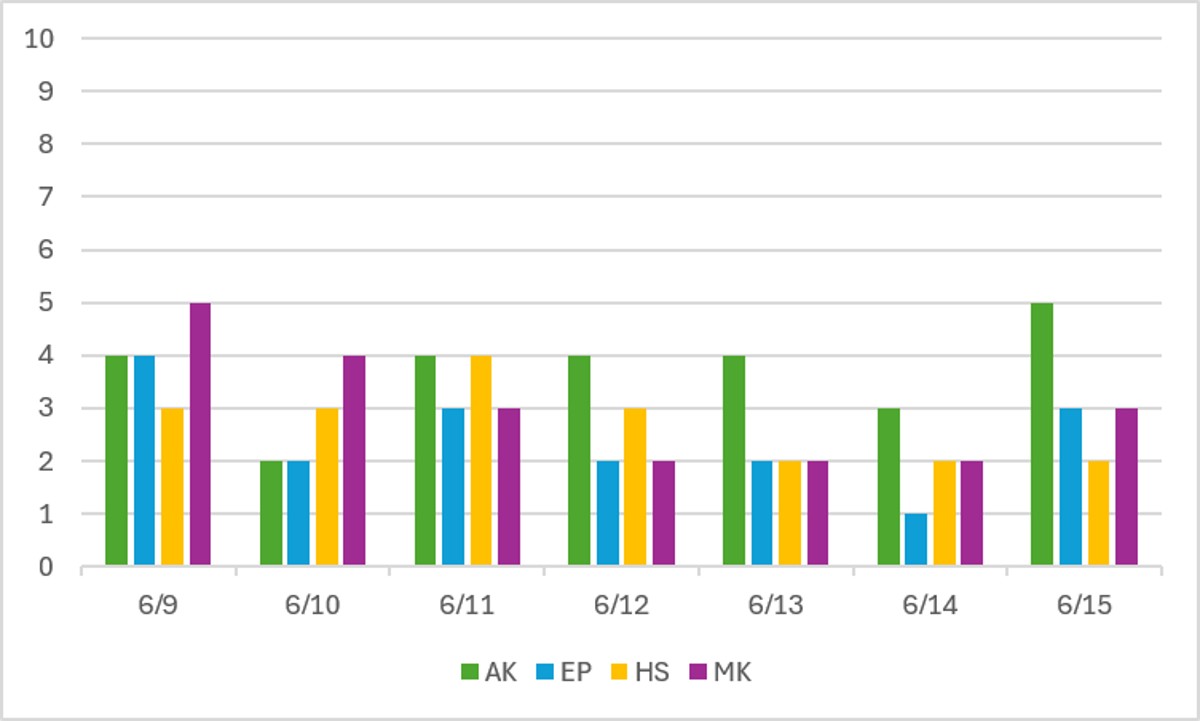
Since crowds are low everywhere, our park-by-park results aren’t particularly thrilling. But we do see a couple of interesting trends continuing. Diet EPCOT isn’t super popular (it never is), with EPCOT often competing for lowest crowd level of the day. And Animal Kingdom, as expected, still struggles to handle any sorts of crowds and often competes for highest crowd level of the day.
Performance of Crowd Level Predictions
Each week, I give you a very transparent look into how the TouringPlans crowd level predictions performed. Each day at each park is one data point, so each week we have 28 different crowd level predictions to evaluate. Any time a prediction is within one or two crowd levels, things won’t really “feel” much different than what was predicted. Being off by 3 or more crowd levels is where you might feel that difference in wait times throughout the day.
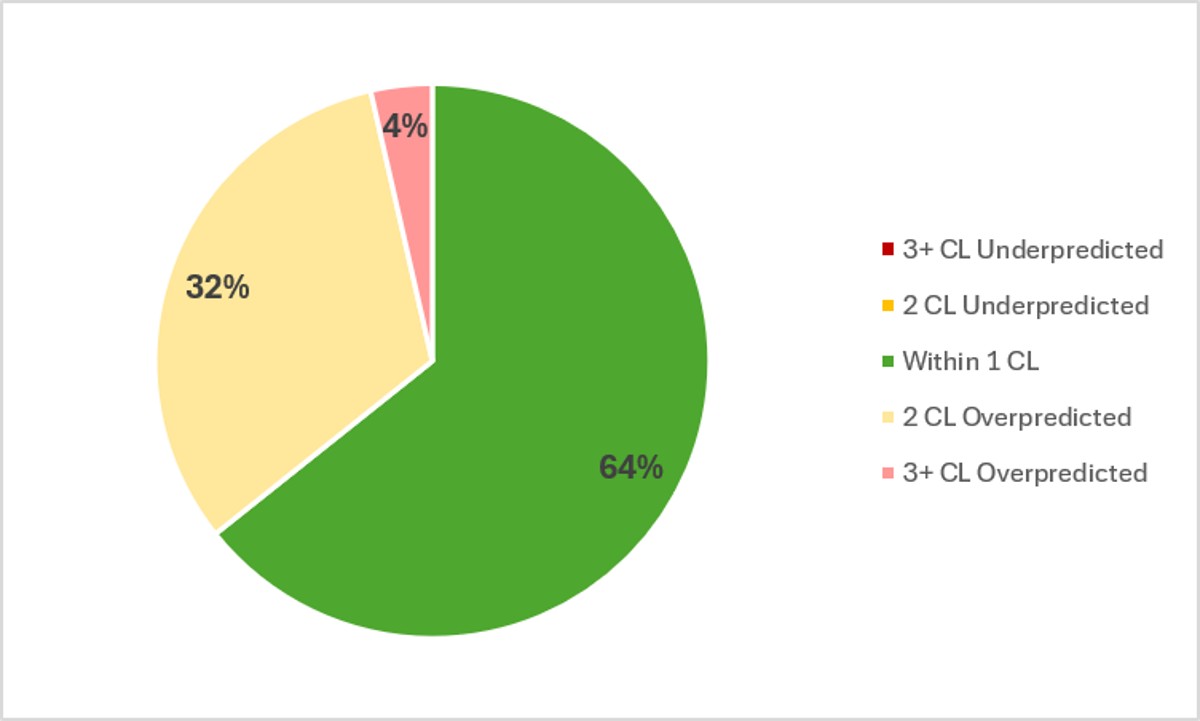
In the past week, Touring Plans predictions were either spot-on or within 1 crowd level 64% of the time, which is close to our result from last week. And 96% of the time Touring Plans predictions were within 2 crowd levels, so that’s a solid A on predictions for the last week. And based on the colors of that pie chart, all misses were overpredictions, meaning parks were less crowded than predicted. The biggest miss of the week was a single overprediction by 3 crowd levels, which happened at Animal Kingdom on June 10th. AK was predicted to be a crowd level 5 that day, and only managed a 2.
Attraction Downtime June 9 – 15
If we average all of the capacity lost due to unexpected downtime over the past week, it comes out to 5.1% of attractions unexpectedly being down. That’s exactly the same as the past two weeks. And over the past week, Animal Kingdom was the park with the worst overall downtime, averaging 6.3% of its capacity lost to downtime. That’s higher than any “winning” number we’ve had for a month or so, and it’s back at the park that suffers the most from any single attraction being down.
The worst day for attraction downtime in the past week was on June 12th. On that day, 8% of all capacity at WDW was lost due to unexpected downtime. And the worst park-day of the past week was a predictable combination of our worst park and worst overall day – Animal Kingdom on June 12th, when 15% of that park’s capacity was lost due to unexpected downtime. Animal Kingdom was open for 11 hours on the 12th, so 15% downtime is the equivalent of the entire park shutting down for over 99 minutes. More than 1.5 hours out of the 11 hours the park was open. That has a big impact!
Attraction Downtime Worst Offender
In the past week, Test Track was again the WDW attraction with the worst overall downtime. It was unexpectedly down for 24% of the past week. That’s a big increase from its win with 14% last week. The worst day of the past week at Test Track was on June 12th, when the attraction was down for 47% of the day. But it was also down for 46% of the day on the 11th and 41% of the day on the 13th. A really bad three-day stretch.

Rope Drop Downtime
Here are problematic offenders from the past week, with the percentage of downtime during the first hour of the day in parentheses:
- Magic Kingdom: The Many Adventures of Winnie the Pooh (23%), Tiana’s Bayou Adventure (20%), Carousel of Progress (19%), TTA PeopleMover (18%), Haunted Mansion (15%), Space Mountain (15%), Big Thunder Mountain (14%), Seven Dwarfs Mine Train (12%)
- EPCOT: Test Track (54%), Spaceship Earth (18%), Frozen Ever After (16%), Journey Into Imagination with Figment (10%)
- Hollywood Studios: Rise of the Resistance (21%), Slinky Dog Dash (15%), Star Tours (13%), Toy Story Mania (11%)
- Animal Kingdom: No rope drop downtime issues this week!
Another rough week for rope drop planners, unfortunately. Other than at Animal Kingdom, our mostly-reliable morning queen.
Rise and Slinky top the list at Hollywood Studios … but in good news, Rock’n’Roller Coaster is continuing it surprisingly reliable streak.
Test Track being down for over half of rope drop over the past week is a big problem at EPCOT. Thankfully, Cosmic Rewind and Remy were mostly up, so it was possible to start at either of those and wait for Test Track to come online.
And then we have Magic Kingdom. It was a big ouch, with almost every headliner (other than Tron) showing up on the rope drop downtime list. If you want to start in Fantasyland, your best bet is still Peter Pan’s Flight, followed by Seven Dwarfs next if it’s open. And if you want to start in Tomorrowland, Buzz is currently the way to go before bopping over to Tron.
Wait Times June 9 – 15
Attractions with the Highest Average Posted Wait at Each Park
- EPCOT: Test Track, average posted wait of 73 minutes (was 76 minutes at Cosmic Rewind last week)
- Hollywood Studios: Rock’n’Roller Coaster, average posted wait of 62 minutes (was 78 minutes last week)
- Magic Kingdom: TRON, average posted wait time of 60 minutes (was 70 minutes last week)
- Animal Kingdom: Flight of Passage, average posted wait time of 56 minutes (was 63 minutes last week)
Last week we already had impressively low “highest” waits across all parks, and this week things got even better. The one exception was Test Track, which had so much downtime that its average posted wait when it was online went higher than Cosmic Rewind (where the average posted wait was 71 minutes). Average posted waits at other headliners were down 10-20% compared to last week. And only five attractions had an average posted wait of 60 minutes or more – Test Track, Cosmic Rewind, Rock’n’Roller Coaster, Slinky Dog Dash, and TRON.
Parks with the Highest and Lowest Average Wait
- Highest: Hollywood Studios, average park-wide posted wait of 33 minutes (was 35.5 minutes last week)
- Lowest: Magic Kingdom, average park-wide posted wait of 21 minutes (was 22 minutes last week)
Overall, each park had slightly lower average posted waits compared to last week. Magic Kingdom usually doesn’t get as low as 20 minutes other than during party season, but here we are. And every park was under the 30-minute mark other than Hollywood Studios, which is usually my “oh things are REALLY uncrowded” indicator.
Most Inflated Posted Wait Times
We all know that Disney inflates their posted wait times on purpose. They have many reasons for doing this. Some are totally understandable, and some are potentially more problematic. We can figure out how much posted wait times are being inflated by comparing submitted actual wait times from the Lines App and the posted wait time when the person timing their wait entered the line.
Over the past week, actual wait times in the Lines App averaged 77% of what was posted. That’s significantly higher than our historical average in the era of Lightning Lanes, which means that wait times were less inflated than normal! Overall, if the posted wait time at a popular attraction was 60 minutes, you could’ve expected to wait just over 46 minutes instead.
But the worst inflation offender for the past week was Gran Fiesta Tour. At this one attraction, submitted actual wait times were only 41% of posted wait times in the past week. That means that if the Gran Fiesta Tour had a 15 minute posted wait, you probably would have actually only waited a little over 6 minutes instead. Less than half of what was posted! Remember to always check the Lines app for predicted actual waits instead of making decisions based on what is posted.

This Week’s Wait Time Rock Star
Between June 9th and 15th, we had just over 1100 timed actual waits submitted through the Lines app. The one person who recorded the most actual waits during that time was JuliusSneezer1212 (side note: what an incredible username), with 34 overall timed waits – 33 standby waits, and 1 single rider wait. Thanks for all of that timing, JulisSneezer1212! It unfortunately does not compete with the the 97 timed waits in a single week from our current timing champion, preef.
Looking Ahead: June 16 – 22
I write this article on Tuesday evenings so that you all have the very freshest of data on Wednesdays. That means the 16th will already be in the past by the time you’ve read this, so it’s like we’ve all time travelled!
More of the same here! Last week I said we definitely wouldn’t get above a crowd level 5 until July 4th-ish … maybe not even above crowd level 4. And instead, we barely got over a 3. That’s good news for all of you with summer trips planned, and bad news for Disney. There is absolutely no reason to believe that is going to change any time in the near future.
One call-out this week is that Hollywood Studios closes early (at 6 pm) on the 18th, so wait times should be especially low on that day.
The weather is also more of the same, in reliable Florida. Afternoon thunderstorms should roll through almost every day, with highs in the mid-90s and lows in the mid-70s. That means you’ll be feeling the heat and humidity, and you should be grateful when the storms come to cool things off. Just be prepared!
Were you in the parks this past week? Or are you headed to Orlando soon? Let me know in the comments below!
You May Also Like...
-

Welcome to June, and to the first full week of Cool Kid Summer at Walt Disney World! With new deals in…
-

We’re creeping toward July, and with it the promise of holiday travel, late summer debuts, and maybe - just maybe -…