Disney Data Dump May 27 2026
Memorial Day weekend came and went and … did somebody forget to tell vacationing families? Normally, this is where I’d be talking about the first real taste of summer crowds. Slightly longer waits. More locals. Schools getting out. The beginning of the sweaty season. Instead, late May decided to keep doing its very pleasant late-May thing, with crowd levels that stayed shockingly low even through a holiday weekend.
That doesn’t mean the data is boring, though. We’ve got some very interesting behavior along with those tiny crowd numbers. And, as I’m writing this, the parks are in the middle of a whole pile of new offerings, reopenings, Muppet takeovers, and summer entertainment.
So before we see what all of that does to the numbers, let’s take one last look at a Memorial Day week that was far quieter than almost anyone expected.
Observed Crowd Levels May 19 – 25
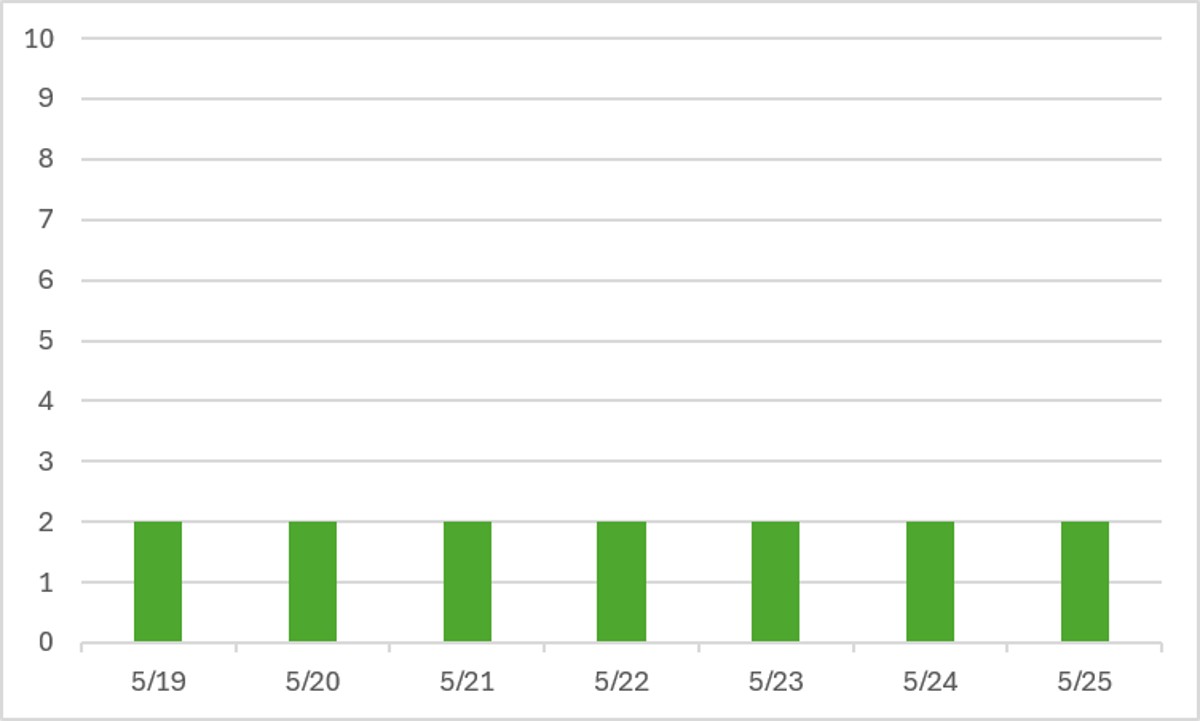
Wow, look at that incredible crush of Memorial Day crowds!!! Jokes. Apparently the large slate of attractions and entertainment scheduled to open on May 26th kept the crowds away for the rest of late May. Most schools were still in session, but even the locals didn’t show up in any measurable way over the long weekend! This was the week to be in WDW if you wanted manageable waits and the ability to avoid the MOST sweaty time of year.

We get little more interesting-ness at the park-by-park level. Still a lot of 2s, though. Animal Kingdom spiked up a few times. If you’ve been reading this series any time in the past 2 months, you’re not surprised by this. AK doesn’t have the capacity to handle any crowds well. And starting May 26th, the crowds absolutely will descend for Bluey and Bingo. EPCOT popped up to a whole crowd level 3 on Sunday. Otherwise, Hollywood Studios and Magic Kingdom and EPCOT were all crowd level 2 or less for all of the past 7 days.
Performance of Crowd Level Predictions
Each week, I give you a very transparent look into how the TouringPlans crowd level predictions performed. Each day at each park is one data point, so each week we have 28 different crowd level predictions to evaluate. Any time a prediction is within one or two crowd levels, things won’t really “feel” much different than what was predicted. Being off by 3 or more crowd levels is where you might feel that difference in wait times throughout the day.
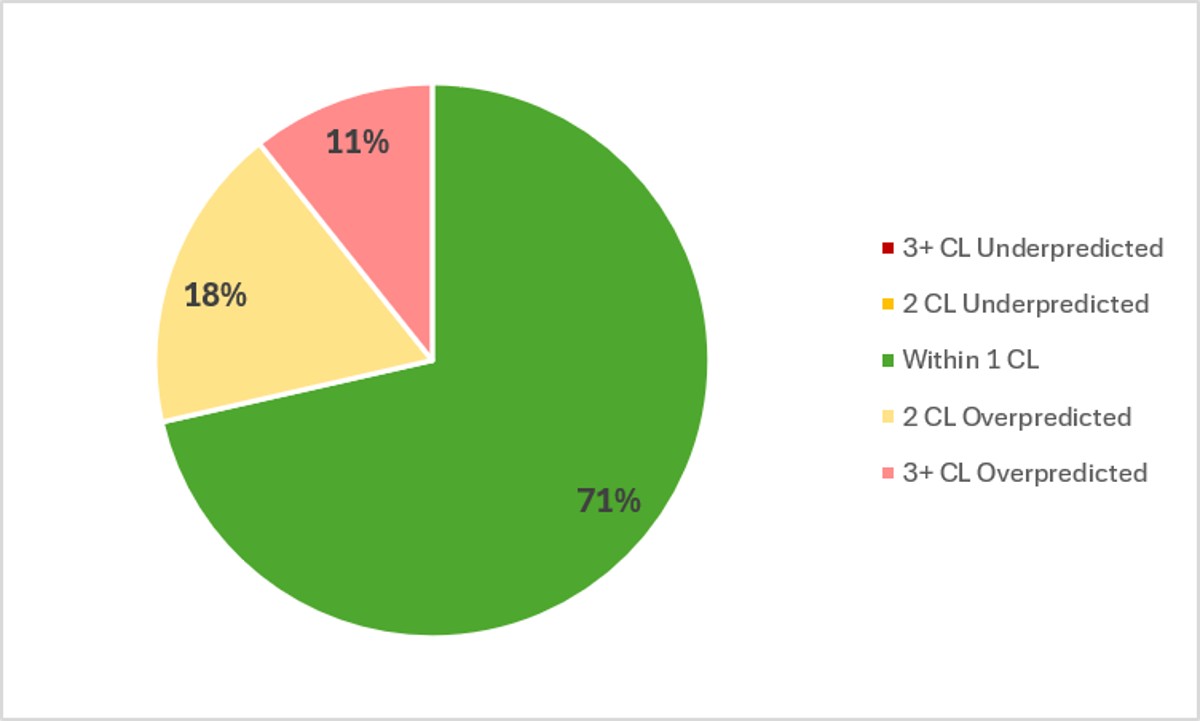
In the past week, Touring Plans predictions were either spot-on or within 1 crowd level 71% of the time, which is lower than the past couple of weeks. And 89% of the time Touring Plans predictions were within 2 crowd levels, so that’s a B+ on predictions for the week. What does that mean? Things got ever-so-slightly less predictable in the past week. And based on the colors of that pie chart, they were significantly less crowded that predicted. Fewer people showed up for Memorial Day weekend (and the week leading up to it) than we would’ve expected based on past years and school calendars. The biggest miss of the week was an overpredictions by 5 crowd levels, which happened at Hollywood Studios on the 22nd. HS was predicted to be a crowd level 6 that day, and only managed a measly 1.
Attraction Downtime May 19 – 25
If we average all of the capacity lost due to unexpected downtime over the past week, it comes out to 4.1% of attractions unexpectedly being down. That’s a wee bit lower than what we’ve seen over the past month or so. And finally, over the past week, Animal Kingdom WASN’T the park with the most overall downtime! Hooray. The crown passes to EPCOT this week, averaging 4.6% of its capacity lost to downtime. Still not a terrible number. We’ve had much, much worse results.
The worst day for attraction downtime in the past week was on May 25th. On that day, 6% of all capacity at WDW was lost due to unexpected downtime. But the worst park-day of the past week was actually back at Animal Kingdom on May 24th, when 11% of that park’s capacity was lost due to unexpected downtime. Animal Kingdom was open for 11 hours on the 24th, so 11% downtime is the equivalent of the entire park shutting down for over 72 minutes. Over an hour out of the 11 hours the park was open. That’s not cool.
Attraction Downtime Worst Offender
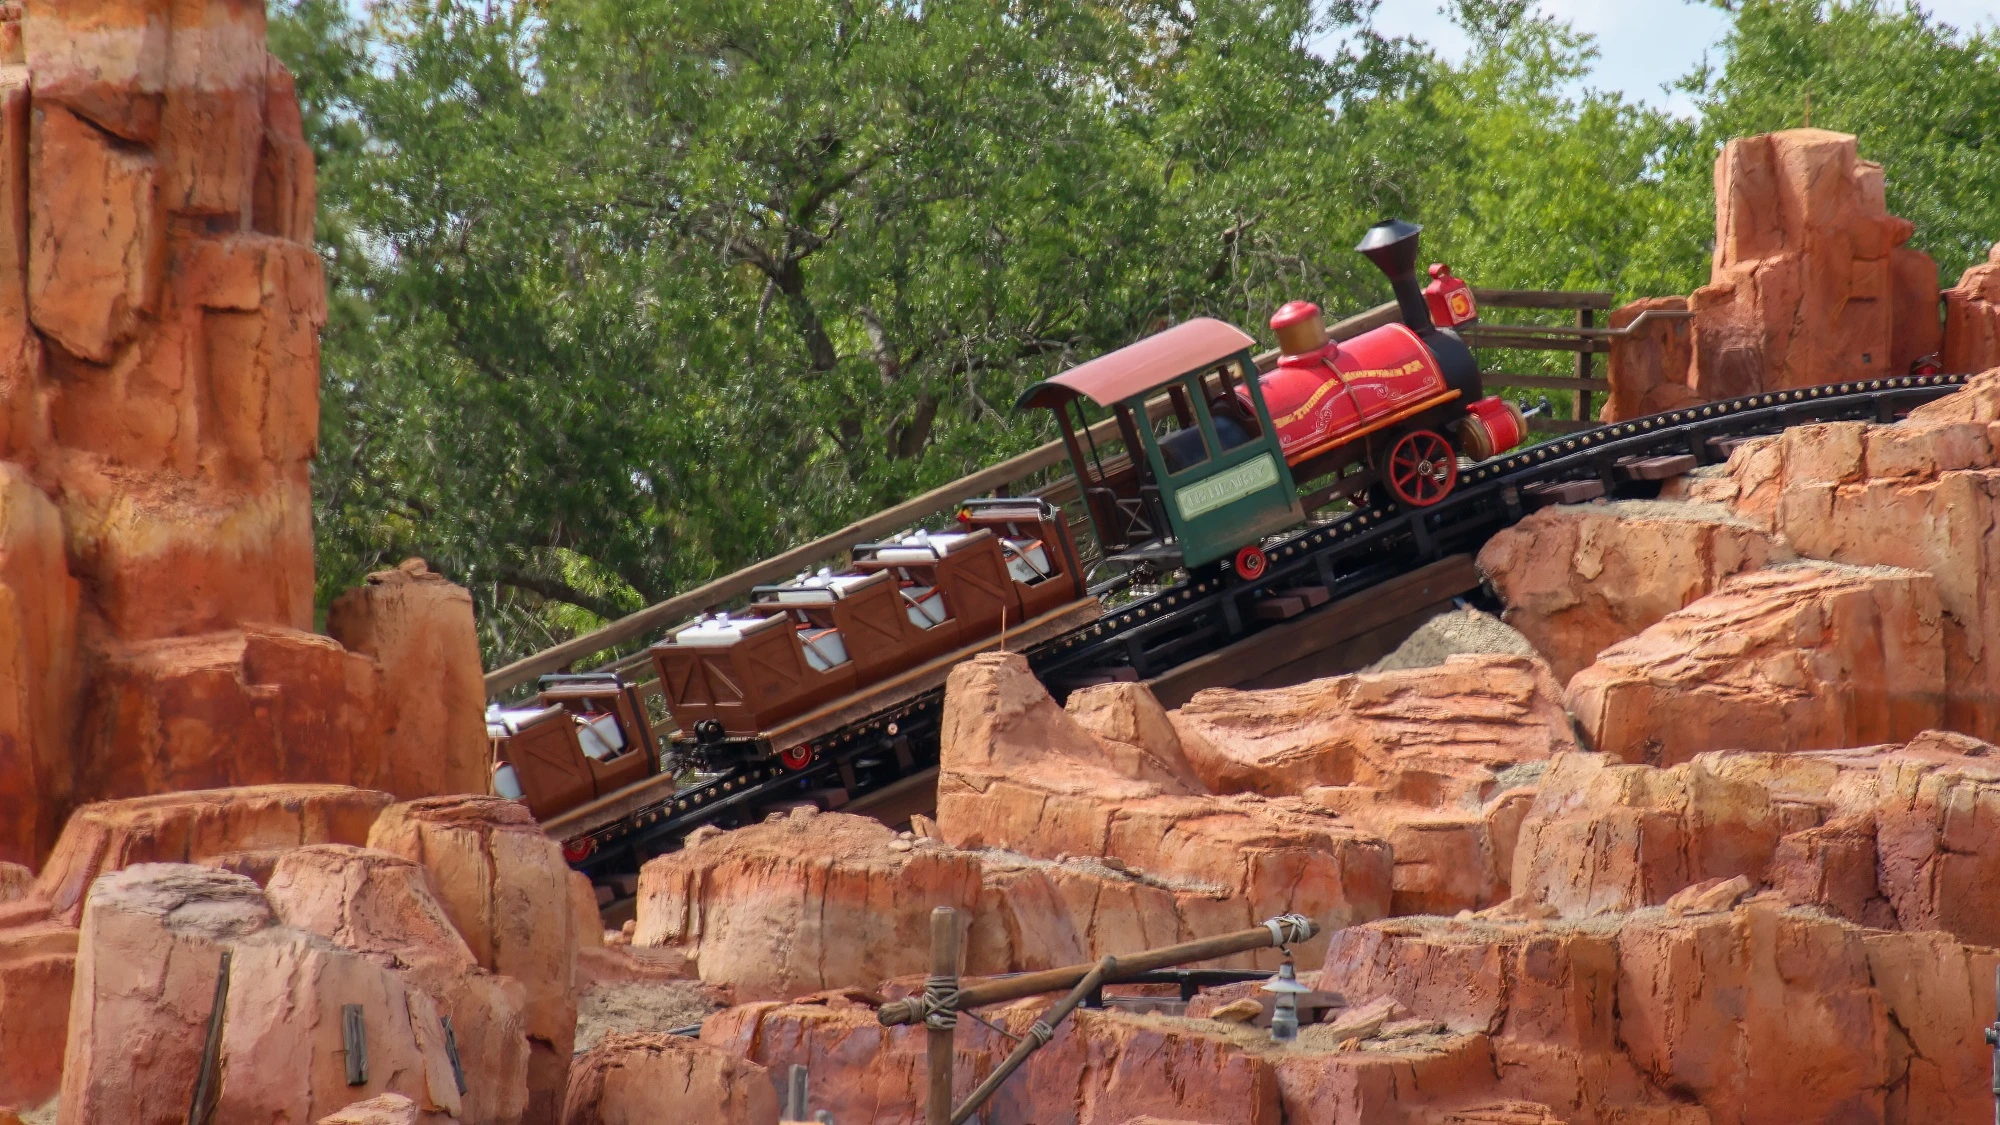
In the past week, Big Thunder Mountain Railroad was the WDW attraction with the worst overall downtime. It was unexpectedly down for 15% of the past week. I called out right after it opened that Big Thunder had a surprising amount of unreliability and that hopefully it would hit its stride. Turns out … not so much. This is a worrying trend with major headliners coming back from refurbishments and still having extensive downtime (Tiana’s, Test Track, Rock’n’Roller Coaster, Big Thunder …). The worst day at Big Thunder was on May 23rd, when the attraction didn’t come fully online until after 5:30 pm. Big ouch.
Rope Drop Downtime
Here are problematic offenders from the past week, with the percentage of downtime during the first hour of the day in parentheses:
- Magic Kingdom: Haunted Mansion (26%), Winnie the Pooh (19%), Big Thunder Mountain (18%), Pirates of the Caribbean (16%), Peter Pan’s Flight (14%), Tiana’s Bayou Adventure (14%), Under the Sea (13%), Tron (12%)
- EPCOT: Soarin’ (36%), Frozen Ever After (18%), Journey Into Imagination (17%), Spaceship Earth (15%), Test Track (13%), Remy’s Ratatouille Adventure (11%)
- Hollywood Studios: Slinky Dog Dash (18%), Millennium Falcon: Smugglers Run (12%)
- Animal Kingdom: No rope drop downtime issues!
Interesting rope drop results again this week! Rise of the Resistance dropped totally off of the list, after being the very worst serial offender for the past 2 months or so. And otherwise, Hollywood Studios had a really not-bad week. I will call out that it’s not captured in the data, but Rock’n’Roller Coaster did have some struggles opening on time for its preview days, so we could see that impact next week once it’s officially reopened.
Good ol’ reliable Animal Kingdom didn’t have any rope drop issues.
EPCOT had a very very terrible rope drop week, with all headliners other than Cosmic Rewind showing up on the downtime list. Even Soarin’! But hopefully that’s a blip thanks to the introduction of a new film.
Magic Kingdom … keeps being Magic Kingdom. It used to be one of the most reliable downtime parks, and this year it has suddenly taken a turn toward being the worst. Thankfully the two biggest early entry targets (Seven Dwarfs Mine Train and Space Mountain) stayed up this week.
Wait Times May 19 – 25
Attractions with the Highest Average Posted Wait at Each Park
- EPCOT: Cosmic Rewind, average posted wait of 71 minutes (was 81 minutes last week)
- Animal Kingdom: Flight of Passage, average posted wait time of 57 minutes (was 62 minutes last week)
- Magic Kingdom: TRON, average posted wait time of 55 minutes (was 58 minutes last week)
- Hollywood Studios: Slinky Dog Dash, average posted wait of 54 minutes (was 54 minutes last week)
These are results that you will only see very rarely at Walt Disney World (or maybe it’s the new normal for summer … I guess we’ll find out)! Only two attractions in all of Walt Disney World had average posted waits that were over an hour – Cosmic Rewind, and Test Track (64 minutes). Otherwise, nothing averaged a posted wait over an hour. And since posted waits are generally inflated compared to actuals, this means that no attraction averaged over an hour in actual wait times. Don’t show these numbers to someone who went in February when there were waits over 2 hours.
Parks with the Highest and Lowest Average Wait
- Highest: Animal Kingdom, average park-wide posted wait of 30 minutes (was 32 minutes last week)
- Lowest: Magic Kingdom, average park-wide posted wait of 18 minutes (was 20.5 minutes last week)
So. Close. To every park having an average posted wait under 30 minutes! Hollywood Studios was at 29 minutes, and EPCOT was even lower at 25. But that Magic Kingdom number is incredible – an average posted wait for every attraction in the park of under 20 minutes. We almost never see that result, even when party days tank the numbers in the fall and early winter. It was a very very good week to be in Magic Kingdom.
Most Inflated Posted Wait Times
We all know that Disney inflates their posted wait times on purpose. They have many reasons for doing this. Some are totally understandable, and some are potentially more problematic. We can figure out how much posted wait times are being inflated by comparing submitted actual wait times from the Lines App and the posted wait time when the person timing their wait entered the line.
Over the past week, actual wait times in the Lines App averaged 73% of what was posted. That’s very close to our historical average in the era of Lightning Lanes. Overall, if the posted wait time at a popular attraction was 60 minutes, you could’ve expected to wait just under 44 minutes instead.
But the worst inflation offender for the past week was Tomorrowland Transit Authority PeopleMover. That’s a new one! At this one attraction, submitted actual wait times were only 36% of posted wait times in the past week. That means that if the PeopleMover had a 15 minute posted wait, you probably would have actually only waited 5.5 minutes instead. Almost a third of what was posted! Remember to always check the Lines app for predicted actual waits instead of making decisions based on what is posted.
This Week’s Wait Time Rock Star
Between May 19th and 25th, we had just over 1000 timed actual waits submitted through the Lines app. The one person who recorded the most actual waits during that time was lmille40, with 46 overall timed waits – 29 Lightning Lane wait, 16 standby waits, and 1 single rider wait. Thanks for all of that timing, lmille40! It unfortunately does not compete with the the 97 timed waits in a single week from our current timing champion, preef.
Looking Ahead: May 26 – June 1
I write this article on Tuesday evenings so that you all have the very freshest of data on Wednesdays. That means the 26th will already be in the past by the time you’ve read this, so you’re in the future!
As I write this article, all of the new Cool Kid Summer offerings are finally going live! Bluey and Bingo will draw even more humans over to Animal Kingdom (watch out for that Virtual Queue if you want to see them), the Muppets have officially taken over Rock’n’Roller Coaster, Walt Disney Studios is open, and more. But not very many school districts across the country are out of school for the summer yet, especially on the east coast, where many visitors hail from. After a string of crowd level 2s, even over the long weekend, I think it’s safe to say, we’re not going to suddenly jump to above average. The additional capacity gained from the new attractions and entertainment should outpace additional demand.
OTHER THAN at Animal Kingdom – waits are definitely going to go up there, especially with the Virtual Queue for Bluey and Bingo. The 7 am queue will likely fill instantly for the foreseeable future, and the 10 am queue requires you to be in the park to join. That means more people filling other areas of the park, just hoping for a chance to take the train out to Conservation Station. And then if they are successful, they have to wait to get called to ride the train. A recipe for higher waits throughout the park.
Scattered thunderstorms are now in the forecast for pretty much every day. Highs in the 80s and 90s means that you’ll need to be prepared for heat, sun, and storms every day. Fans, sunscreen, umbrella, ponchos or rain jackets, oh my!
Were you in the parks this past week? Or are you headed to Orlando soon? Let me know in the comments below!
You May Also Like...
-

What we saw this past week is a really good reminder that Spring Break season isn’t one clean spike. It’s a…
-

Late spring has been remarkably polite to us at Walt Disney World. Low crowds. Predictable wait times. No major surprises hiding in…
We were in the parks Saturday through Monday and were doubly, pleasantly surprised at the low crowd levels and that the ride changes for 5/26 were already in place. Soarin’ Across America is a nice tribute to our country.
If I were a local, I think the weather forecast would have kept me away Saturday — heavy storms were forecast at +80% likeliness for much of the day that didn”t materialize until evening. Seeing the impressive lightening and not wanting to deal with an electric scooter during a downpour, we bailed in mid evening when the Weather Channel app predicted the storm would hit in about 45 minutes. But the prediction stayed at 45 minutes all evening while the storms went around us until after the parks closed. Oh well. 🙂