Disney Data Dump May 20 2026
Late spring has been remarkably polite to us at Walt Disney World. Low crowds. Predictable wait times. No major surprises hiding in the data. Honestly, it’s been a lovely (if boring) stretch to analyze and an even lovelier stretch for WDW visits.
But this week feels a little bit like the last quiet chapter before we turn the page into summer. Not because the parks suddenly exploded with crowds (spoiler: they did not), but because we’re finally starting to see the first hints of seasonal change creeping in around the edges. Preview events, holiday weekends, reopening attractions, shifting crowd patterns … the data is beginning to get a little more interesting again.
Before we get into Memorial Day weekend, Cool Kid Summer, popular Australian puppies, and all of the other chaos waiting for us later this month, let’s take a look at one more week of very pleasant late-spring Walt Disney World.
Observed Crowd Levels May 12 – 18
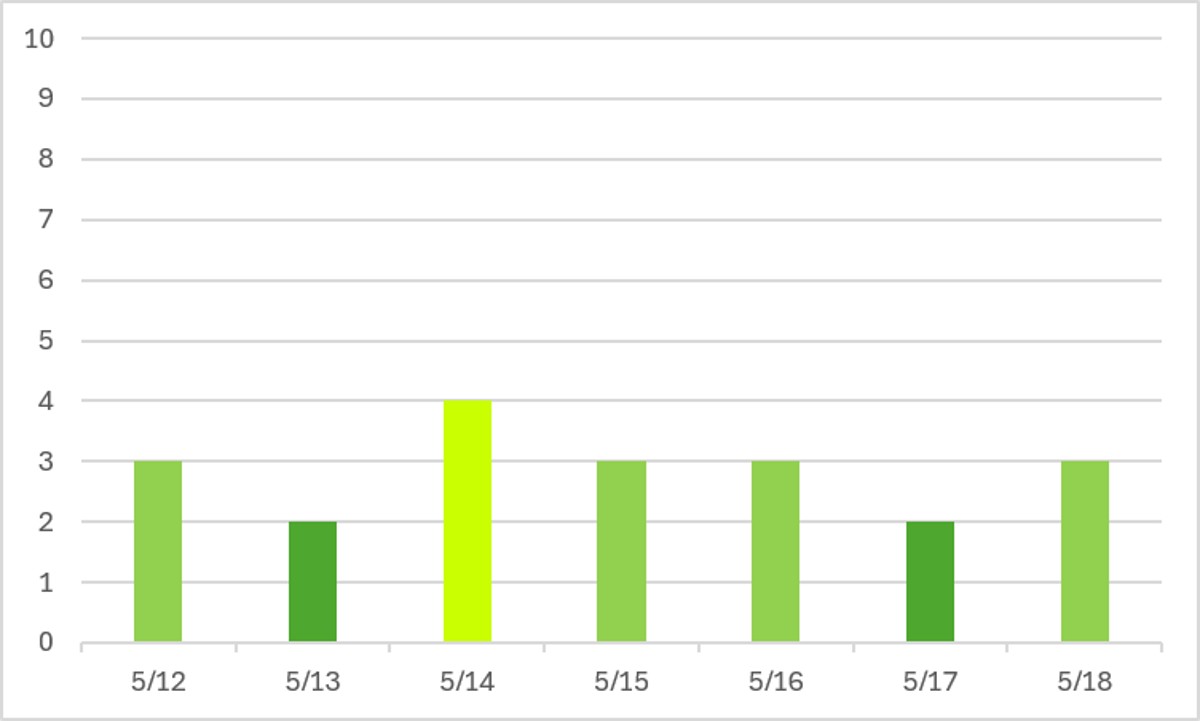
Ah, one last week of this nice and reliable late Spring. Barely even a day that got above crowd level 3 on our scale of 10!
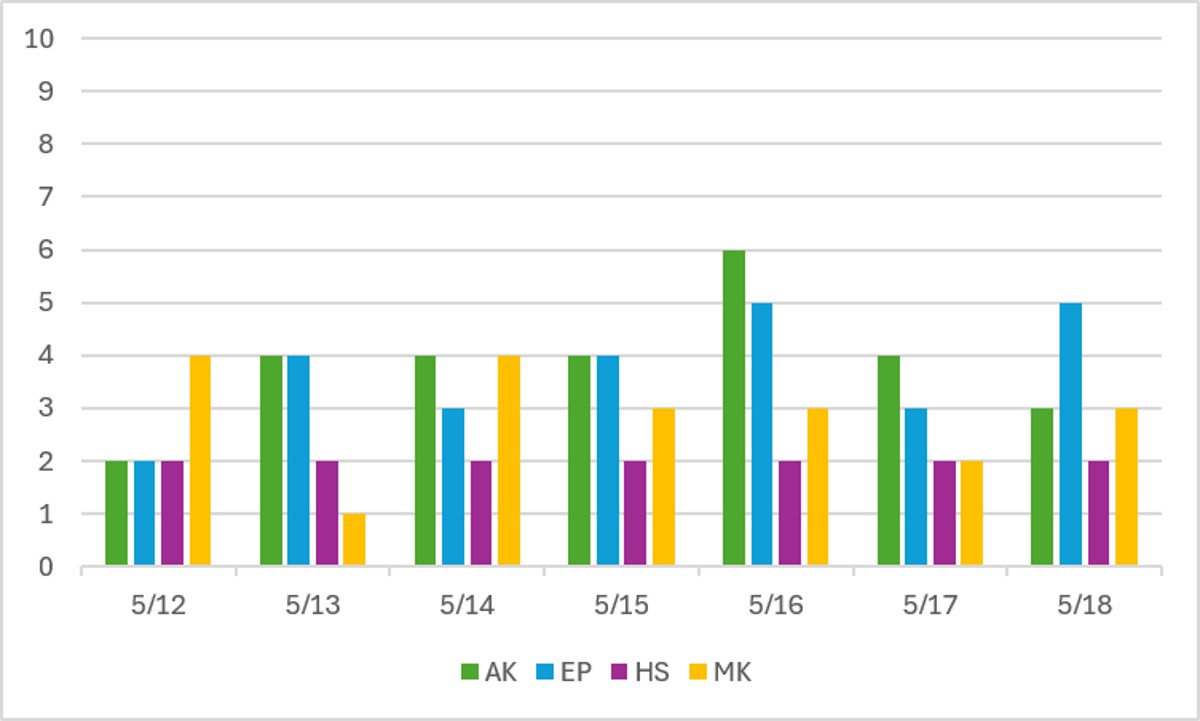
At the park-by-park level we get a little more interesting information. On the 13th, Magic Kingdom closed at 5:30 pm, so it’s not a surprise that the crowd level there dropped to a 1 on that day, and that the days on either side popped up to crowd level 4. We’ve also got Hollywood Studios just chilling at crowd level 2 alllllll week. It was a great week to go do headliners there, before the opening of The Walt Disney Studios and the reopening of Rock’n’Roller Coaster next week.
Performance of Crowd Level Predictions
Each week, I give you a very transparent look into how the TouringPlans crowd level predictions performed. Each day at each park is one data point, so each week we have 28 different crowd level predictions to evaluate. Any time a prediction is within one or two crowd levels, things won’t really “feel” much different than what was predicted. Being off by 3 or more crowd levels is where you might feel that difference in wait times throughout the day.
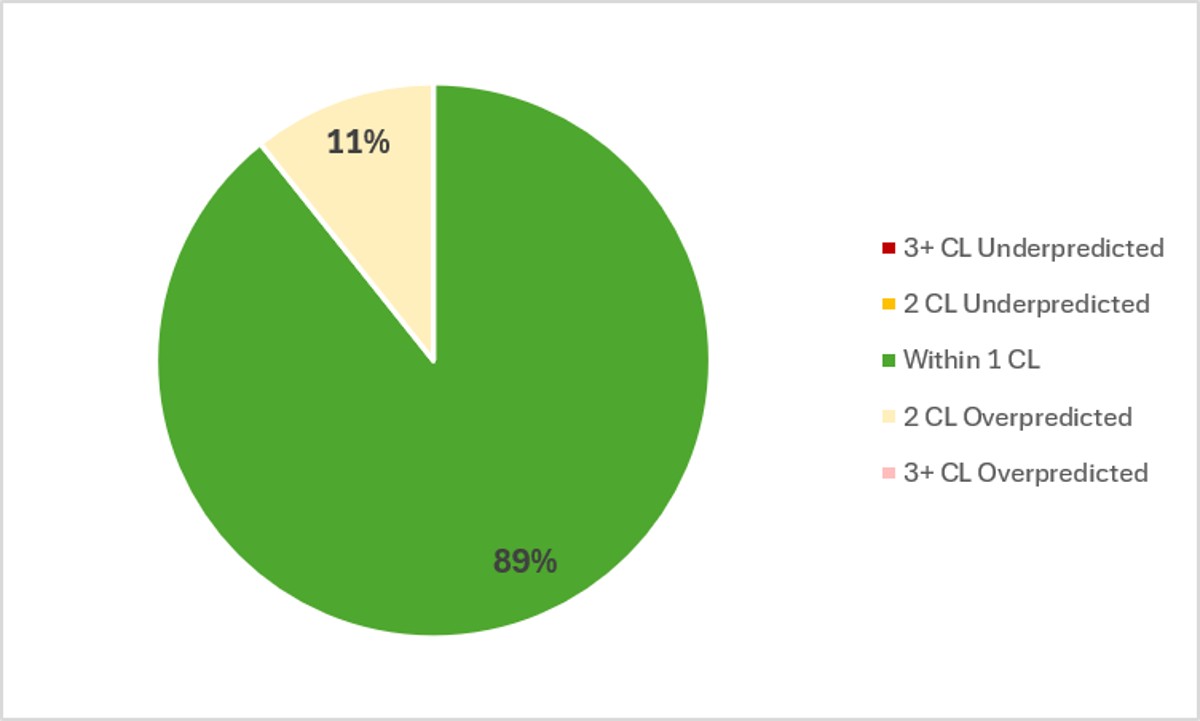
In the past week, Touring Plans predictions were either spot-on or within 1 crowd level 89% of the time, which is one of the best results we’ve seen in a very long time. And then 100% of the time Touring Plans predictions were within 2 crowd levels, so that’s a perfect score for the week! That’s the second perfect score we’ve seen in the past month, thanks to these reliably low pre-summer crowds. The biggest misses of the week were just three overpredictions by 2 crowd levels, which isn’t a big deal anyway.
Attraction Downtime May 12 – 18
If we average all of the capacity lost due to unexpected downtime over the past week, it comes out to 4.3% of attractions unexpectedly being down. That’s ever-so-slightly lower than what we’ve seen over the past month or so. In the past week, Animal Kingdom was yet again the park with the most overall downtime, averaging 4.7% of its capacity lost to downtime. This definitely contributes to the higher wait times at the already-low-capacity park.
The worst day for attraction downtime in the past week was on May 12th. On that day, 6% of all capacity at WDW was lost due to unexpected downtime. But the worst park-day of the past week was actually at Animal Kingdom on May 14th, when 12% of that park’s capacity was lost due to unexpected downtime. Animal Kingdom was open for 10 hours on the 14th, so 12% downtime is the equivalent of the entire park shutting down for 72 minutes. Over an hour out of the 10 hours the park was open. Another boo.
Attraction Downtime Worst Offender
In the past week, Mickey and Minnie’s Runaway Railway was the WDW attraction with the worst overall downtime. It was unexpectedly down for 16% of the past week. The work day at Runaway Railways was on May 17th, when the attraction didn’t come online until after 6:30 pm. Ouch!

Rope Drop Downtime
Here are problematic offenders from the past week, with the percentage of downtime during the first hour of the day in parentheses:
- Magic Kingdom: Tiana’s Bayou Adventure (21%), it’s a small world (21%), Big Thunder Mountain (18%), Winnie the Pooh (16%), Haunted Mansion (14%), Price Charming’s Regal Carrousel (10%)
- EPCOT: Test Track (17%), Journey Into Imagination (15%)
- Hollywood Studios: Runaway Railway (15%), Rise of the Resistance (13%)
- Animal Kingdom: No rope drop downtime issues!
A bit of a mixed bag this week all around. Animal Kingdom had a great rope drop reliability week. And Hollywood Studios had its best result of at least the past month. We haven’t seen Rise of the Resistance with this little rope drop downtime in at least a few months. It’s been over 20% for ages. EPCOT has had multi-headliner rope drop downtime lists for a while, and now we’re only down to Test Track.
The big remaining problem is Magic Kingdom. Tiana’s and Big Thunder are both not doing great in the morning, which is sad for guests without Early Entry, since those should be the best regular rope drop options. And it’s a small world and Winnie the Pooh are both good options for families that are splitting between Seven Dwarfs Mine Train and other Fantasyland attractions in the morning. Focus on Peter Pan’s Flight instead, if that’s your plan for your Magic Kingdom morning.
Wait Times May 12 – 18
Attractions with the Highest Average Posted Wait at Each Park
- EPCOT: Cosmic Rewind, average posted wait of 81 minutes (was 82 minutes last week)
- Animal Kingdom: Flight of Passage, average posted wait time of 62 minutes (was 62 minutes last week)
- Magic Kingdom: TRON, average posted wait time of 58 minutes (was 69 minutes last week)
- Hollywood Studios: Slinky Dog Dash, average posted wait of 54 minutes (was 60 minutes last week)
Generally, this week looks even better than last week! Only three attractions in all of Walt Disney World had average posted waits that were over an hour – Cosmic Rewind, Test Track (72 minutes) and Flight of Passage. Hollywood Studios saw an especially great week thanks to that string of crowd level 2 days.
Parks with the Highest and Lowest Average Wait
- Highest: Animal Kingdom, average park-wide posted wait of 32 minutes (was 36 minutes last week)
- Lowest: Magic Kingdom, average park-wide posted wait of 20.5 minutes (was 21 minutes last week)
Those low wait times translated up to the park level too! Wait times dropped by more than 10% at Animal Kingdom. And each of the three other parks had average overall posted waits that were under 30 minutes, which is our benchmark for very nice and low crowds.
Most Inflated Posted Wait Times
We all know that Disney inflates their posted wait times on purpose. They have many reasons for doing this. Some are totally understandable, and some are potentially more problematic. We can figure out how much posted wait times are being inflated by comparing submitted actual wait times from the Lines App and the posted wait time when the person timing their wait entered the line.
Over the past week, actual wait times in the Lines App averaged 74% of what was posted. That’s a little bit above our historical average in the era of Lightning Lanes. Overall, if the posted wait time at a popular attraction was 60 minutes, you could’ve expected to wait about 44 minutes instead.
But the worst inflation offender for the past week was Mission: Space. Two weeks in a row! At this one attraction, submitted actual wait times were only 33% of posted wait times in the past week. That means that if Mission Space had a 30 minute posted wait, you probably would have actually only 10 minutes instead. A third of what was posted! Remember to always check the Lines app for predicted actual waits instead of making decisions based on what is posted.
This Week’s Wait Time Rock Star
Between May 12th and 18th, we had just over 1200 timed actual waits submitted through the Lines app. The one person who recorded the most actual waits during that time was a49t2g6s, with 32 overall timed waits – 1 Lightning Lane wait, 29 standby waits, and 2 single rider waits. Thanks for all of that timing, a49t2g6s! It unfortunately does not compete with the the 97 timed waits in a single week from our current timing champion, preef.
Looking Ahead: May 19 – 25
I write this article on Tuesday evenings so that you all have the very freshest of data on Wednesdays. That means the 19th will already be in the past by the time you’ve read this, so you’re all time travelers now!
We’re finally to a period of slightly more interest! Which is good news for me so that I don’t get bored of the data. But potentially bad news if you like really low crowds like we’ve been seeing for most of May. Cast member previews for some of the summer openings have already started (Soarin’ and Rock’n’Roller Coaster), with AP previews scheduled for the 19th through the 23rd. That shouldn’t create too many crowd issues since a lot of people heading to those previews aren’t going to be making a full park day out of the whole experience.
But then we hit Memorial Day weekend! Two levels of annual passes (Pirate and Pixie Dust) will both be blocked out Saturday through Monday, but there should still be lots of locals enjoying the parks, along with out-of-town visitors taking advantage of the start of summer and the long weekend. None of that means top-tier crowds, but we might see slight upward bumps in wait times and crowd levels.
Weather-wise, we’re now fully in the season of regular afternoon thunderstorms. It might not ALWAYS happen. And when it does, it usually won’t last for long. But you need to be prepared with rain gear, and you should organize your days to do most of your outdoor attractions in the morning. It’ll be humid and hot (highs in the 90s), so make sure you hydrate and have a fan too!
Were you in the parks this past week? Or are you headed to Orlando soon? Let me know in the comments below!
You May Also Like...
-

What we saw this past week is a really good reminder that Spring Break season isn’t one clean spike. It’s a…
-

If you were hoping for an April Fools’ joke where I tell you Spring Break crowds suddenly disappeared… I regret to…
Long, long time subcriber to Touring Plans.
How often is the prediction numbers updated in your Crowd Calendar portion of the Website???