
Disney Data Dump November 23 2022
What a November we’re having, Disney friends. A freak hurricane. The great Bob-Switch of 2022. The Detroit Lions being the only team in the NFC North that won their game this weekend. That whole Twitter thing. A new cruise ship. The train being spotted back in Magic Kingdom. A deer choosing to run into my car (oh wait, that’s just me). I can’t wait to see what the Theme Park Turkeys choose to cover from this rich cornucopia of news. But we don’t get to have quite that much fun here. We’ll stick to the data!
Observed Crowd Levels 11/15 – 11/21

Well, if this graph isn’t the tale of two different crowd types, I don’t know what is. The week between “Jersey Week” and Thanksgiving always has pretty moderate crowds. A lot of folks that aren’t willing to take their kids out of too much school pick one of those weeks with more vacation days. In between, things behave more like a normal fall period, somewhat similar to what we saw during non-holiday October periods.
But then there’s the 21st. Welcome to Thanksgiving week, y’all. We’re just getting started.

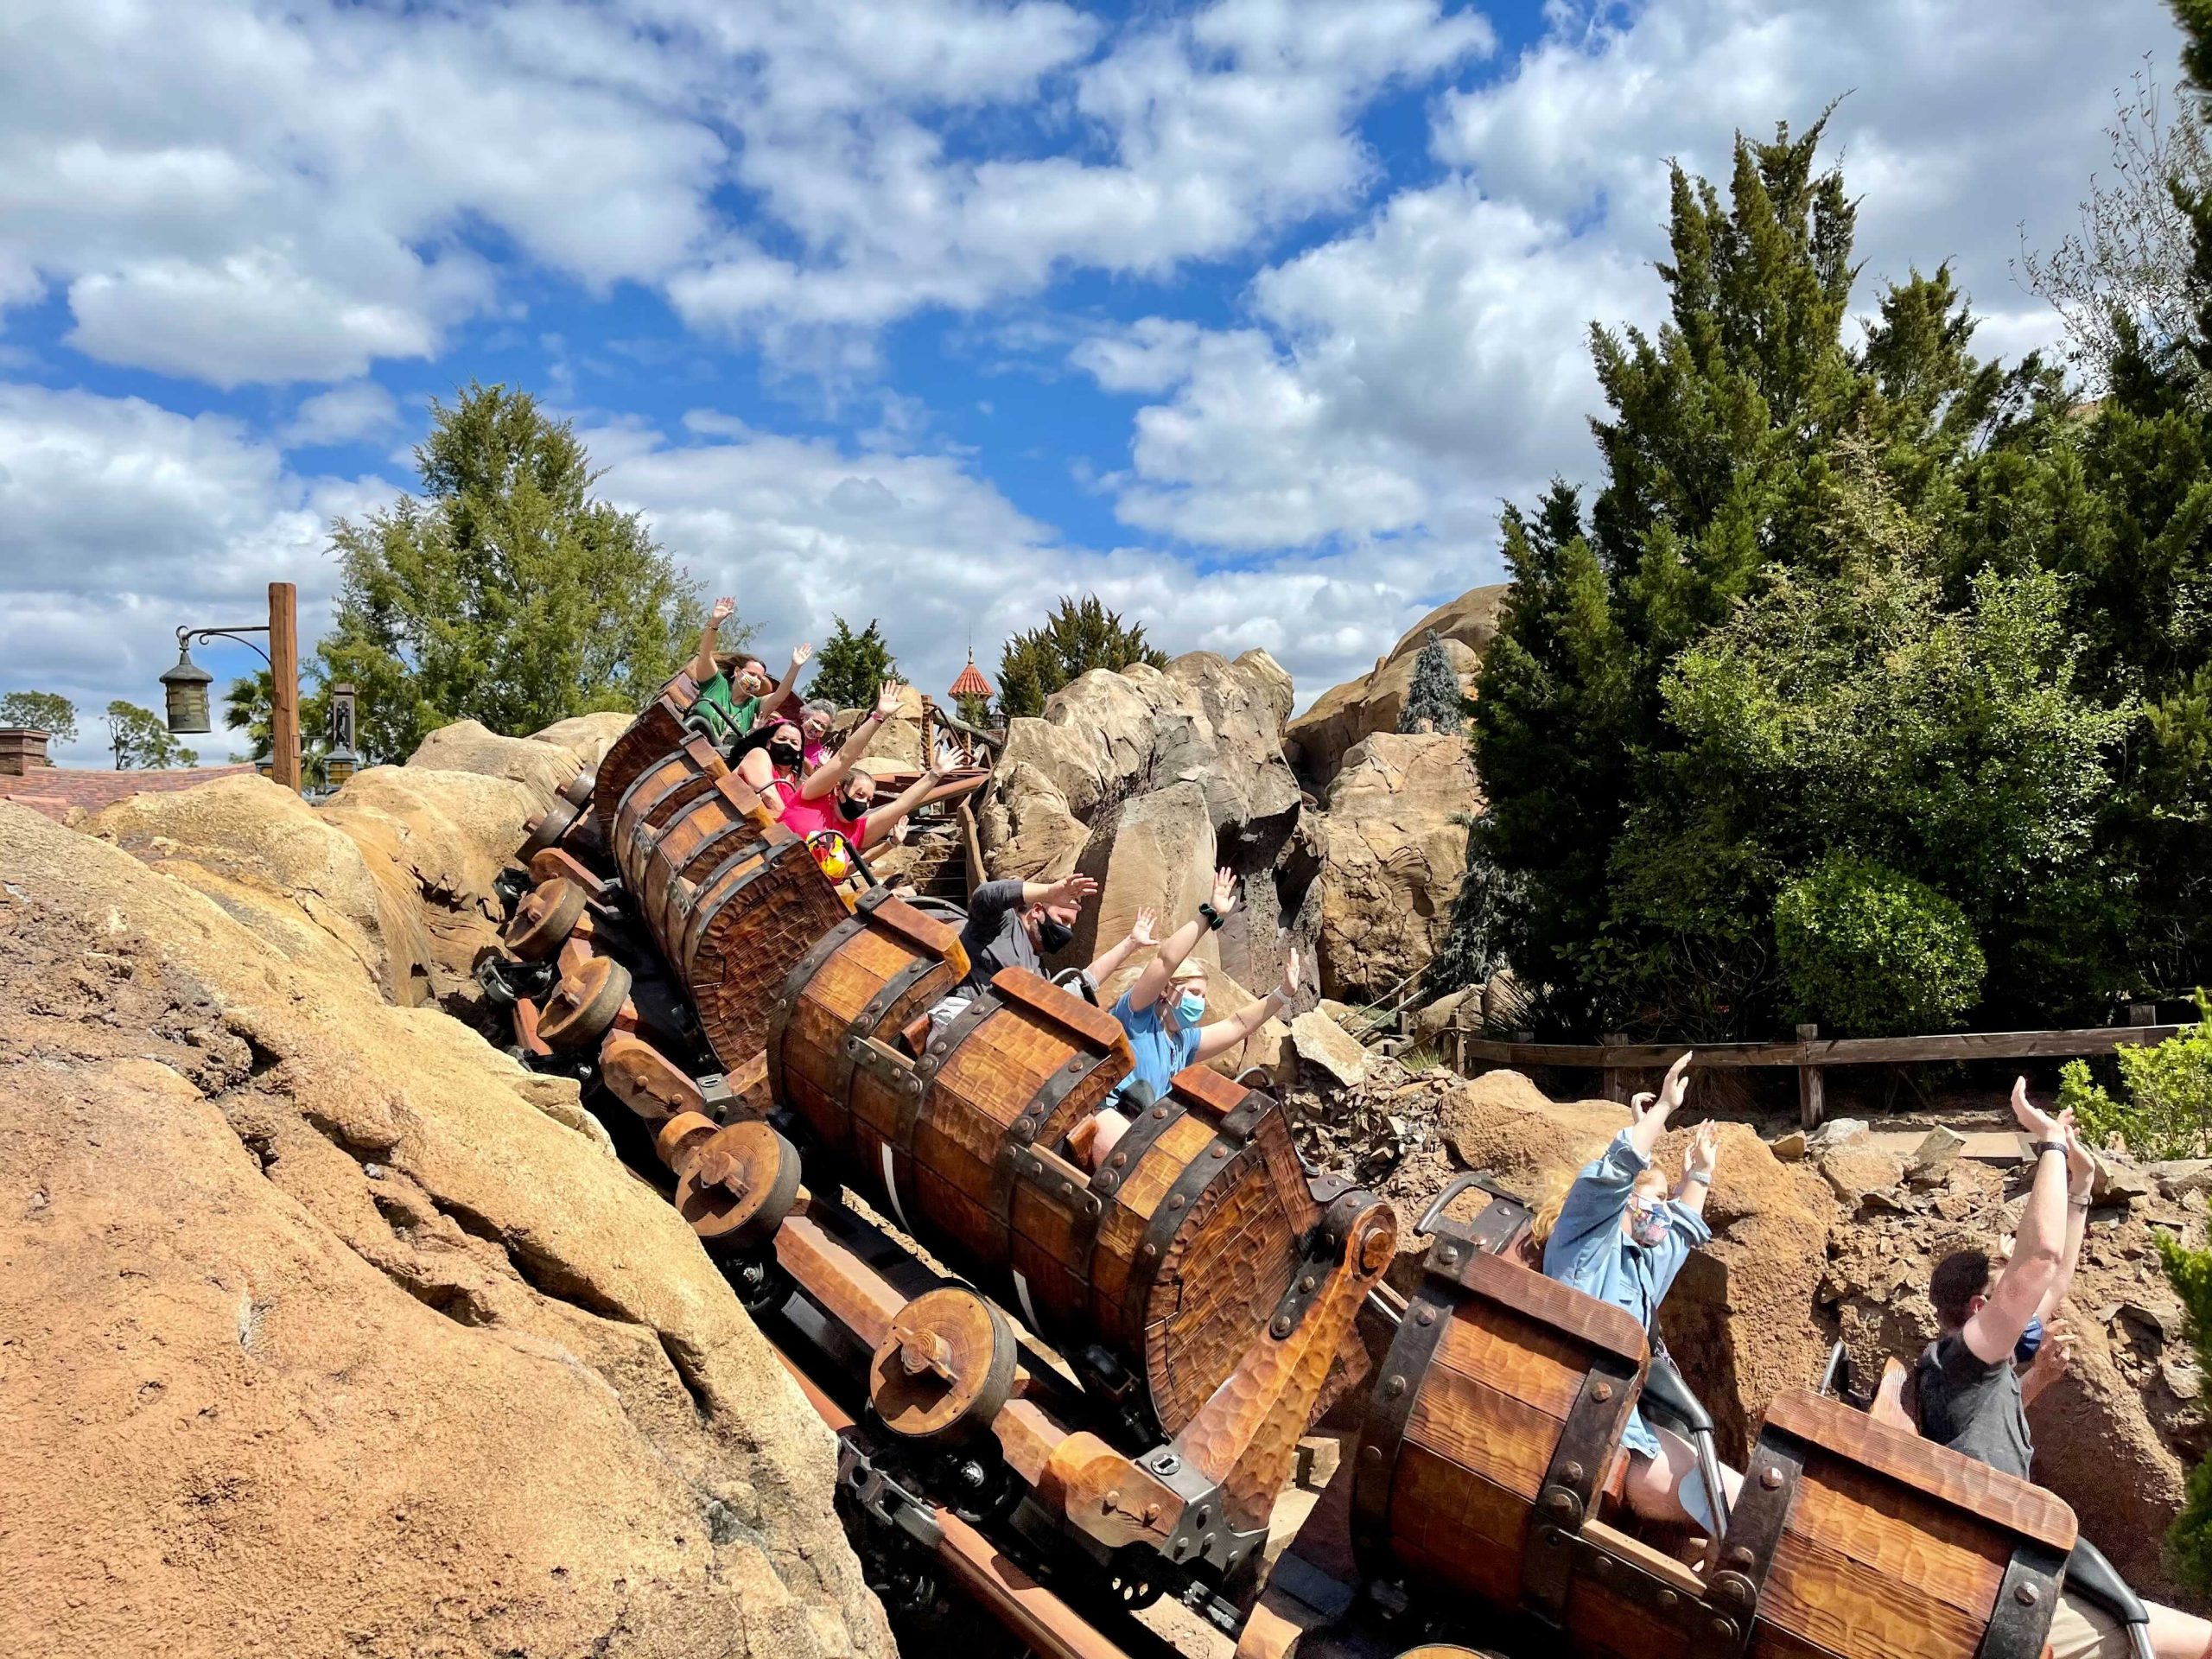
The impact of the party/non-party cycle is fully visible here. And actually, much more pronounced than I would have even expected. The last 4 days of this period tell a strong story, and hopefully make a strong case for avoiding the Magic Kingdom on non-party days. The 18th, 20th, and 22nd (not on this chart) are all party days, which means that early-Thanksgiving Week crowds wanting to experience nighttime in the Magic Kingdom were forced into the 19th and the 21st. It’s easy to see the results. The difference between a crowd level 3 (20th) and crowd level 8 (19th) is massive. The difference between 3 and 10 (21st) is insane. The posted wait time at Seven Dwarfs Mine Train peaked at 80 minutes on the 20th. The posted wait time was up at 240 minutes for almost an hour on the 21st. 3 times the wait. Not fun.

Each week, I’m giving you a very transparent look into how our crowd level predictions performed. Each day at each park is one data point, so we have 28 different crowd level predictions to evaluate each week. Any time a prediction is within one or two crowd levels, things won’t really “feel” much different than what we predicted. Being off by 3 or more crowd levels is where we’d like to be more accurate because you might feel that difference in wait times throughout the day.
In the past week, our predictions were either spot-on or within 1 crowd level 46% of the time. 86% of the time we were within 2 crowd levels, and that means we earn an B for our predictions these past two weeks. About the same as the last week. What’s different than last week is that we’re underpredicting crowds by quite a bit more. Over the last two weeks things were more even between overpredicting and underpredicting. On 4 different park days (out of 28), we missed crowds by 3 or more crowd levels. Thankfully, all of these were “just” misses by three crowd levels. Nothing liked the 4- or 5-level misses we had thanks to the rogue November hurricane!
Attraction Downtime 11/15 – 11/21
If we average out all of the capacity lost due to unexpected downtime over the past two weeks, it comes out to 5.4% of attractions unexpectedly being down. This is much higher than anything we’ve seen since mid-September, including the November hurricane week! The park with the biggest issues was Hollywood Studios, with 9.9% of capacity its lost due to unexpected downtime. You read that right. Essentially, 10% of Hollywood Studios was closed all week. That’s really not good.
The single worst day for attraction downtime in the past week was November 18th. On that day, 10% of all capacity at WDW was lost due to unexpected downtime. The single worst park-day of the week was also on November 18th, at Hollywood Studios. On that day, 20% of the the capacity at that park was lost due to unexpected downtime. That’s almost unbelievably bad. Hollywood Studios was open for 12.5 hours on that day, so 20% downtime is the equivalent of the whole park being down for 2.5 hours out of those 12.5 hours. I don’t know about you, but I’d be pretty upset if I paid for and showed up expecting a 12.5 hour park day and got 10 hours. But maybe that’s just me. Bonus, all of the closures definitely had an impact on crowd level, which was expected to be a 7 and ended up being a very painful 9.
Attraction Downtime
The worst offender was Tower of Terror, which was unexpectedly down for approximately 38% of the week. Over a third of the week! Our favorite fear hotel was down 90% of November 18th and never came back online on the 19th. Coming in 2nd place for unreliability this week was Splash Mountain, which was offline for 21% of the week.

Rope Drop Downtime
Here are this week’s problematic offenders:
- Magic Kingdom: Splash Mountain (unavailable for 48% of its first hour of the day), Pirates of the Caribbean (37% of its first hour of the day), PeopleMover (unavailable for 29% of its first hour of the day), Space Mountain (25% of its first hour of the day), and Jungle Cruise (unavailable for 25% of its first hour of the day)
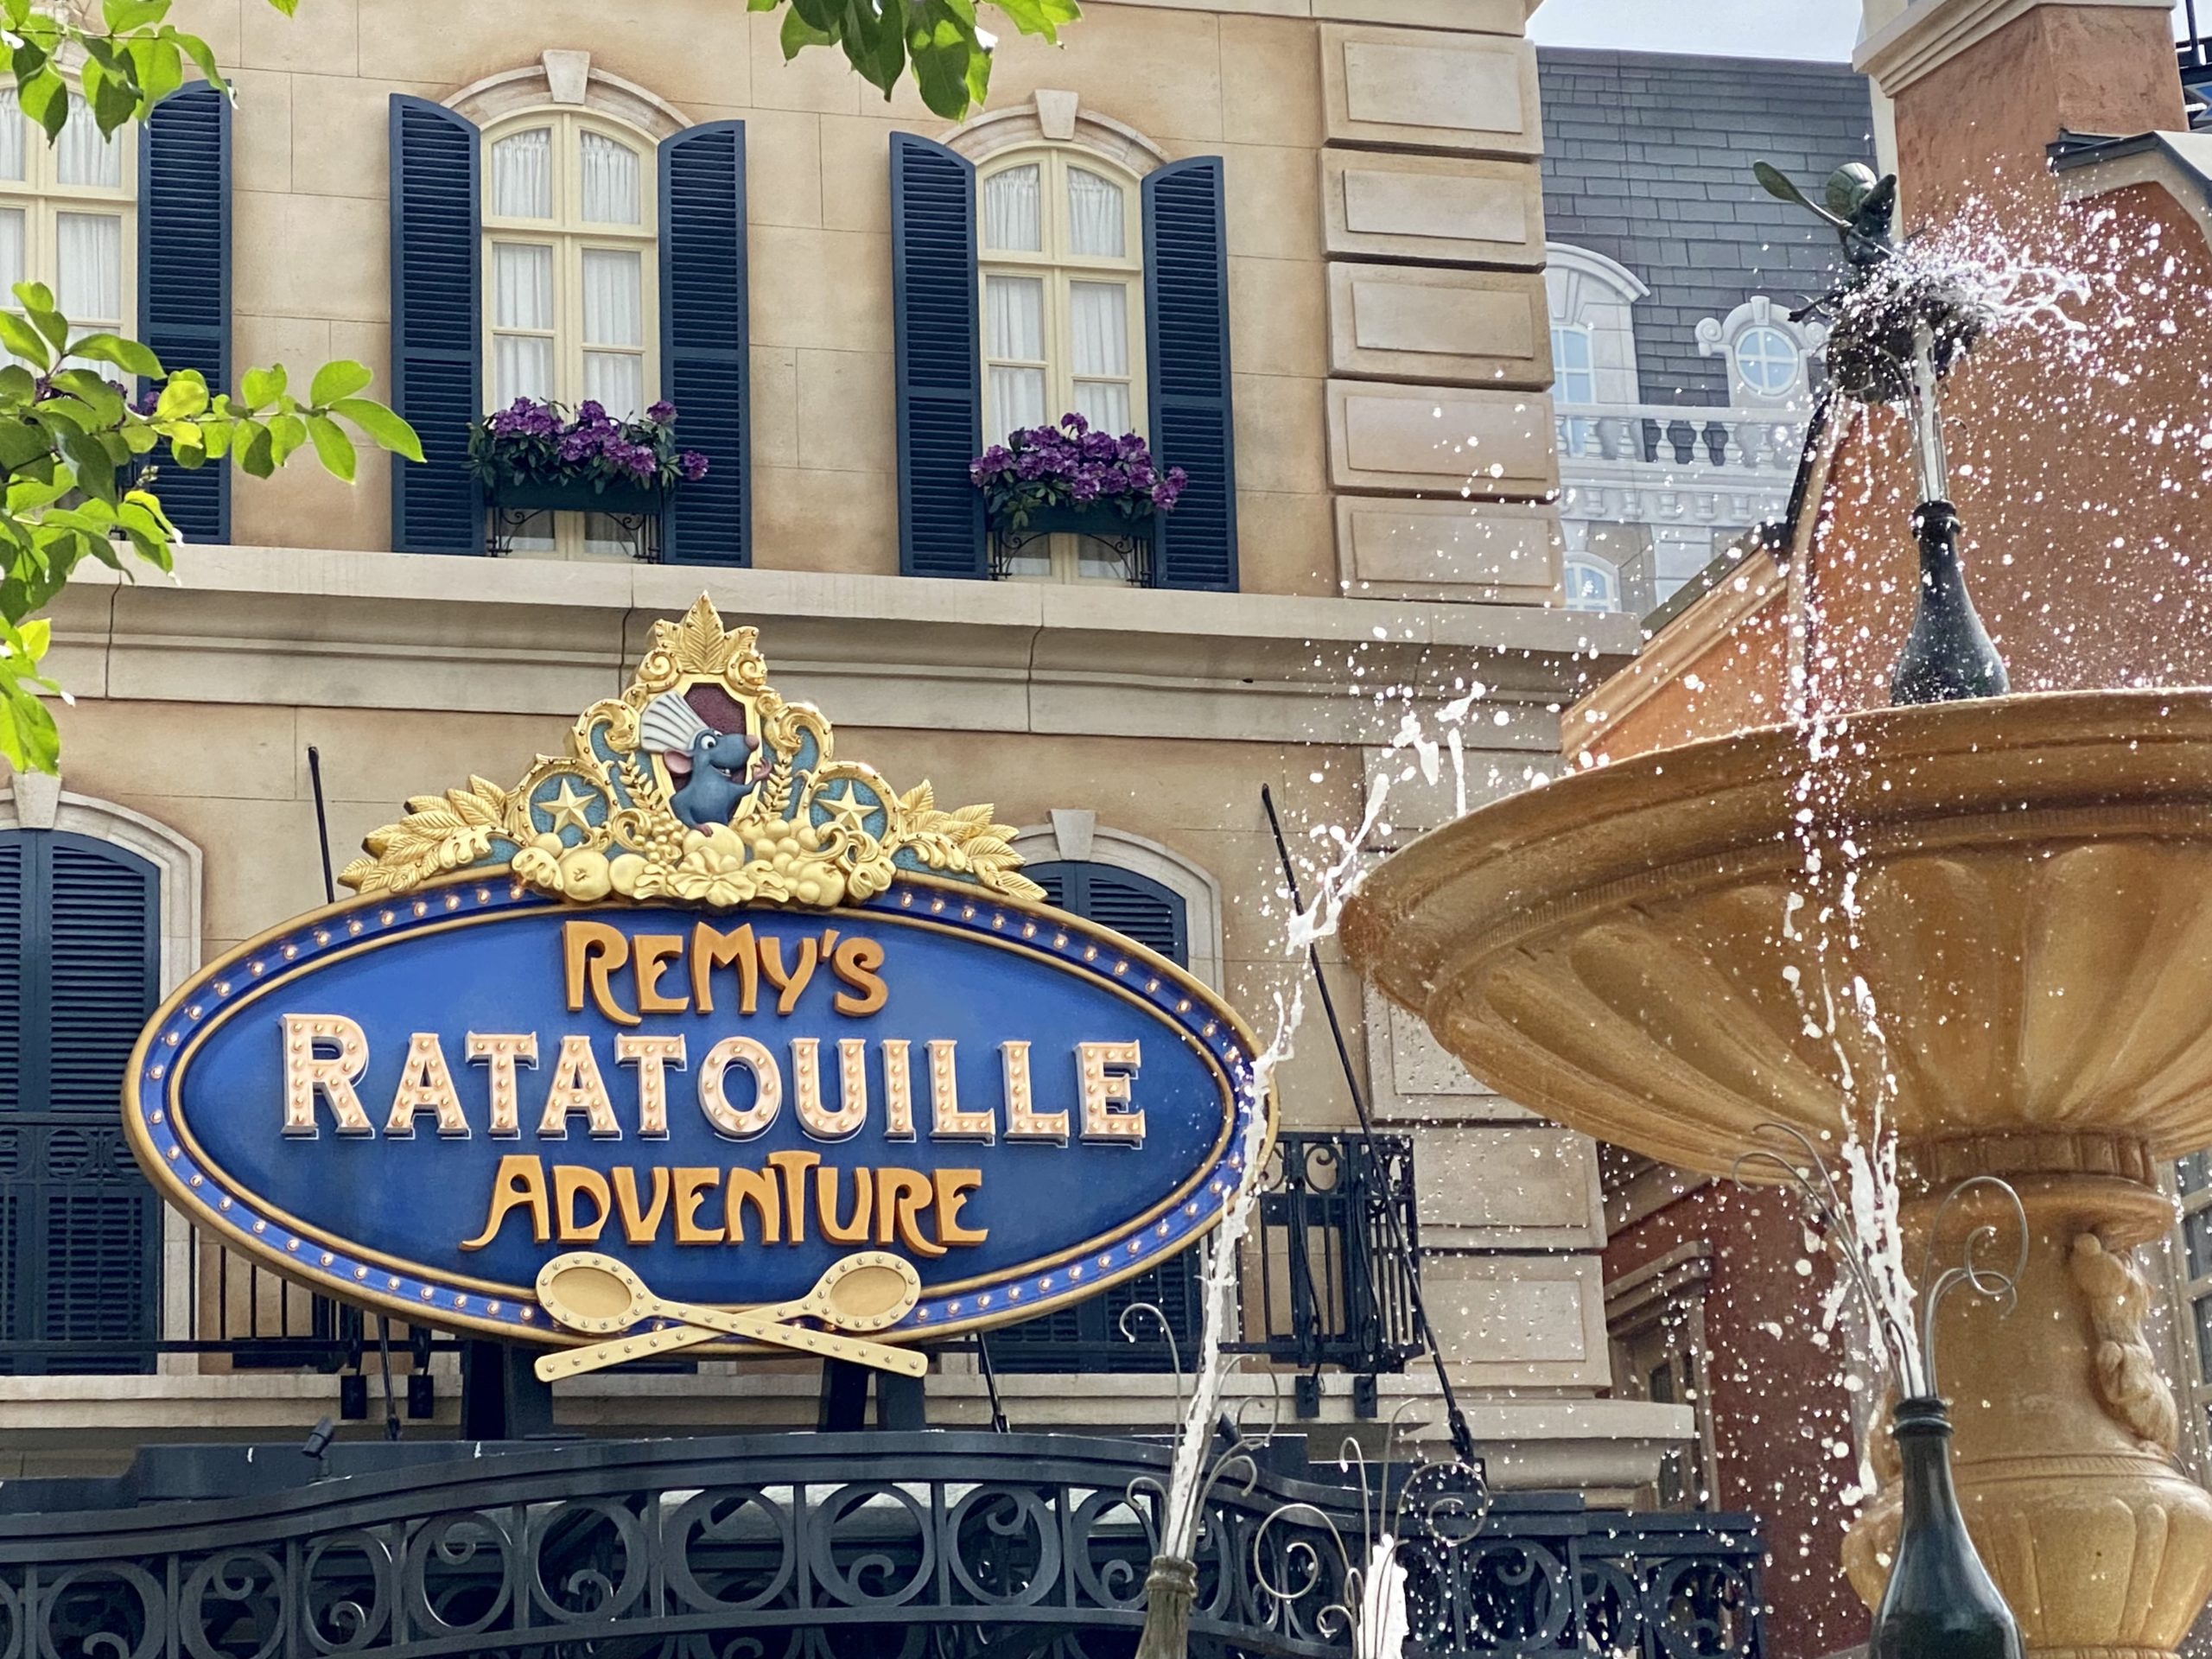
- EPCOT: Test Track (32% of its first hour of the day), Frozen Ever After (31% of its first hour of the day), Remy’s Ratatouille Adventure (27% of its first hour of the day)
- Hollywood Studios: Tower of Terror (unavailable for 50% of its first hour of the day), Alien Swirling Saucers (unavailable for 39% of its first hour of the day)
- Animal Kingdom: Expedition Everest (unavailable for 29% of its first hour of the day)
I don’t know if you noticed, but a lot of those percentages are pretty crazy high. A lot higher than the past two weeks. Things look especially ugly at Magic Kingdom, where you pretty much have to avoid the whole left side of the park in the morning, and at EPCOT, where all of the big three were reliably down during the first hour. You know, all of the things you should want to rope drop.
Wait Times 11/1 – 11/14
Attractions with the Highest Average Wait at each park
- Hollywood Studios: Tower of Terror, average posted wait of 109 minutes (87 minutes last week at Rise of the Resistance)
- Animal Kingdom: Flight of Passage, average posted wait time of 107 minutes (104 last week
- EPCOT: Remy’s Ratatouille Adventure, average posted wait time of 86 minutes (76 last week)
- Magic Kingdom: Seven Dwarfs Mine Train, average posted wait time of 70 minutes (63 last week)
Wait times got really dire at Hollywood Studios this week, and Tower of Terror suffered from a lot of downtime that impacted its wait times. Still, the increases at other parks were pretty remarkable even without all of the downtime problems.
Parks with the Highest and Lowest Average Wait
These parks likely won’t change week-to-week unless something ridiculous happens, but these data points will give us a high-level view of how wait times are trending from week to week.
- Highest: Hollywood Studios, average park-wide posted wait of 52 minutes (last week 45.5 minutes)
- Lowest: Magic Kingdom, average park-wide posted wait of 26 minutes (last week 25 minutes)
Thanks to those lower-crowd party days, Magic Kingdom continues to have the lowest average wait times. And Hollywood Studios continues to impress me with just how terrible that average wait is getting. I’ll be honest and say I didn’t expect it to get this much worse.
Most Inflated Posted Wait Times
We all know that Disney inflates their posted wait times on purpose. They have many reasons for doing this. Some are totally understandable, and some are potentially more problematic. We can figure out how much posted wait times are being inflated by comparing submitted actual wait times from the Lines App and the posted wait time when the person timing their wait entered the line.
From November 15th through 21st, actual wait times in the Lines App averaged 66% of what was posted. So if the posted wait time was 20 minutes, you could’ve expected to wait just over 13 minutes instead.
But the worst offender for the week was Seven Dwarfs Mine Train. Finally Tower of Terror gets a break … but maybe just because it was down so frequently throughout the week. At this one attraction, submitted actual wait times were 50% of posted wait times. That means if Seven Dwarfs Mine Train had a 80 minute posted wait, you probably would’ve waited just 40 minutes. Half of what was posted. Remember to always check the Lines app for predicted actual waits instead of believing what is posted.
Looking Ahead: November 22nd through 28th
Since it takes time to pull data and write a post, you’ll be reading this on the 23rd when the 22nd is already in the past. But we’re staying as close to real-time as possible.
It’s Thanksgiving week, and that means all of the humans will either be in NYC watching the parade, or in Disney World trying to find somewhere to eat turkey with their family. Expect a lot of really high crowd levels. Unless we get another freak hurricane or something.
This week we get a slight break from the party/non-party cycle at Magic Kingdom as the big executives at Disney allow Magic Kingdom to remain open late most nights this week to absorb all of those crowds. The only parties during the next week are on the 22nd and the 27th. So enjoy the reprieve … or understand that this really means crowds will just be wild every day anyway.
You May Also Like...
-

Happy November! This change of month means that it is officially holiday season at Walt Disney World. Decorations are up, the…
-

It's been a couple of weeks! And lots has been happening in the parks. Apparently when I was out on the…
-

How did park closures and airport shakeups impact crowds in the parks in the past week? And what can we expect…
-

We've thankfully had a much calmer week at Walt Disney World compared to the past few. Yes, Genie+ prices are still…