
Disney Data Dump October 5 2022
How did park closures and airport shakeups impact crowds in the parks in the past week? And what can we expect the rebound to look like now that everything is back open? Have I convinced enough people to go to Magic Kingdom on party days so that things have leveled out? Who are we kidding? You all are good at keeping that secret. But let’s take a look at what all of our fun data says for this week!

Observed Crowd Levels 9/27 – 10/3

Ooh, even with the closures and people cancelling or delaying their vacations, we still hit another crowd level 7 day by the end of this seven-day period. I would expect to see more of these 5s, 6s, and 7s moving forward now that hopefully the hurricane-related crowd anomalies have passed.

Expect to keep seeing this graph all of the way through the end of the year! Magic Kingdom crowd levels are most heavily impacted by Halloween party dates. That’s all. Saturdays and Wednesday are going to have ugly crowds. Party dates will be lovely. Visit on party dates. Please.

Each week, we’re looking at how our crowd level predictions have performed. Each day at each park is one data point, so this week we only have 20 different predictions to evaluate since the parks were closed for two days. Any time a prediction is within one or two crowd levels, things won’t really “feel” much different than what we predicted. Being off by 3 or more crowd levels is where we’d like to be more accurate because you might feel that difference in wait times throughout the day.
In the past week, our predictions were either spot-on or within 1 crowd level 90% of the time. Holy moly. This is tee best we’ve done by far since we’ve started tracking weekly. Yay for the hurricane not throwing us off! And 95% of the time we were within 2 crowd levels. We earn an A for these results. On one park days, we were off by 3 or more crowd levels. On October 2nd, we predicted that EPCOT would see a crowd level 6, and instead it was a 2. Much, much less crowded than expected. Hooray for anyone that went to EPCOT on that day!
Attraction Downtime 9/27 – 10/3
If we totally ignore the two day that the parks were closed for Ian (otherwise they’re both 100% capacity offline, so … boo), and then we average out all of the capacity lost due to unexpected downtime over the other 5 days in the past week, it comes out to 6.6% of attractions unexpectedly being down. This is significantly worse than either of the weeks we’ve tracked this metric so far. But this isn’t a huge surprise since there was bad weather and then some operational issues when the parks reopened. The park with the biggest issues was Magic Kingdom (10.2% of capacity lost), and it’s not even close. This is our third week, and our third different unreliable park. 10.2% of Magic Kingdom being down, on average every day is huge. This has a big impact on wait times on things that are actually open. If we remove the data from Magic Kingdom, the other three parks only averaged 4.3% downtime throughout the week, which is equivalent to the number we saw two weeks ago.
The single worst day for attraction downtime in the past week was September 30th. On that day,11% of all capacity at WDW was lost due to unexpected downtime. That’s really ugly, and reflects the issues that resulting from bringing all of the parks back online post-hurricane. The worst single park-day for downtime was at Magic Kingdom on September 30th, when 18% of capacity was offline throughout the day. So, out of every 5 attractions in the park, 1 was almost always down. Not a great look. Thankfully, the observed crowd level was still just a 2. I bet it could’ve been a 1 if everything had been reliably up and running.
What about at the attraction level? The worst offender was PeopleMover, which was unexpectedly down for over 53% of the week, including being down 97% of the day on October 1st. By far our worst performance for any ride for any day of the week. Next in line was Pirates of the Caribbean, which was offline for 38% of the week. On its worst day – September 30th, it lost 92% of its capacity. Next on the list of “most unavailable” was Expedition Everest, which was down 19% of the week.
And what about those problematic rope drop rides that you should try to avoid in the first hour of the day?
- Magic Kingdom: PeopleMover (unavailable for 67% of its first hour of the day), Splash Mountain (unavailable for 50% of its first hour of the day), and Pirates of the Caribbean (unavailable for 50% of its first hour of the day)
- EPCOT: Test Track (unavailable for 23% of its first hour of the day), and Frozen Ever After (unavailable for 22% of its first hour of the day)
- Hollywood Studios: Slinky Dog Dash (unavailable for 20% of its first hour of the day) and Rise of the Resistance (unavailable for 19% of its first hour of the day)
- Animal Kingdom: TriceraTop Spin (unavailable for 22% of its first hour of the day)
Just like last week, probably you shouldn’t rope drop TriceraTop Spin. On many levels you should just not do that. The big standout for me on this list is Hollywood Studios. If you have early entry, Rise of the Resistance and Slinky Dog Dash are the two rides you should try to hit before the park opens. If they’re not reliably open during that time, you absolutely need to have a backup plan.

Wait Times 9/27 – 10/3
Attractions with the Highest Average Wait at each park
- Hollywood Studios: Rise of the Resistance, average posted wait time of 81 minutes (88 last week)
- Animal Kingdom: Flight of Passage, average posted wait time of 58 minutes (71 last week)
- EPCOT: Frozen Ever After, average posted wait time of 61 minutes (65 last week)
- Magic Kingdom: Seven Dwarfs Mine Train, average posted wait time of 60 minutes (58 last week)
On the whole, these highest wait times are slightly lower than last week (but slightly higher than the week before that). It’s pretty easy to assume that had the hurricane not blown through, these wait times would have been similar to or higher than last week. In fact, thanks to operational issues at Magic Kingdom, it already was higher than it was last week. I expect all of these to be higher next week when we check again.
Parks with the Highest and Lowest Average Wait
These parks likely won’t change week-to-week unless something ridiculous happens, but these data points will give us a high-level view of how wait times are trending from week to week.
- Highest: Hollywood Studios, average park-wide posted wait of 40 minutes (last week 41 minutes)
- Lowest: Magic Kingdom, average park-wide posted wait of 23 minutes (last week, Magic Kingdom with 23 minutes)
Once again, those low-crowd party days at Magic Kingdom is driving down average wait times. But Magic Kingdom really is a tale of two parks. On party days, the average wait was 18.5 minutes. On non-party days, it went up to 31 minutes. Multiple that 12.5 minute difference by all of the attraction you do in a day, and you’re saving many hours by going on a party day.
Most Inflated Posted Wait Times
We all know that Disney inflates their posted wait times for some legitimate (and questionable) reasons. We can figure out how much posted wait times are being inflated by comparing submitted actual wait times from the Lines App and the posted wait time when the person timing their wait entered the line.
From September 27th through October 3rd, actual wait times in the Lines App averaged 66% of what was posted. So if the posted wait time was 20 minutes, you could’ve expected to wait just over 13 minutes instead.
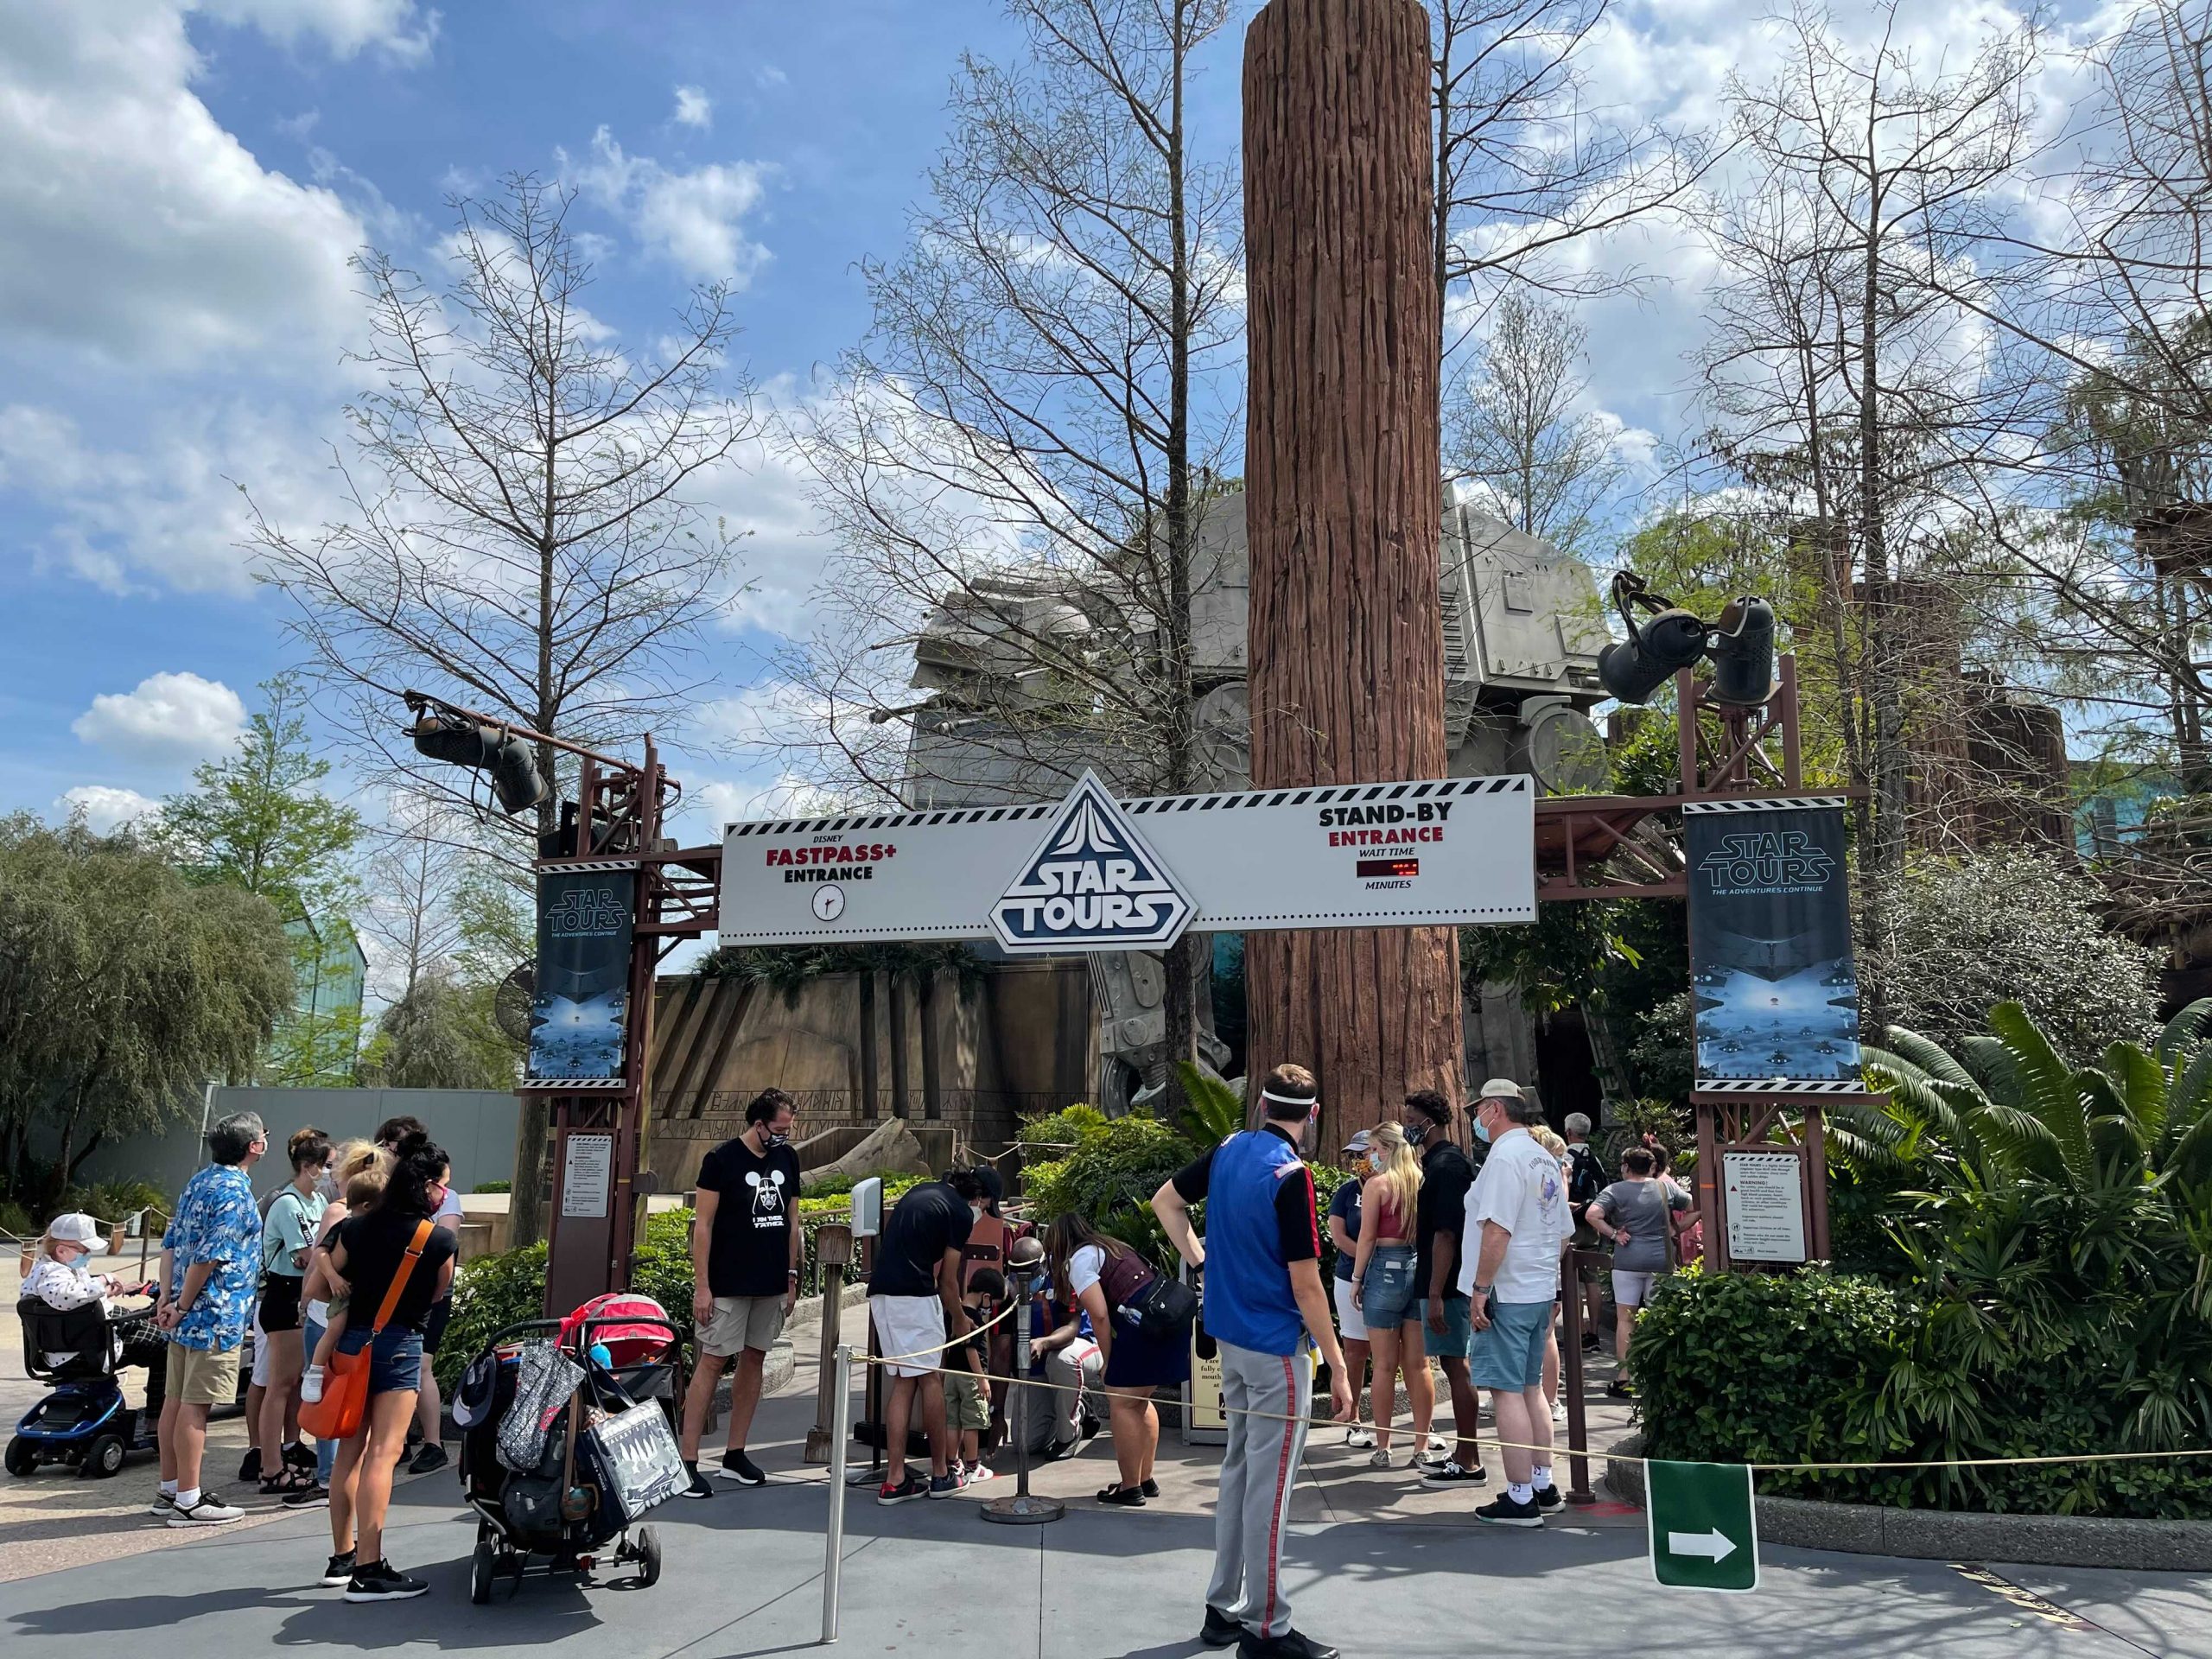
But the worst offender for the week was Star Tours. At this one attraction, submitted actual wait times were 50% of posted wait times. That means if Star Tours had a 20 minute posted wait, you probably would’ve waited 10 minutes. Only half of what was posted. Remember to always check the Lines app for predicted actual waits instead of believing what is posted.
Looking Ahead: October 4th through 10th
Hopefully we experience quite a bit more normalcy over the next week. There are Halloween parties on the 4th, 6th, 7th, and 10th. So expect high crowds on the 4th, 8th and 9th. Hopefully since the 8th and 9th have two non-party days back to back, things won’t be quite as bad.
No storms (or rain at all really) are predicted for this week, so weather-related closures should be at a minimum. Otherwise, crowds should be on a bit of an upswing, especially with several school districts being off on the 10th.
It also seems like a great week for certain a Disney Data writer to have a birthday … but I wouldn’t know anything about that.
Are there any other data points you’d like to learn about on a weekly basis? What information would you like to know for your upcoming trip? Disney Data Gold Starts will be awarded this week to anyone who drops a fun data joke in the comments in order to celebrate a nerdy birthday 🙂
You May Also Like...
-

New blog series, who dis? We know that you come to TouringPlans because of all of our data. And other than…
-

Well, this is a fun and weird week for our second-ever Disney Data Dump! We'll see next week how Hurricane Ian…
-

A small bit of DCL news dropped today with dates for sailings in late April and May 2022 for the Disney…
-

Holy crowds, Batman! Spiderman? Fall is here, and so are the beginnings of October crowds, ramping up into the holiday seasons…
The Tower of Terror wait times have greatly increased on my future touring plans, and it is competing with Slinky (or outweighing Slinky) for top genie+ priority. What is your thought on rope dropping Tower since that is my kid’s #1 request? Will it take up all of early hours to get on and off that one? Thanks!!!
Since it does have a lengthy pre-show, it might take up quite a bit of early entry. Typically, the best early entry plan is to hit Rise of the Resistance before early entry starts (it tends to open 20ish minutes before early entry starts), then Slinky, then Tower. That strategy, 75% of the time should get you to Tower right as the park officially opens, before the real crowds crush it.
Will MK have low lines on MVMCP days too? Our trip was cancelled during the week analyzed here, and I’m trying to plan a reschedule.
Love the data!
We fully expect to see the same behavior with MVMCP party days too.
LL availability looks worse than in the summer? Any insight?
I’ll try to look at it again, but with increasing crowds does come decreasing availability.
I get that but are crowds higher now than summer?
Trending that way, yes.
Let me be the first to predict that as we get into cooler weather, we’ll see more first hour of the day shutdowns, especially on the outdoor roller coasters.
“There are Halloween parties on the 4th, 6th, 7th, and 10th. So expect high crowds on the 4th, 8th and 9th.” Shouldn’t one of those 4th”s be a 5th?
Happy birthday to the mom of the Minniemes.
Well, it should be. This is what happens when certain people write their articles late the night before. Thanks for the call-out!
Happy Birthday! Wishing you a high R^2 value on your data! Our family is headed to the parks in a few weeks and we are taking your advice and switched from a normal park hours day at MK to a party day. Wish us luck! Will you be releasing any new data regarding Genie+ availability? Trying to solve the Frozen/Remy/Test Track morning conundrum. No early morning hours for us.
Released that just a couple of weeks ago – probably won’t refresh again before your trip. Wishing you all much statistical significance to your vacation!
Happy Birthday! I’m sure you know that there are two kinds of data scientists. 1.) Those who can extrapolate from incomplete data.
Gold star for you, Beth! That’s an excellent one 🙂
Happy Birthday!
Happy birthday! Do you expect that the MK crowds will be similar during the Christmas parties with low waits on party days? (Except perhaps the week between Christmas/New Year)
Thank you, Dave!