
Disney Data Dump September 9 2026
Labor Day weekend tried its best to make Walt Disney World feel crowded again. It succeeded…sort of. With waits that were still below-average overall, it was a noticeable bump compared to the rest of this summer, but still very mild by actual Walt Disney World standards.
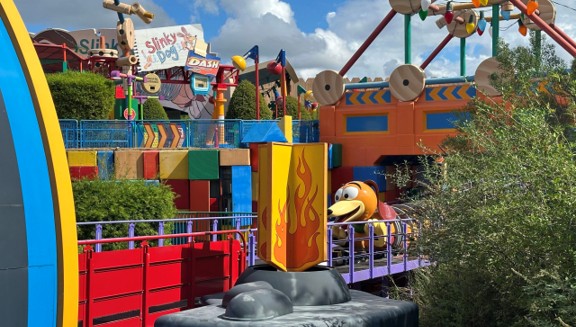
The much bigger story this week was attraction reliability. Slinky Dog Dash was down for more than half of the week, Test Track somehow tried to compete with that number, and a whole collection of headliners struggled at rope drop. And yet every park still averaged less than a 30-minute posted wait. So this week we’re digging into what happens when a holiday weekend, very low underlying crowds, and some spectacularly bad downtime all collide.
Observed Crowd Levels September 1 – 7
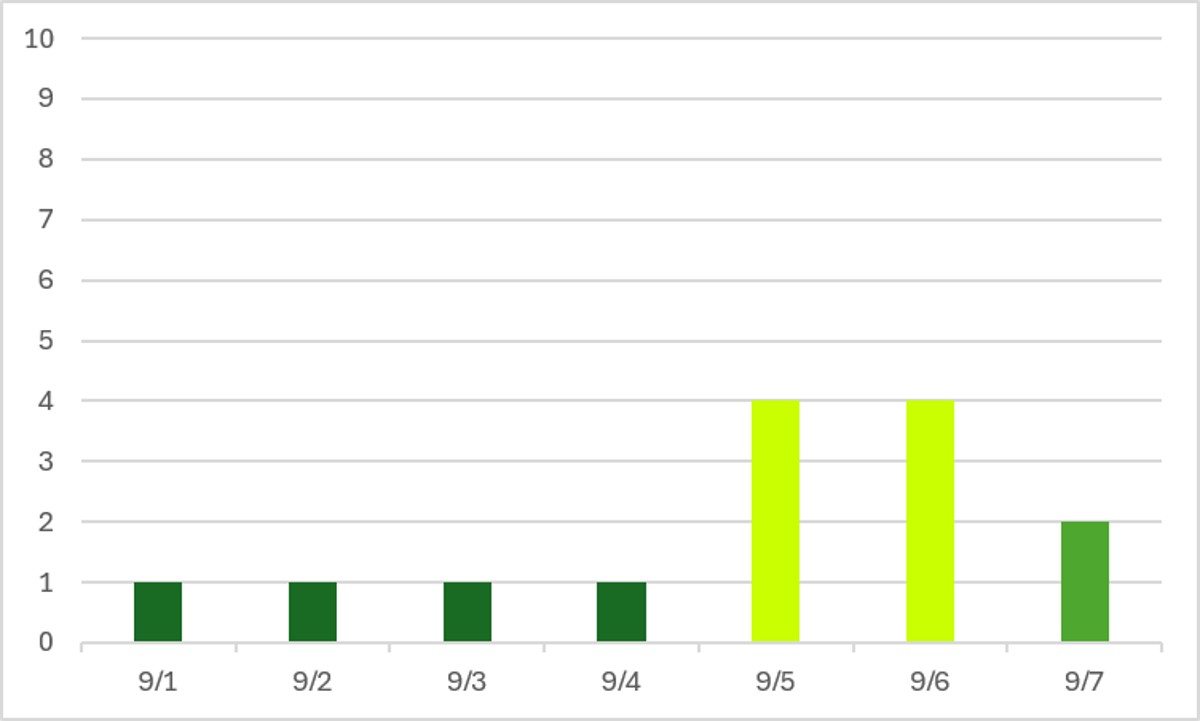
As far as holiday weekends go, this is a pretty mild one! Leading up to the long weekend (and even on Friday), wait times stayed at their incredible lows from the past two weeks. But then the long weekend arrived, and so did … some crowds. All the way up to a crowd level 4 for a couple of days! But Monday barely managed a crowd level 2, despite the holiday.
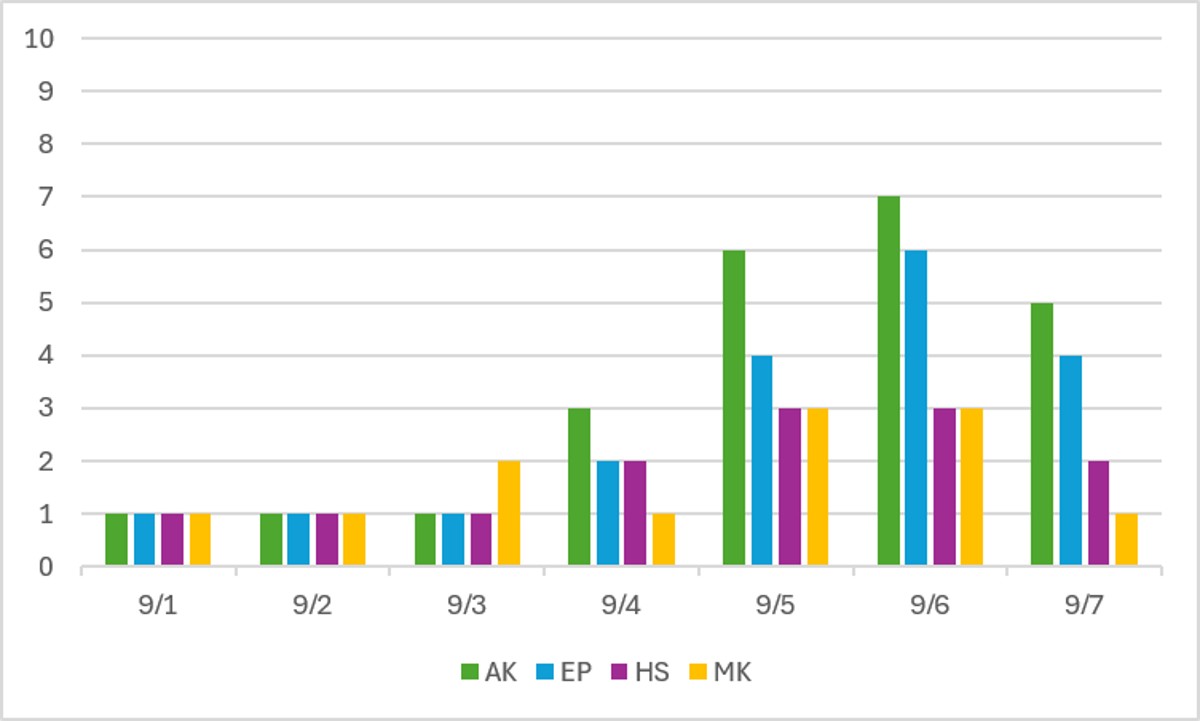
At the park level, we get even more information about what that holiday weekend looked like! Halloween parties at the Magic Kingdom only happened on the 1st and 4th – based on the park-level results from the 7th you might think one happened that day too! Not so, the party was on the 8th instead. Magic Kingdom and Hollywood Studios both never got over a crowd level 4. Wait time spikes at Animal Kingdom and EPCOT are what drove the overall crowd level 4 results. And EPCOT actually emptied out more on Monday than the results show – Cosmic Rewind was just closed for a significant period of the day and when it opened up, its wait times went wild (going as high as 190 minutes), which significantly impacts the crowd level for the park as a whole.
Performance of Crowd Level Predictions
Each week, I give you a very transparent look into how the TouringPlans crowd level predictions performed. Each day at each park is one data point, so each week we have 28 different crowd level predictions to evaluate. Any time a prediction is within one or two crowd levels, things won’t really “feel” much different than what was predicted. Being off by 3 or more crowd levels is where you might feel that difference in wait times throughout the day.
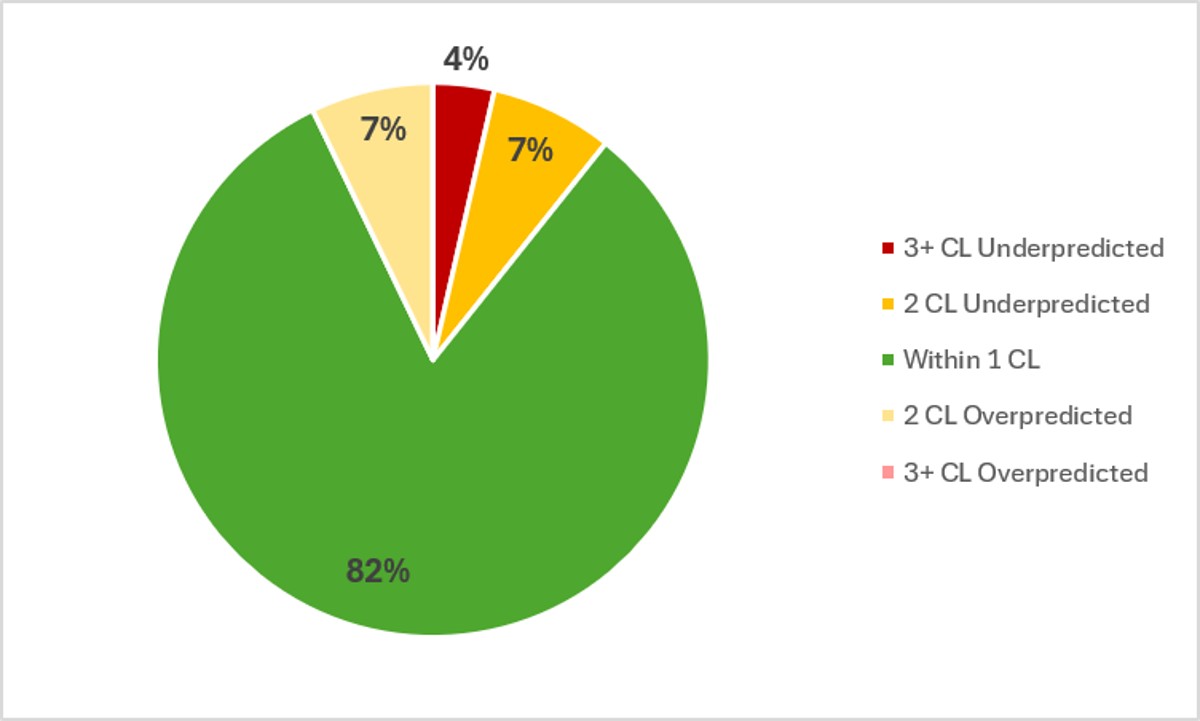
In the past week, Touring Plans predictions were either spot-on or within 1 crowd level 61% of the time, which is lower than we’ve seen over the past several weeks. And 86% of the time Touring Plans predictions were within 2 crowd levels, so that’s a solid B on predictions for the last week. Late August crowds levels are somehow even lower than the low crowds predicted. Hooray! The two biggest misses of the week were overpredictions by 4 crowd levels – both on August 30th, at Animal Kingdom (predicted 6, observed 2) and EPCOT (predicted 5, observed 1).
Attraction Downtime September 1 – 7
If we average all of the capacity lost due to unexpected downtime over the past week, it comes out to 7.4% of attractions unexpectedly being down. This is, once again, WAY over our “normal” WDW summer average – and even higher than our 7.2% result last week. Over the past week, Animal Kingdom was the park with the worst overall downtime, averaging 10.9% of its capacity lost to downtime. And Hollywood Studios was the next-worst, with 8.7% of its capacity lost throughout the week.
The worst day for attraction downtime in the past week was on September 2nd. On that day, 12% of all capacity at WDW was lost due to unexpected downtime – and just like our worst day last week, that was mostly due to a bunch of rain. And we have a terrible tie for the worst park-day of the past week, also on September 2nd, when 20% of BOTH parks’ capacity was lost due to unexpected downtime. Hollywood Studios was open for 12 hours on the 2nd, so 20% downtime is the equivalent of the whole park being closed for 144 minutes out of its 12 hour day. And Animal Kingdom was open for 10 hours on the 2nd, so 20% downtime there is the equivalent of the entire park shutting down for 120 minutes. That’s a messy day.
Attraction Downtime Worst Offender
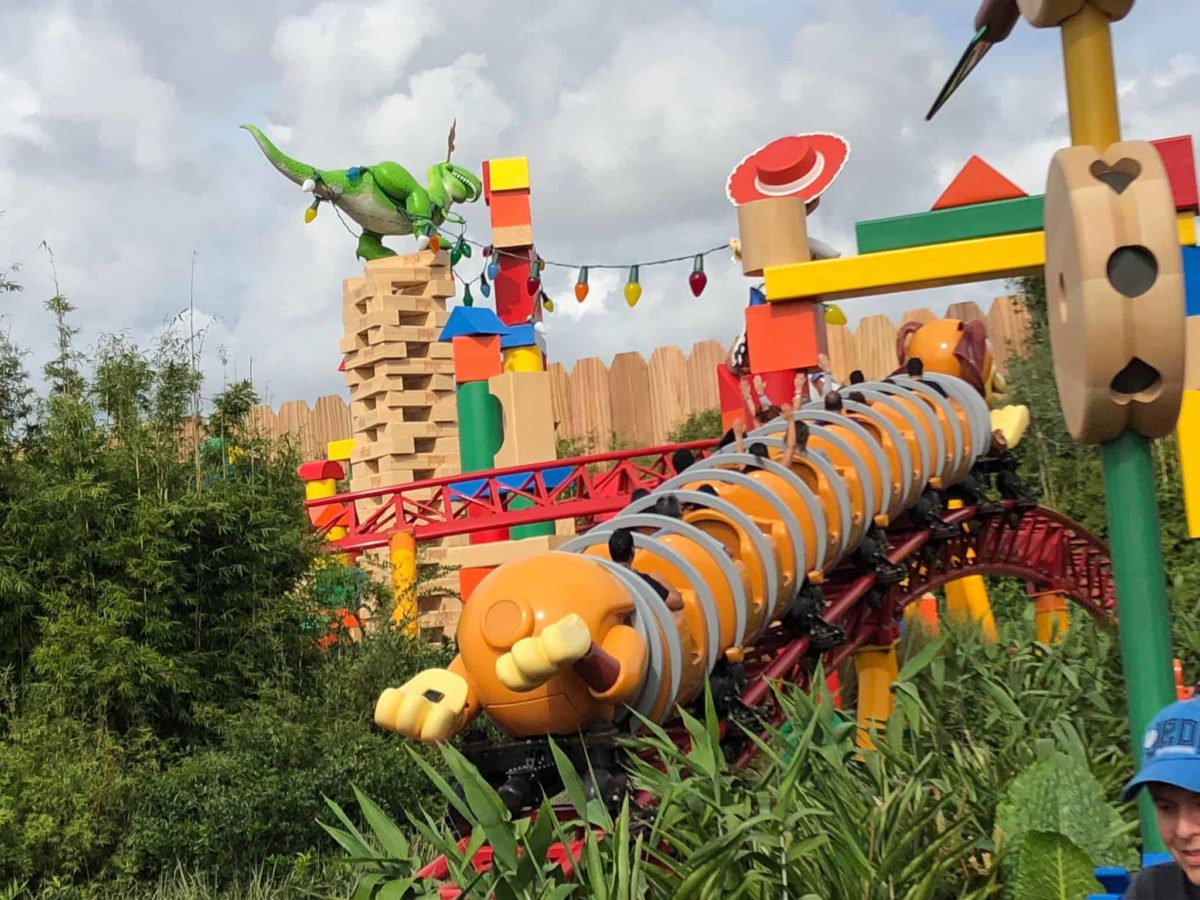
For the second week in a row, Test Track gets a reprieve from topping our downtime list. And just like last week, Slinky Dog Dash is the attraction with the worst overall downtime this week, and it was unexpectedly down for a sad 55% of the week. Slinky actually shut down around 6 pm on Sunday, August 30th, and didn’t truly come back online until after 11:30 am on September 4th! Disney hasn’t said what happened, but that much extended downtime is very rare.
Test Track isn’t totally off naughty list this week though – it had one of its worst downtime weeks of the summer too, with 41% of its capacity lost to unexpected downtime. That’s even worse than last week’s 35%.
Rope Drop Downtime
Take a deep breath, prepare yourself, this is quite a list this week. Here are problematic offenders from the past week, with the percentage of downtime during the first hour of the day in parentheses:
- Magic Kingdom: Tiana’s Bayou Adventure (31%), Tron (18%), Space Mountain (16%), Astro Orbiter (15%), The Many Adventures of Winnie the Pooh (12%), Haunted Mansion (11%)
- EPCOT: Spaceship Earth (21%), Cosmic Rewind (15%), Test Track (15%), Frozen Ever After (11%), The Seas with Nemo (10%)
- Hollywood Studios: Slinky Dog Dash (59%), Rise of the Resistance (20%), Rock’n’Roller Coaster (15%)
- Animal Kingdom: Expedition Everest (18%), Kali River Rapids (13%)
While overall the length of these lists isn’t terrible, there are a lot of headliners on them! This was a difficult week for getting your headliner rope drop plan “right,” and really emphasizes the need for a plan B … and C.
Wait Times September 1 – 7
Attractions with the Highest Average Posted Wait at Each Park
- Hollywood Studios: Slinky Dog Dash, average posted wait of 80 minutes (was 60 minutes last week)
- EPCOT: Cosmic Rewind, average posted wait of 75.5 minutes (was 68 minutes last week)
- Magic Kingdom: TRON, average posted wait time of 53 minutes (was 44 minutes last week)
- Animal Kingdom: Flight of Passage, average posted wait time of 38 minutes (was 36 minutes last week)
It’s pretty easy to see the impact of a few major wait time drivers in our headliner waits here. First, Slinky Dog Dash was down for over half of the week. So it’s not surprising that when it was open, it had MUCH higher waits than the previous week. It was also closed for much of that rock-bottom-crowd-level period at the beginning of the week, so it didn’t have those lower waits to counteract the holiday weekend.
The other is that holiday weekend. Half of the week was very very empty, but Saturday and Sunday had almost-moderate waits, which increases those average wait times for the week at our headliners.
Parks with the Highest and Lowest Average Wait
- Highest: Hollywood Studios, average park-wide posted wait of 28.5 minutes (was 27.5 minutes last week)
- Lowest: Magic Kingdom, average park-wide posted wait of 17.5 minutes (was 15.5 minutes last week)
I got several messages about HoW cRoWdEd the parks were over Labor Day weekend, and how it was unfair to call out this holiday as a good one for heading to WDW. I’d like to point out that all four parks were still under our “the parks are very uncrowded!!” number, which is an average wait of 30 minutes for the park as a whole. Yes, crowd level 4 waits feel a lot different than the crowd level 1 and 2 waits that we’ve seen most of the summer. But it’s nothing compared to what we’ll see later this fall and over the winter. So brace yourselves if you thought this holiday weekend was crowded.
Most Inflated Posted Wait Times
We all know that Disney inflates their posted wait times on purpose. They have many reasons for doing this. Some are totally understandable, and some are potentially more problematic. We can figure out how much posted wait times are being inflated by comparing submitted actual wait times from the Lines App and the posted wait time when the person timing their wait entered the line.
Over the past week, actual wait times in the Lines App averaged 72% of what was posted. That’s a little lower our historical average in the era of Lightning Lanes, which means that posted waits were slightly more inflated than normal. Overall, if the posted wait time at a popular attraction was 60 minutes, you could’ve expected to wait less a little more than 43 minutes instead.
But the worst inflation offender for the past week was Gran Fiesta Tour. At this one attraction, submitted actual wait times were only 36% of posted wait times in the past week. That means that if Gran Fiesta Tour had a 10 minute posted wait, you probably would have actually only waited a little over 3.5 minutes instead. About a third of what was posted!

This Week’s Wait Time Rock Star
Between September 1st and 7th we had just under 1400 timed actual waits submitted through the Lines app. And the person who recorded the most actual waits during that time was EftelJuddi, with 59 overall timed waits – 54 standby waits and 5 single rider waits. Thanks for all of that timing, EftelJuddi! It unfortunately does not compete with the the 97 timed waits in a single week from our current timing champion, preef.
Looking Ahead: September 8 – 14
I write this article on Tuesday evenings so that you all have the very freshest of data on Wednesdays. That means the 8th will already be in the past by the time you’ve read this, so you’re living in the future now!
We’re entering into a more dense calendar of Halloween parties, which means that we only three parties in the next seven days – on September 8th, 11th, and 13th. There is also a party on the 15th, which isn’t during this week, but does mean that the 14th is surrounded by two party days. In fact, the 12th and 14th will easily be the worst days to spend in Magic Kingdom over the coming week, but are also your only options for seeing Starlight and Happily Ever After between the 11th and 15th.
We have a new EPCOT Food & Wine Festival booth opening the day this article posts (September 9th), but that shouldn’t have a gigantic impact on wait times at the park – lines just may be a little longer at the new booth on its first day, before things settle back down.
Otherwise, nothing remarkable is happening in the parks over the next week. Expect low crowds until fall break season starts back up at the end of September and beginning of October.
And we’re still in afternoon thunderstorm season, with plenty of rain being called for every day of the next week. Highs will be right around 90, and humidity will make it feel quite a bit warmer, so be prepared for heat AND rain if you’re visiting this week.
Were you in the parks this past week? Or are you headed to Orlando soon? Let me know in the comments below!
You May Also Like...
-

If crowds were going to show up for summer, surely it would've been over the July 4th holiday weekend. Instead, we…
-

Mid-September is doing exactly what mid-September should do: giving us gloriously low crowds, with just enough weirdness underneath the surface to…
