
Disney Data Dump September 30 2026
And the really interesting stuff is happening underneath those overall numbers. Halloween parties are creating increasingly dramatic swings at Magic Kingdom, Food & Wine is giving EPCOT its own very predictable weekend pattern, and Wednesdays and weekends at Animal Kingdom feel like entirely different parks. Add in some surprisingly decent downtime numbers and a few headliners that are still deeply committed to chaos, and we’ve got plenty to dig into before October really gets going.
Observed Crowd Levels September 15 – 28
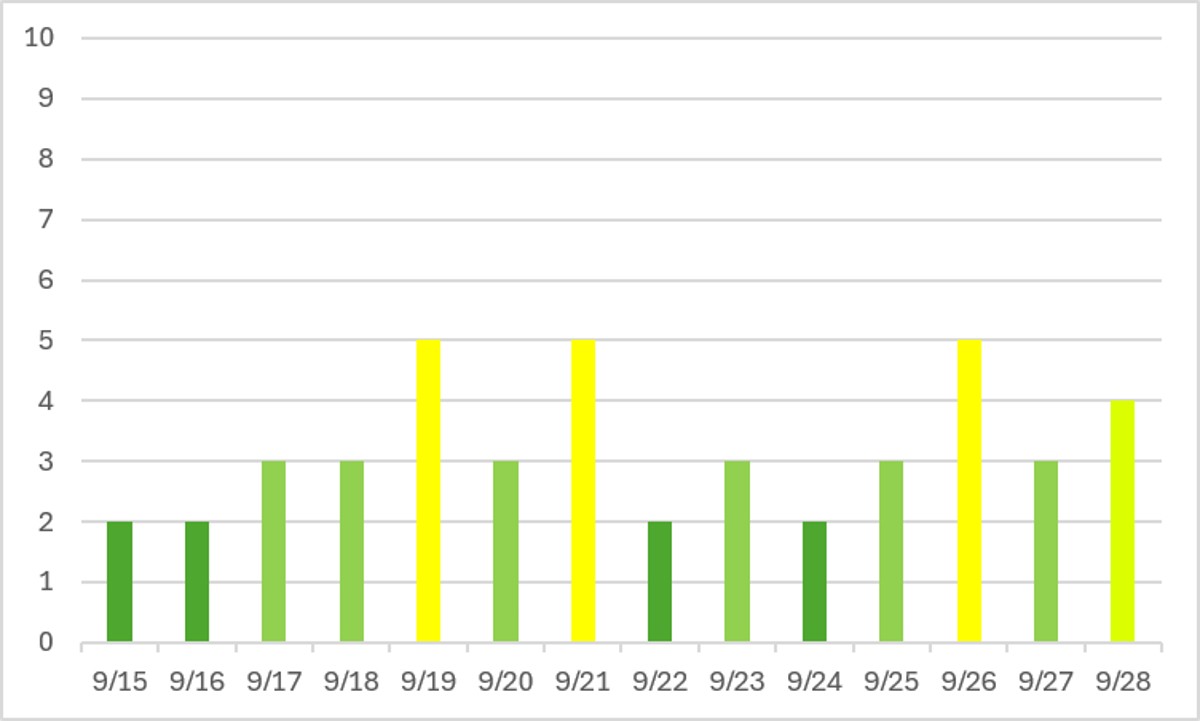
It’s pretty cool that we can see the end of summer empty parks all in one graph! We certainly aren’t in fall crowd season yet, but we’re clearly turning the corner. In fact, wait times on September 19th were the highest they’ve been since May 3rd. So there you go, low summer crowds (un)officially last from May 3rd to September 19th.
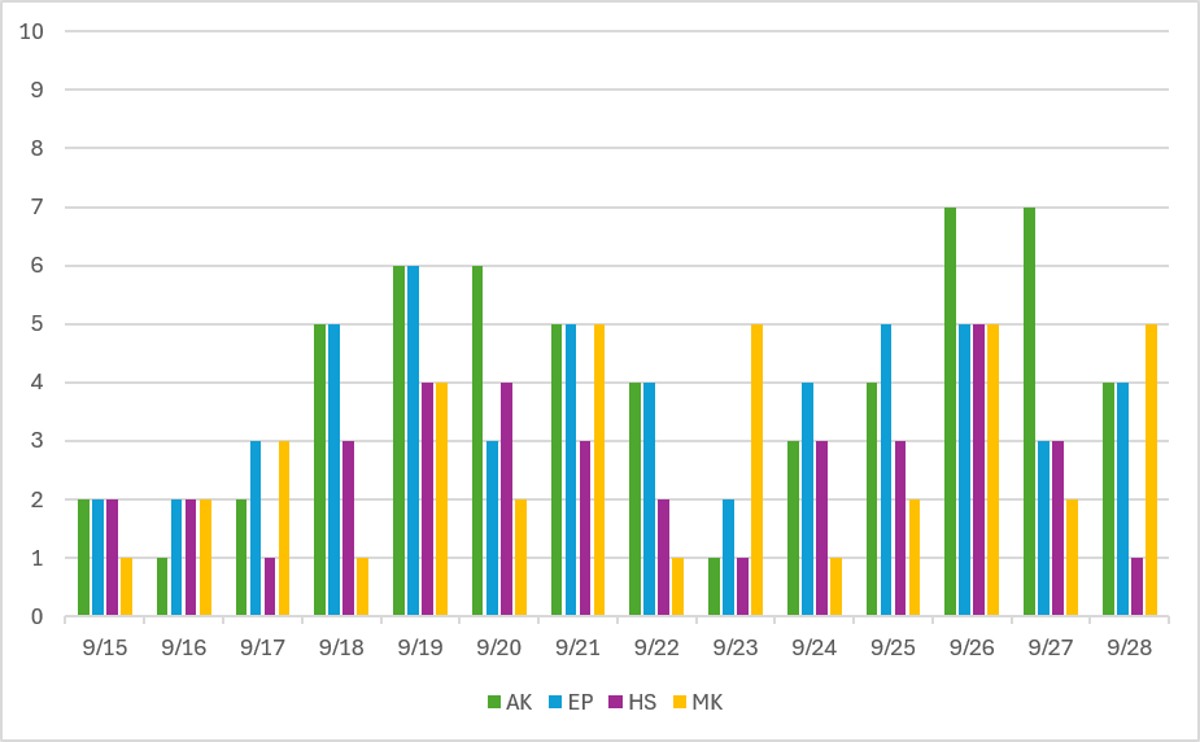
At the park level, we get even more interesting information! If you pay attention to just the green bars (Animal Kingdom) you can see a pretty steady wave pattern, from crowd level 1 on 9/16 and 9/23 (Wednesdays) up to peaks of crowd level 6 and 7 on 9/19-9/20 and 9/26-9/27 (weekends). Very very clear pattern that says you should visit Animal Kingdom midweek if you can.
If you pay attention to the yellow bars, you can see our Magic Kingdom party day behavior kicking into a higher gear. This will get even more pronounced as we head into October with its SIXTEEN party days, but the 9/22-9/24 pattern of crowd level 1 to crowd level 5 to crowd level 1 shows that people are still avoiding party days.
If you pay attention to the blue bars, you can see that EPCOT has a similar crowd wave pattern to Animal Kingdom, but slightly lower, and shifted forward one day. It peaks on Fridays and Saturdays instead of Saturdays and Sundays. Thanks, Food & Wine festival!
Performance of Crowd Level Predictions
Each week, I give you a very transparent look into how the TouringPlans crowd level predictions performed. Each day at each park is one data point, so each week we have 28 different crowd level predictions to evaluate. Any time a prediction is within one or two crowd levels, things won’t really “feel” much different than what was predicted. Being off by 3 or more crowd levels is where you might feel that difference in wait times throughout the day.
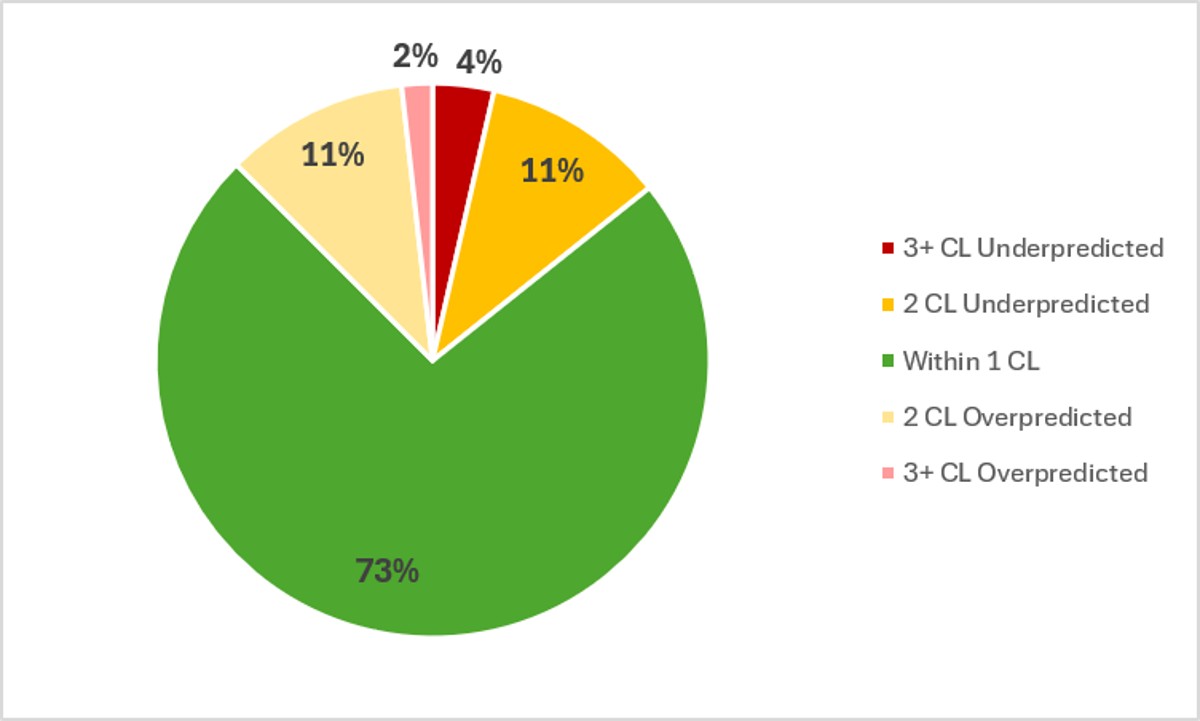
In the past two weeks, Touring Plans predictions were either spot-on or within 1 crowd level 73% of the time, which is still pretty good compared to a lot of our summer results. And 94% of the time Touring Plans predictions were within 2 crowd levels, so that’s a solid A on predictions for the last two weeks. And even more exciting, from a statistical perspective – all of the misses were evenly distributed between overpredictions and underpredictions! Not skewed at all. The biggest miss of the week was an underprediction by 4 crowd levels, which happened at Animal Kingdom on September 27th, when the predicted crowd level was 3, but the park shot all of the way up to a crowd level 7.
Attraction Downtime September 15 – 29
If we average all of the capacity lost due to unexpected downtime over the past two weeks, it comes out to 4.9% of attractions unexpectedly being down. This is, thankfully, much lower than what we’ve seen for most of the summer! Another sign that fall has arrived at WDW. Over the past two weeks, EPCOT was the park with the worst overall downtime, averaging 5.4% of its capacity lost to downtime. Not a bad result for worst park.
The worst day for attraction downtime in the past two weeks was on September 21st. On that day, 9% of all capacity at WDW was lost due to unexpected downtime. And the worst park-day of the past two weeks was also on September 20th, over at Animal Kingdom, when 13% of its capacity was lost due to unexpected downtime. Thankfully, once again, this is one of our lowest “winning” numbers in several months. Animal Kingdom was open for 11 hours on the 20th, so 13% downtime is the equivalent of the entire park shutting down for over 85 minutes. Certainly that has an impact, but it’s not as bad as the 151 minutes from two weeks ago!
Attraction Downtime Worst Offender
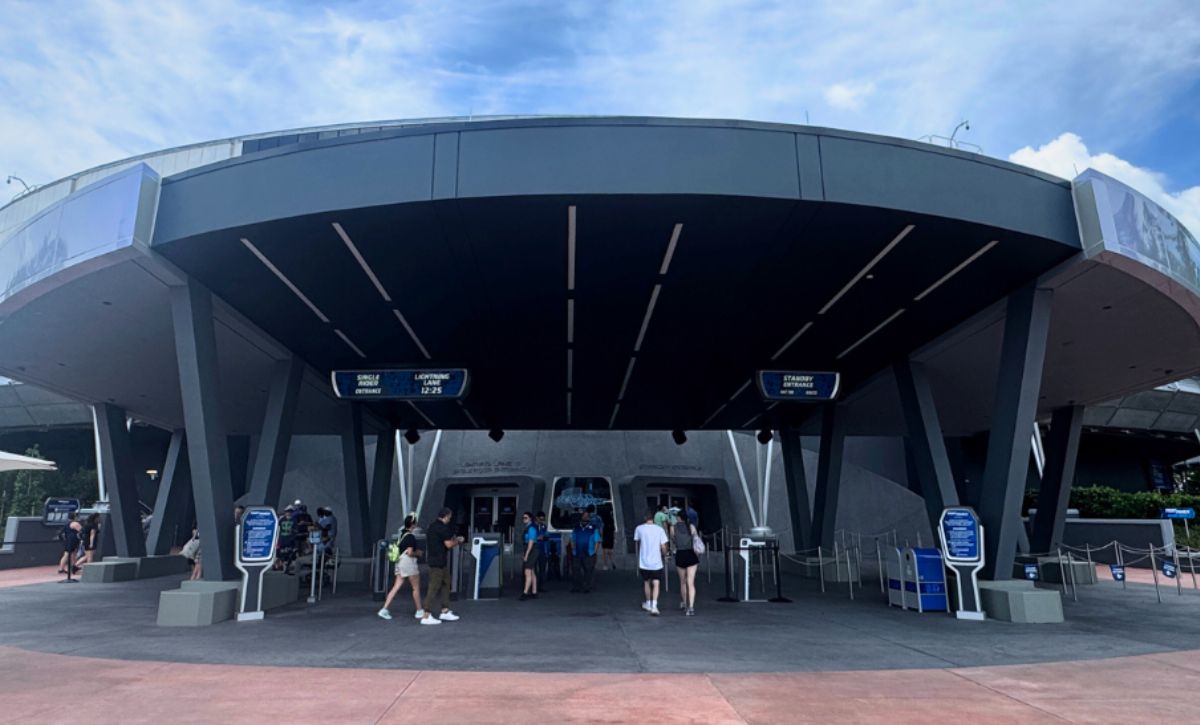
One thing that hasn’t changed with fall coming to WDW? Test Track and its unprecedented unreliability. Test Track is still on top of our downtime list, like it has been for most of the summer. Test Track was unexpectedly down for 25% of the past week. Its worst day of the past two weeks was on September 20th, when it was down for 66% of the day. But it was also down for half of the day on two other dates in the past two weeks.
The attraction with the next-highest downtime over the past two weeks was Slinky Dog Dash, which had another couple of terrible days and overall 14% downtime.
Rope Drop Downtime
Here are problematic offenders from the past two weeks, with the percentage of downtime during the first hour of the day in parentheses:
- Magic Kingdom: Tiana’s Bayou Adventure (18%), Pirates of the Caribbean (14%)
- EPCOT: Test Track (20%), Frozen Ever After (19%), Cosmic Rewind (14%), Journey Into Imagination (10%)
- Hollywood Studios: Slinky Dog Dash (29%), Rise of the Resistance (22%), Rock’n’Roller Coaster (16%), Runaway Railway (13%)
- Animal Kingdom: Expedition Everest (11%)
Look at that Magic Kingdom list! That’s one of the shortest MK rope drop downtime lists we’ve ever had.
EPCOT and Hollywood Studios, on the other hand … lots of headliners on these lists. Especially at EPCOT, where three out of the big four rope drop targets had 14% or higher downtime during rope drop. That’s frustrating, and makes it very difficult to navigate the beginning of your day.
Wait Times September 15 – 29
Attractions with the Highest Average Posted Wait at Each Park September 15 – 21
- EPCOT: Cosmic Rewind, average posted wait of 84 minutes (was 76 minutes the week before)
- Hollywood Studios: Slinky Dog Dash, average posted wait of 57 minutes (was 54 minutes two weeks ago)
- Magic Kingdom: TRON, average posted wait time of 54 minutes (was 50.5 minutes two weeks ago)
- Animal Kingdom: Flight of Passage, average posted wait time of 48 minutes (was 50 minutes two weeks ago)
Only two attractions in all of WDW had average posted waits of over an hour this week – Cosmic Rewind and Test Track (63 minutes). That’s still a really great result for mid-September. Otherwise, wait times weren’t miserable anywhere, but we generally saw slight increases compared to the previous week.
Attractions with the Highest Average Posted Wait at Each Park September 22 – 28
- EPCOT: Cosmic Rewind, average posted wait of 79 minutes (was 84 minutes last week)
- Hollywood Studios: Slinky Dog Dash, average posted wait of 61 minutes (was 57 minutes last week)
- Animal Kingdom: Flight of Passage, average posted wait time of 57 minutes (was 48 minutes last week)
- Magic Kingdom: TRON, average posted wait time of 53 minutes (was 54 minutes last week)
These numbers are a good representation of what has been happening the past two weeks. Generally, wait times are slowly ramping back up out of “empty parks” zone. But they’re still heavily impacted by little swings, like Cosmic Rewind’s time going down thanks to September 21st happening in the previous week and artificially bumping up the wait time at this one attraction.
Parks with the Highest and Lowest Average Wait September 15 – 21
- Highest: Hollywood Studios, average park-wide posted wait of 34.5 minutes (was 32 minutes two weeks ago)
- Lowest: Magic Kingdom, average park-wide posted wait of 19 minutes (was 17.5 minutes two weeks ago)
The overall numbers continue to tell our story – things are slowly but steadily ramping up as we head into the fall and out of the summer doldrums.
Parks with the Highest and Lowest Average Wait September 22 – 28
- Highest: Hollywood Studios, average park-wide posted wait of 34.5 minutes (was 34.5 minutes last week)
- Lowest: Magic Kingdom, average park-wide posted wait of 19 minutes (was 19 minutes last week)
And then they stalled out! Ha. But really, this makes sense. Rain backed off in the past week, which helped overall wait times go down even though there were a few more people in the parks.
Most Inflated Posted Wait Times
We all know that Disney inflates their posted wait times on purpose. They have many reasons for doing this. Some are totally understandable, and some are potentially more problematic. We can figure out how much posted wait times are being inflated by comparing submitted actual wait times from the Lines App and the posted wait time when the person timing their wait entered the line.
Over the past two weeks, actual wait times in the Lines App averaged 74% of what was posted. That’s pretty close to our historical average in the era of Lightning Lanes. Overall, if the posted wait time at a popular attraction was 60 minutes, you could’ve expected to wait less than 45 minutes instead.
But the worst inflation offender for the past two weeks was The Seas with Nemo and Friends. At this one attraction, submitted actual wait times were only 40% of posted wait times in the past week. That means that if Nemo had a 20 minute posted wait, you probably would have actually only waited 8 minutes instead. Less than half of what was posted!
This Week’s Wait Time Rock Star September 15 – 21
Between September 15th and 21st we had just under 900 timed actual waits submitted through the Lines app. And the person who recorded the most actual waits during that time was lmille40, with 30 overall timed waits – 12 Lightning Lane waits and 18 standby waits. Thanks for all of that timing, lmille40! It unfortunately does not compete with the the 97 timed waits in a single week from our current timing champion, preef.
This Week’s Wait Time Rock Star September 22 – 28
Between September 22nd and 28th we had just over 1000 timed actual waits submitted through the Lines app. And the person who recorded the most actual waits during that time was sherridawn, with 29 overall timed waits – all standby waits. Hard mode! Thanks for all of that timing, sherridawn! It unfortunately does not compete with the the 97 timed waits in a single week from our current timing champion, preef.
Looking Ahead: September 29 – October 5
I write this article on Tuesday evenings so that you all have the very freshest of data on Wednesdays. That means the 29th will already be in the past by the time you’ve read this, so welcome to your bright future!
We’re ramping up into Halloween party season, with FOUR parties in the upcoming week – on September 29th, and October 1st, 2nd, and 4th. There is also a party on the 6th, which isn’t during this week, but does mean that the 5th is surrounded by two party days. Clearly September 30th and October 3rd will be VERY CROWDED at Magic Kingdom. Both of those days are surrounded by three party nights. If you can avoid those evenings in the Magic Kingdom, you probably should.
We have more new EPCOT Food & Wine Festival booths opening this week (the finale wave!) on October 2nd, but that shouldn’t have a gigantic impact on wait times at the park – lines just may be a little longer at the new booths on their first day, before things settle back down.
We’re hitting the first wave of fall breaks as we get into early October, so expect overall wait times and crowd levels to start moving up, especially as we get to the national holiday on October 12th.
And, hi, hello, yes, we’re still in afternoon thunderstorm season, with plenty of rain being called for every day of the next week. Highs aren’t quite as high this week though, with highs mostly in the 80s. So that’s …. something!
Were you in the parks this past week? Or are you headed to Orlando soon? Let me know in the comments below!
You May Also Like...
-

Welcome back to the Data Dump! We’ve now had several straight weeks of low-to-moderate crowds and stable wait times. Hooray! As…
-

We're back with the Disney Data Dump! And it's a special Double Disney Data Dump thanks to me being out and…
