Disney Data Dump May 13 2026
Welcome back to the Data Dump! We’ve now had several straight weeks of low-to-moderate crowds and stable wait times. Hooray! As long as you avoid resorts where sports or cheer competition teams are staying, you’re having as spectacular and uncrowded time at Walt Disney World this late spring.
That doesn’t mean there aren’t interesting trends hiding underneath those nice-looking crowd levels, though. One park in particular continues to wave giant red warning flags about capacity heading into summer, while a couple of others are quietly becoming much easier to tour than they were even a year ago. And we’ve also got some early signs of how Disney’s summer plans could start reshaping crowd patterns over the next few weeks. Let’s dig into the data!
Observed Crowd Levels April 28 – May 11
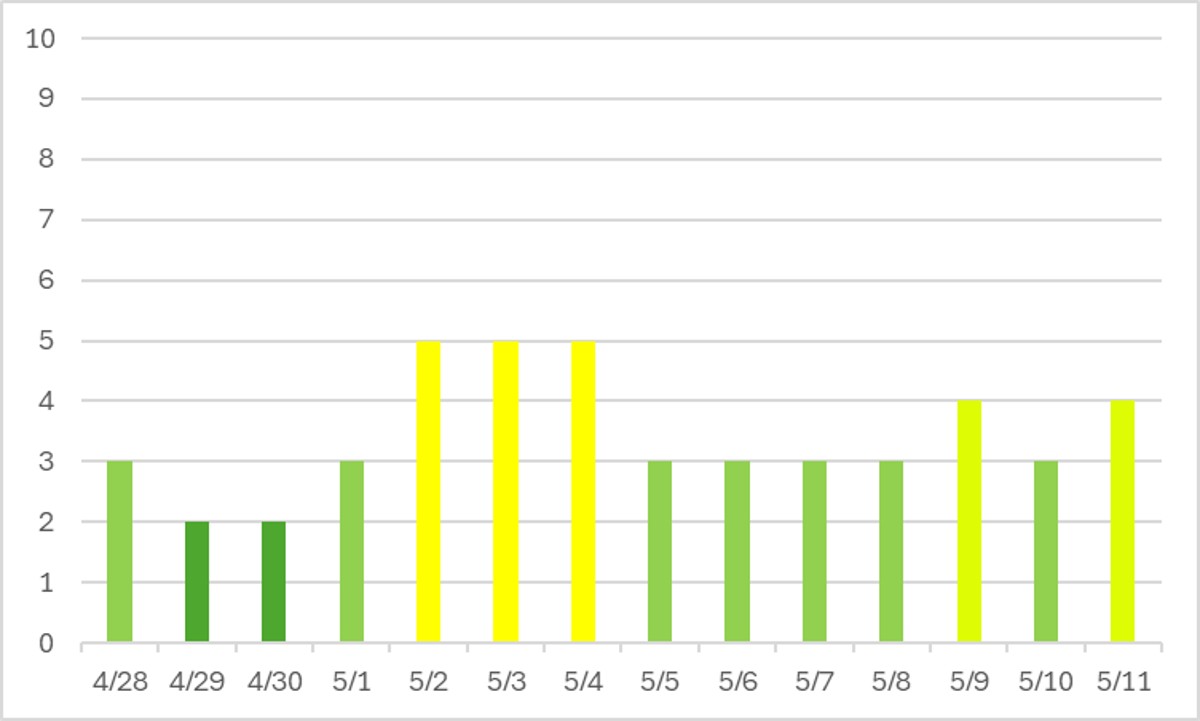
Two weeks ago, I predicted a couple weeks of overall crowd levels in the 2-4 range. Which mostly held true, other than a three-day streak of nice weather on a weekend that led to some more locals visiting the parks and higher wait times right at the beginning of May. Otherwise, it was a steady, reliable, late-spring period.
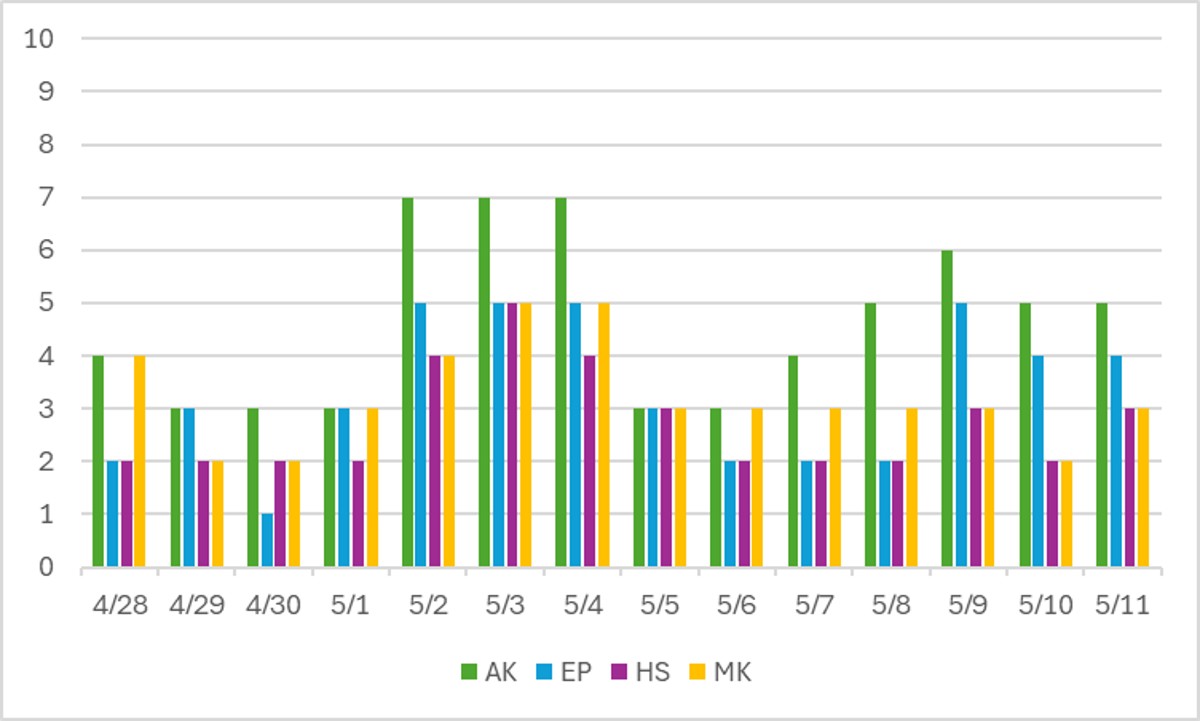
I’m becoming a broken record on this point, but it’s worth emphasizing as we head toward the end of May, when a couple of Australian pups are taking up residence. Animal Kingdom doesn’t have enough open attractions to handle the crowds that it sees, even in low- and moderate-crowd seasons. Bluey and Bingo arrive on May 26, and will draw in even more families. I suspect this problem will get worse and stay worse until Tropical Americas opens at the end of 2027. There just isn’t enough to do to keep up with demand until that happens.
On the other end of the spectrum, Hollywood Studios and Magic Kingdom continue to do very well at handling this low-crowd season. With Big Thunder and Buzz reopened at Magic Kingdom, and The Walt Disney Studios opening at the end of the month at Hollywood Studios, I have no worries about either of them being able to cope through the summer.
Performance of Crowd Level Predictions
Each week, I give you a very transparent look into how the TouringPlans crowd level predictions performed. Each day at each park is one data point, so each week we have 28 different crowd level predictions to evaluate. And for the past two weeks we’ve got 56 of them! Any time a prediction is within one or two crowd levels, things won’t really “feel” much different than what was predicted. Being off by 3 or more crowd levels is where you might feel that difference in wait times throughout the day.
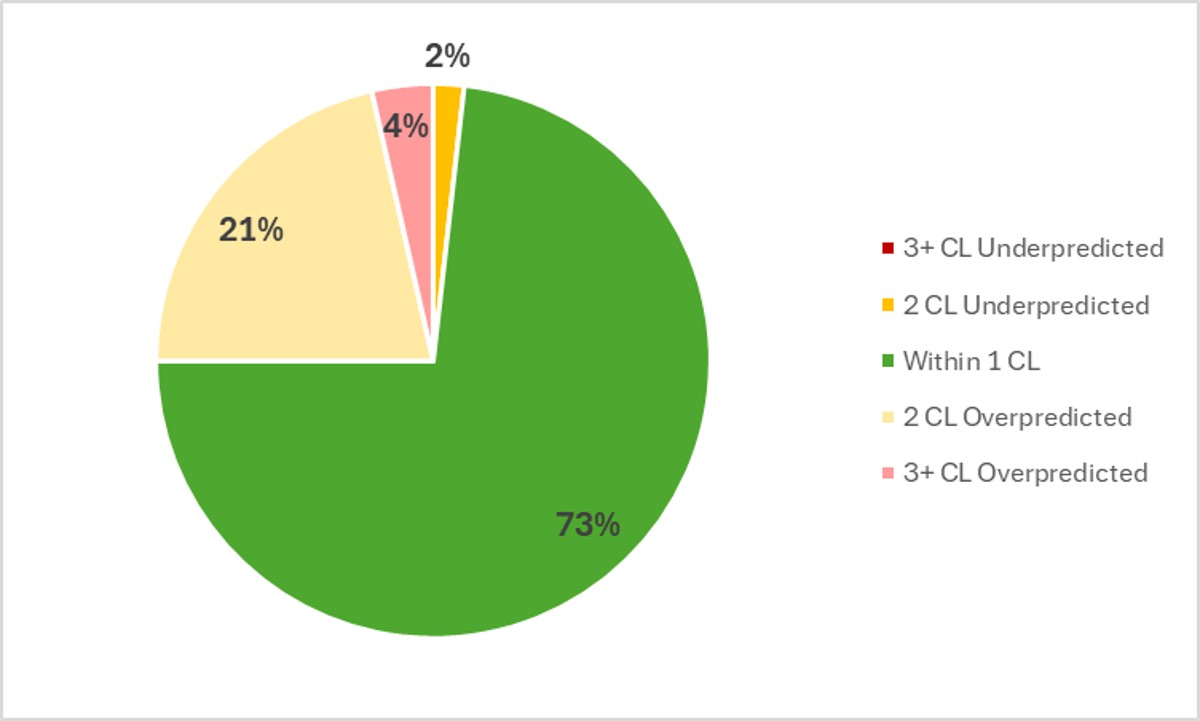
In the past two weeks, Touring Plans predictions were either spot-on or within 1 crowd level 73% of the time, which is a pretty decent result compared to our historical average. And then 96% of the time Touring Plans predictions were within 2 crowd levels, so that’s a solid A for the predictions over the past week! While this isn’t the “perfect” result that we saw two weeks ago, it’s pretty stinking close. The biggest miss of the week was an overprediction of 4 crowd levels, which happened at Animal Kingdom on May 1, when the predicted crowd level was a 7 and it only ended up being a 3.
Attraction Downtime April 28 – May 11
If we average all of the capacity lost due to unexpected downtime over the past two weeks, it comes out to 5.1% of attractions unexpectedly being down. That’s very similar to what we’ve seen ever since the Spring Break season wrapped up. In the past two weeks, Animal Kingdom was once again the park with the most overall downtime, averaging 6.9% of its capacity lost to downtime. This definitely contributes to the higher wait times at the already-low-capacity park.
The worst day for attraction downtime in the past two weeks was on May 2nd. On that day, 12% of all capacity at WDW was lost due to unexpected downtime. But the worst park-day of the past two weeks was actually at Animal Kingdom on April 28th, when 17% of that park’s capacity was lost due to unexpected downtime. Animal Kingdom was open for 10 hours on the 28th, so 17% downtime is the equivalent of the entire park shutting down for 102 minutes. Almost 2 hours out of the 10 hours the park was open. Boo.
Attraction Downtime Worst Offender
In the past two weeks, The Haunted Mansion was the WDW attraction with the worst overall downtime. It was unexpectedly down for 17% of the past week. Most significantly, it was never open on May 2nd or May 3rd. A rough two days. If we exclude those two days, it only had 3% downtime. The attraction with the next-highest downtime is important to call out this week too. Big Thunder Mountain Railroad comes in second place with 16% downtime since its reopening on May 3rd. Hopefully it’s just reopening jitters.

Rope Drop Downtime
Here are problematic offenders from the past two weeks, with the percentage of downtime during the first hour of the day in parentheses:
- Magic Kingdom: Haunted Mansion (31%), Big Thunder Mountain (28%), Tiana’s Bayou Adventure (21%), The Many Adventures of Winnie the Pooh (20%), Buzz Lightyear’s Space Ranger Spin (16%), Mad Tea Party (11%), Under the Sea (11%)
- EPCOT: Frozen Ever After (15%), Journey Into Imagination (14%), Spaceship Earth (11%)
- Hollywood Studios: Rise of the Resistance (30%)
- Animal Kingdom: Expedition Everest (17%)
Big shout-out to Hollywood Studios, because this isn’t a terrible rope drop problem list for that park at all. Is it problematic that Rise is down almost a third of the time? Yes. Are there plenty of other rope drop targets to bop to instead? Also yes.
Magic Kingdom continues to struggle, especially on the left side of the park at regular rope drop! At this point, if you have early entry, your best bet is to stay in Tomorrowland or Fantasyland and watch wait times just after opening to see what’s online before you trek all the way across the park.
Wait Times April 28 – May 11
Attractions with the Highest Average Posted Wait at Each Park
- EPCOT: Cosmic Rewind, average posted wait of 82 minutes (was 82 minutes two weeks ago)
- Magic Kingdom: TRON, average posted wait time of 69 minutes (was 73 minutes two weeks ago)
- Animal Kingdom: Flight of Passage, average posted wait time of 62 minutes (was 60 minutes two weeks ago)
- Hollywood Studios: Slinky Dog Dash, average posted wait of 60 minutes (was 65 minutes two weeks ago)
Overall, wait times at headliners have been remarkably steady for the past 3 weeks. Once we made it past the Spring Break highs and the post-Easter lows, things have evened out. For that entire three-week stretch, only five attractions have had average posted waits of an hour or more – the four above, and Test Track, which always comes in just behind Cosmic Rewind.
Parks with the Highest and Lowest Average Wait
- Highest: Animal Kingdom, average park-wide posted wait of 36 minutes (was 35 minutes two weeks ago)
- Lowest: Magic Kingdom, average park-wide posted wait of 21 minutes (was 22 minutes two weeks ago)
It’s not just headliners that are nice and steady and predictable. It’s entire parks! Animal Kingdom continues to have the highest overall wait times thanks to its low number of attractions, while Magic Kingdom has ALL of the filler and keeps its overall wait times nice and low.
Most Inflated Posted Wait Times
We all know that Disney inflates their posted wait times on purpose. They have many reasons for doing this. Some are totally understandable, and some are potentially more problematic. We can figure out how much posted wait times are being inflated by comparing submitted actual wait times from the Lines App and the posted wait time when the person timing their wait entered the line.
Over the past two weeks, actual wait times in the Lines App averaged 73% of what was posted. That’s very close to our historical average in the era of Lightning Lanes. Overall, if the posted wait time at a popular attraction was 60 minutes, you could’ve expected to wait less than 44 minutes instead.
But the worst inflation offender for the past two weeks was Mission: Space. At this one attraction, submitted actual wait times were only 33% of posted wait times in the past two weeks. That means that if Mission Space had a 30 minute posted wait, you probably would have actually only 10 minutes instead. A third of what was posted! Remember to always check the Lines app for predicted actual waits instead of making decisions based on what is posted.
Last Week’s Wait Time Rock Star
Between April 28th and May 4th, we had just over 800 timed actual waits submitted through the Lines app. The one person who recorded the most actual waits during that time was hol74976, with 36 overall timed waits – 1 Lightning Lane wait, 31 standby waits, and 4 single rider waits. Thanks for all of that timing, hol74976! It unfortunately does not compete with the the 97 timed waits in a single week from our current timing champion, preef.
This Week’s Wait Time Rock Star
Between May 5th and 11th, we had just over 1100 timed actual waits submitted through the Lines app. The one person who recorded the most actual waits during that time was passesforsix, with 35 overall timed waits – 1 Lightning Lane wait, 28 standby waits, and 6 single rider waits. Thanks for all of that timing, passesforsix! It unfortunately does not compete with the the 97 timed waits in a single week from our current timing champion, preef.
Looking Ahead: May 12 – 18
I write this article on Tuesday evenings so that you all have the very freshest of data on Wednesdays. That means the 12th will already be in the past by the time you’ve read this, so you’re back to the future!
More of the same! Some colleges and high school seniors are wrapping up their school years, but families with young kids are generally still in school, which means low impact on crowds at Walt Disney World. And we’re not quite yet at the kickoff of Cool Kid Summer or Passholder previews for some of the attractions and overlays opening for that event. Next week’s Look Ahead will be much more interesting, for better or worse 🙂
The 12th is going to be a washout in the afternoon and evening (but that’s in the past as you’re reading this, so congratulations on surviving?). The rest of the week should be sunny and edging toward summer temperatures, with highs in the 90s. But just barely, so that’s something. We’re almost to the season of regular summer afternoon showers or storms and reliable heat, so be prepared with your fans, water bottles, umbrellas, and ponchos or jackets so that you can ride out all of the weather and keep enjoying the parks.
Were you in the parks this past week? Or are you headed to Orlando soon? Let me know in the comments below!
You May Also Like...
-

If you’ve been waiting for a quiet spring window at Walt Disney World that waits until after the wild winter crowds,…
-

What we saw this past week is a really good reminder that Spring Break season isn’t one clean spike. It’s a…