Disney World Crowd Report – December 14 to 20, 2014
Crowds at Walt Disney World stayed flatter than usual last week. All five weekdays stayed at a level ‘4’ across the resort. No park reached a level higher than ‘6’ on our scale during the week. Predictions did very well last week with most park level predictions hitting the mark within one index level. Only one crowd level came in more than two levels higher than predicted (Animal Kingdom on Sunday).
Let’s look at how the crowd levels stacked up each day last week:
| WHAT WE THOUGHT |
WHAT WE SAW |
ANALYSIS | |
|---|---|---|---|
| Magic Kingdom |
3
|
4
|
Only Animal Kingdom broke through the middle point of our scale on Sunday. Wait times were within 9 minutes of average across all four parks with few exceptions. |
| Epcot |
4
|
5
|
|
| Hollywood Studios |
4
|
4
|
|
| Animal Kingdom |
3
|
6
|
|
| WHAT WE THOUGHT |
WHAT WE SAW |
ANALYSIS | |
| Magic Kingdom |
6
|
6
|
Magic Kingdom was the park to reach a level above the midpoint on Monday thanks to the fact that no Mickey’s Very Merry Christmas Party was scheduled and the park closed at midnight. Big Thunder Mountain Railroad averaged 43 minutes (predicted 42). |
| Epcot |
5
|
3
|
|
| Hollywood Studios |
3
|
4
|
|
| Animal Kingdom |
3
|
4
|
|
| WHAT WE THOUGHT |
WHAT WE SAW |
ANALYSIS | |
| Magic Kingdom |
3
|
2
|
Magic Kingdom did host a Christmas Party on Tuesday and the wait times reflected the shortened hours. Pirates of the Caribbean averaged 22 minutes (predicted 19). |
| Epcot |
4
|
4
|
|
| Hollywood Studios |
3
|
4
|
|
| Animal Kingdom |
3
|
4
|
|
| WHAT WE THOUGHT |
WHAT WE SAW |
ANALYSIS | |
| Magic Kingdom |
6
|
6
|
Animal Kingdom dipped to a level ‘2’ on Wednesday, three levels lower than we expected. Guests saw wait time averages like 17 minutes at Dinosaur (predicted 34). |
| Epcot |
5
|
3
|
|
| Hollywood Studios |
4
|
4
|
|
| Animal Kingdom |
5
|
2
|
|
| WHAT WE THOUGHT |
WHAT WE SAW |
ANALYSIS | |
| Magic Kingdom |
3
|
3
|
Another day of shortened hours on Thursday at Magic Kingdom. Posted wait times were 25 minutes at Buzz Lightyear’s Space Ranger Spin (predicted 24) and 42 at Jungle Cruise (predicted 36). |
| Epcot |
4
|
5
|
|
| Hollywood Studios |
3
|
4
|
|
| Animal Kingdom |
4
|
3
|
|
| WHAT WE THOUGHT |
WHAT WE SAW |
ANALYSIS | |
| Magic Kingdom |
4
|
3
|
Epcot was the busiest park as we predicted with wait time averages such as 76 minutes at Soarin’ (predicted 80) and 81 at Test Track (predicted 73). |
| Epcot |
5
|
6
|
|
| Hollywood Studios |
4
|
5
|
|
| Animal Kingdom |
3
|
3
|
|
| WHAT WE THOUGHT |
WHAT WE SAW |
ANALYSIS | |
| Magic Kingdom |
7
|
7
|
Magic Kingdom continued its trend of large crowds on Saturdays in November and December. Saturday’s Magic Kingdom crowd was the only one all week to reach a level above ‘6’. Peter Pan’s Flight averaged 74 minutes (predicted 65). |
| Epcot |
7
|
6
|
|
| Hollywood Studios |
6
|
4
|
|
| Animal Kingdom |
5
|
5
|
|
| December 21 to 27, 2014 |
|---|

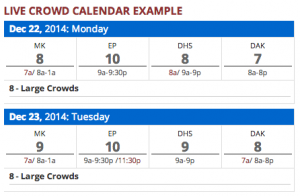
This week is the first week of Christmas crowds at Disney World. Wait times will build steeply starting on Tuesday and remaining high until January 2. Guests wishing to brave the parks this week will need patience, good touring plans and reliable alarm clocks.
To see Walt Disney World Crowd predictions for the days of your vacation, check the Crowd Calendar.
To get details about our predictions of future crowds or details about crowds in the past check out the Crowd Calendar and select “Jump to Date” on the left margin.


