Walt Disney World Crowd Report – February 16 to 22, 2014
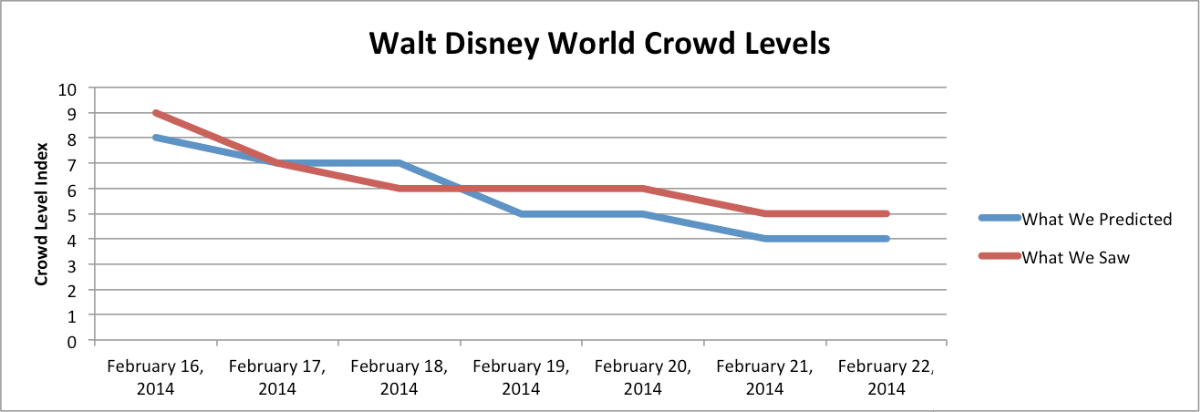
Presidents’ Week began with near peak crowds on Sunday and then slowly tapered off the rest of the week, exactly as predicted by the crowd calendar. Our park-level predictions performed well with the majority hitting the mark or missing by only one or two levels.
Let’s look at how the crowd levels stacked up day-to-day last week.
| February 16, 2014 to February 22, 2014 |
|---|
Sunday’s crowds brought the peak wait times of Presidents’ Week, as predicted. All parks had a crowd level ‘9’ except for Magic Kingdom which came in at a level ‘8’. At the Animal Kingdom three attractions, Dinosaur, Kilimanjaro Safaris and Primeval Whirl reached a ’10’ on their respective attraction-level scales thanks to respective average posted times of 40, 64 and 30 minutes.
As is the case with many Monday holidays, the crowds on the holiday itself did not reach the same level as the Sunday before. Instead of ‘8’s and ‘9’s Presidents’ Day brought mostly ‘7’s with one ‘8’ at the Animal Kingdom. Our predictions were accurate again on Monday with none missing by more than 2 index points. Epcot was the only park that fell short of our prediction. We said ‘9’ but it ended up reaching only a ‘7’, thanks to lower than expected wait times at Test Track (82 minutes, predicted 105) and Soarin’ (98 minutes, predicted 141).
Predictions did well again on Tuesday with Magic Kingdom, The Studios and Animal Kingdom all reaching levels within one of what we predicted. Epcot was the only exception where crowds came in much lower than expected. We predicted a ‘7’ but in fact the wait times translated to a ‘4’. Only Spaceship Earth had wait times that came in higher than expected (21 minutes vs 15 predicted) while other attractions were less crowded than expected.
Crowds continued to fade further on Wednesday with a resort-wide crowd level of ‘6’ on our scale. Park levels were as high as ‘7’ at Magic Kingdom to a low of ‘4’ at The Studios. In all cases, our predictions were within one index level. Mission: Space was the only attraction resort-wide that had surprising wait times. We expected it to have an average posted time of 10 minutes but in fact it was much higher at 30 minutes. The rest of the park was clearly more moderate than that which validates our method of excluding the highest and lowest averages in our park-wide numbers. Also, it reminds us to rely on Lines, the mobile app whenever possible. You never know when any one attraction may have a surprising wait time.
The trend continues on Thursday although the drop in crowds was not quite as significant as predicted. Still, Thursday’s resort-wide level (6) was only low by one level (predicted 5). We missed Animal Kingdom by two levels (‘6’, predicted ‘4’) thanks to higher than expected wait times at Dinosaur (23 minutes) and Kali River Rapids (37 minutes). Extra Magic Hour morning at Magic Kingdom brought a crowd level ‘6’ as predicted although Jungle Cruise had an average posted time almost as high Peter Pan’s Flight – there aren’t many days when one can say that.
Friday’s numbers took another step down from Thursday’s with a resort-wide ‘5’. Epcot and Animal Kingdom were ‘4’s while The Studios was a little higher at ‘5’ and Magic Kingdom a little higher still, at ‘6’. Jungle Cruise continued its popularity on Friday with a surprising average posted time of 40 minutes. By contrast from Wednesday, the average posted time for Mission: Space on Friday was 7 minutes, much more in line with historical averages.
Saturday’s crowd level stabled somewhat with all parks between a ‘4’ and a ‘6’ on our scale. The Princess Half Marathon is the event of the weekend which brings in several thousand runners but doesn’t increase the wait time in the parks. Only the Magic Kingdom reached higher than a ‘5’. The effect of running events on the resort is limited to traffic delays and crowded hotels. Once you maneuver around the hotels and roads, you will find manageable crowds in the parks.
| February 23 to 29, 2014 |
|---|
Now that Presidents’ Week has passed we should be free of holiday sized crowds until the first of the Spring Break weeks arrive. Spring Break is a difficult season to predict because every school district chooses its week independently. We collect the school schedules for the 50 largest school districts in the U.S. and use them in our statistical models. As it turns out, they are essential to our accuracy this time of year. Many of you may find that your children’s spring break falls on a week that doesn’t have a high crowd level on our calendar. Count yourself lucky. Even if a few thousand students are off, it takes several tens of thousands before we see a real bump in attendance.
To see Walt Disney World Crowd predictions for the days of your vacation, check the Crowd Calendar.![]()
To get details about our predictions of future crowds or details about crowds in the past check out the Crowd Calendar and select “Jump to Date” on the left margin.
You May Also Like...
-

This weekend will have the longest park hours since Walt Disney World re-opened in July. Extended park hours are a signal…
-

The February 2020 Crowd Calendar update is now live. So far 2020 is showing increased crowds at Walt Disney World. We…
-
The October Crowd Calendar update is now live. We skipped September to give the models a chance to digest the data with Star…
-
Today the Disney World Crowd Calendar gets an update. This is the result of a complete review of the predictions for…
Chris, we’re a family of educators, so the only times we visit WDW are Christmas week, Easter week and mid-summer. 10s every day. We bought the book and followed the touring plans and always have a great time. Always manage to do everything we want and then some. Also we always understood that we are choosing to visit the world’s most popular vacation destination at its busiest times.
I can’t imagine being at WDW on a 5 day–that must be great.
Anyway, you got your comments posted and a mea culpa. Both are rare these days on the ‘net. Now all that’s left is the “assuming personal responsibility” part for your own happiness. In my experience that’s still an individual choice.
Dear Fred,
My horoscope was wrong yesterday (it was not a good day for romance), and the weather report’s prediction for precipitation (incorporating million-dollar satellites and supercomputers) also missed the mark. And then my team failed to cover the spread, costing me a few bucks. But the absolute worst part of my day was being at The Happiest Place On Earth ™ with my family on vacation and having to wait in lines a little longer than you predicted. The agony! The ennui! The chutzpah! (Not to mention the time and effort to write this while on vacation.)
Expect to hear from my lawyer to compensate my family for the pain and suffering of having to stand in line and somehow amuse ourselves a few more minutes than we had planned.
Signed,
Thoroughly, completely and totally (but not redundantly) disgusted with your site and vowing never to use it again (excerpt to see if you print my comment and what responses it generates, of course)
I subscribed for the crowd calender, yes. I know their are free options but we figured this, as a paid service, was more accurate. I am not sure what the “Lines” app is and my subscription has expired and I am hesitant to renew. We did use Disney’s “My Disney Experience” app which accurately shared line wait times but again, doesn’t make the lines any shorter.
Anyhow, life goes on, but this was not a great experience. Tomorrow we’re trying Animal Kingdom and hoping TP got a bit closer this time.
In my experience, the wait times on the Lines app are far more accurate than the posted times listed on the MDE app.
What happened to the comments?
All comments are still present.
Our family subscribed to your service to plan the perfect low-crowd vacation. We chose this week (Feb 21 – Mar 1). We, on your level and recommendation, went to Epcot yesterday. Predicted 2, actual 5. It was actually one of the more crowded times we’ve been to Epcot.
Today (Feb 25) we, again on your recommendation and level, went to Magic Kingdom. You predicted a 2 – it will be interesting to see how you rate it because MK was PACKED.
The bottom line is, we paid for a service and it has failed flat out. Being three off on Epcot and MORE off on MK — why pay for this service? It will be interesting to see if this honest but critical comment will even be allowed on your site. Sorry, but this service was not worth the money and, actually hurt our Disney plans as we based them on this site.
Chris, you are right. Our Magic Kingdom prediction fell short by quite a bit yesterday. We had predicted Magic Kingdom to be a ‘2’ but based on wait times it was more like a ‘6’. Judging by your comment it may have even felt more crowded than that. Unfortunately, predicting crowds is not an exact science which is why we try to emphasize that our products work best when combined together. Hopefully you used a touring plan and our mobile app, Lines to adjust your touring on the fly.
We take it to heart when our predictions miss the mark because we realize that it can affect people’s experiences in the park. Luckily we know that it is a rare event. 92% of the time our predictions are within 2, another 6% of the time we miss by 3. Unfortunately, you experienced the remaining 2% where we missed by 4 or more. Incidentally our prediction of a level ‘1’ at The Studios yesterday was correct and Epcot was only off by 1 (‘3’, predicted a ‘2’). No consolation to you, I know.
Sorry for the negative experience but rest assured your comment will remain. Our predictions are not without error but we believe them to be the most accurate available and feedback like yours is essential, so thanks for taking the time to express it here.
Fred – Overall you do a great job. If I had one complaint (and maybe it is just my anecdotal evidence) it is that our spring break which always includes April 1st always seems to be under estimated until a few weeks before hand. I have had 2 trips where we were planning on going and expecting nice crowd levels of 4’s and then a week or so before our trip you bumped them up to 7’s or 8’s. Either those 2 years were outlyers or you are not aware of how many people from our area come to Disneyworld during that spring break. Fortunately we had a great touring plan to navigate the crowds well!
At any rate – keep up the good work! I know the predictions get better and better every year as you get more data.
Chris,
Overall I think they do a great job with their predictions and I have found it very helpful for several trips we have made. Both in choosing when to go and to which park to go to. However, they are just predictions, and they do not and cannot control which parks people go to.
Just like weather sites or sports pool guides, they are predictions and wouldn’t exist if they weren’t the most consistant ones out there.
Jeff, you just provided the text for my next business card 🙂
There are no foolproof predictions out there. I personally experienced the biggest “miss” in Crowd Calendar 4 history (January 18 at DHS–predicted 3, actual 8) but still don’t see the point of whining about it. Was it a little annoying to be in such a crowded park when we didn’t expect it? Yes, but it didn’t really “hurt our Disney plans” all that much. We had a touring plan, we did rope drop, and we got out of there by early afternoon.
Did you really subscribe for just the Crowd Calendar? That seems like a waste of money to me–even if the predictions had been spot-on. There are other free calendars out there. IMO, they’re not as good–most of them go by their gut and don’t use computer models–but you’ll probably be happier with them since they’re free.
Personally, I got my money’s worth and then some with the Lines app that comes with the subscription. That helped far more than any crowd calendar ever could. Even on a 2 or 3 day, there are still going to be long lines for most headliners. And sometimes the parks will be “PACKED” but still rate a low CC number because the lines just aren’t that long.
That said, I do think we’re seeing a surge in crowds lately and some impact by the new FastPass+ system, which has caused a few misses lately. I have faith that as things stabilize and the CC models adjust to the new paradigm, the predictions will be more accurate once again.
I pretty much agree with everything you said. I also enjoy looking at the wait times app when I am not there and during the high seasons (to marvel at the wait times, and previously the FP times). I also was the victim of underestimations for part of my trip. But I still feel like I am better informed than not.
I think it is going to take a good bit of time and data collection to really shake out the impact of FP+ on crowds.