Walt Disney World Crowd Report – January 12 to January 18, 2014
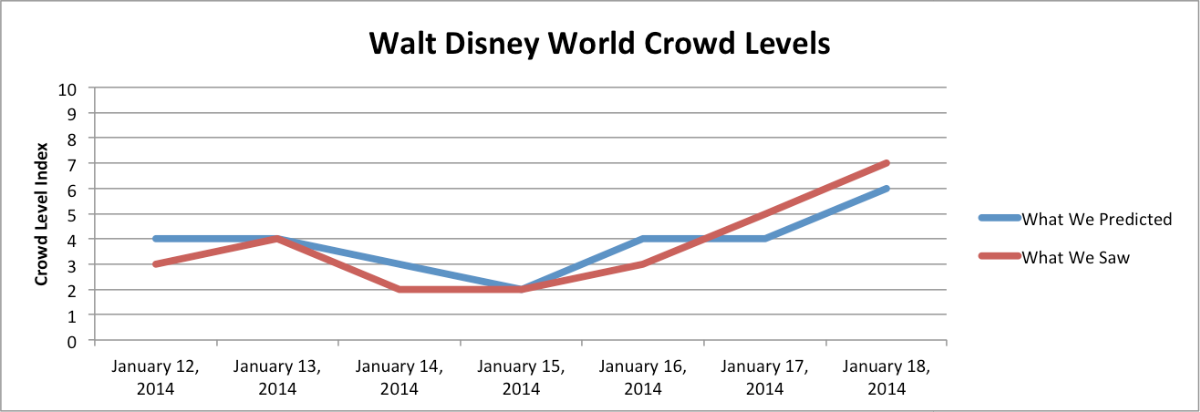
It is not hard to see from our Crowd Level chart how Martin Luther King, Jr. Day, the first holiday of the calendar year, brings a bump in crowd levels. Wait times stayed below average each day until Friday and Saturday, when they spiked to a ‘5’ and ‘7’ on our scale, respectively.
Let’s look at how the crowd levels stacked up day-to-day.

| January 12, 2014 to January 18, 2014 |
|---|
The beginning of the week brought a continuation of the low to moderate crowds of the previous week. The Resort-wide level was a ‘3’, one less than the ‘4’ we predicted. No park had wait times above a ‘4’ although we did predict ‘5’s at Magic Kingdom and Epcot. The Studios had the lowest crowd level as predicted. Toy Story Mania hit an average of 61 minutes, three less than the 64 minutes we estimated. This is about as slow as it gets at Walt Disney World’s most popular attraction.
Our resort prediction of a level ‘4’ was correct on Monday, an indication that crowds are still staying below average, although Magic Kingdom did reach a level ‘6’. Space Mountain and Jungle Cruise which both averaged 39 minutes were the two attractions that pushed the Magic Kingdom’s park-level one above our predicted ‘5’. However, many other attractions actually came in with lower than expected averages like Peter Pan (51 minutes) and Big Thunder (40 minutes). Animal Kingdom hosted Extra Magic Hour morning but stayed very quiet at a level ‘2’, the lowest level of the four parks, as predicted.
Tuesday’s numbers were even lower, with a resort-wide ‘2’ including a ‘1’ at both Magic Kingdom and Animal Kingdom. We did predict Magic Kingdom to be below average (4), but not that low. Only Peter Pan reached an average posted time above 20 minutes (31). Animal Kingdom was the best choice, as our crowd calendar suggested. Every Animal Kingdom attraction was a level one on our scale except DINOSAUR, which hit an average posted time of 14 minutes; that translates to a ‘2’ for that attraction.
Wednesday matched Tuesday for the least crowded day of last week, with a resort-wide ‘2,’ as well. The parks were all pretty even with a ‘3’ for Magic Kingdom, and ‘2’s for the other three parks. Our only predictions to miss the mark were Epcot (was a ‘2’, predicted ‘3’) and Animal Kingdom (was a ‘1’, predicted ‘2’), but missing by one is within normal error rates.
All predictions were within one index level again on Thursday, although only Magic Kingdom’s prediction of ‘5’ was bang-on. It’s interesting how Extra Magic Hour Morning at Magic Kingdom drew the largest crowd level of the four parks, while Monday’s Extra Magic Hour Morning at Animal Kingdom was the lowest of the four. Thursday’s park levels went ‘5’ for Magic Kingdom, ‘2’ for Epcot and the Studios, and ‘4’ for Animal Kingdom.
Friday brought some slight increases to crowd levels with all of our predictions under-predicting by one level. Magic Kingdom was a ‘6’ (predicted ‘5’), Epcot a ‘5’ (predicted ‘4’), the Studios a ‘4’ (predicted ‘3’), and Animal Kingdom ‘5’ (predicted ‘4’). All this combined for a resort-wide level ‘5’ on our scale, one higher than the predicted ‘4’. Magic Kingdom had the highest level thanks to averages like 28 minutes at Haunted Mansion and 51 at Peter Pan’s Flight. The Studios had the lowest, with observed averages of 13 minutes at Great Movie Ride and 74 minutes at Toy Story Mania.
The end of the week brought our biggest disappointment since the launch of Crowd Calendar 4 with a big miss at The Studios. We predicted ‘3,’ but posted times came in at a level ‘8’. Our other predictions on Saturday were all within expected error ranges, so this prediction sticks out like a sore thumb. Plus, our statistics tell us that a miss by five index levels should only happen once out of a thousand predictions. This error was partially due to an internal miscue with our database that we have since corrected. We apologize to anyone who chose to visit the Studios on Saturday based on our number. Resort-wide crowds were still only slightly above average at a level ‘7’, one higher than the ‘6’ we predicted.
| January 19 to January 25, 2014 |
|---|
The bump in attendance we saw this weekend will fade a little each day until Wednesday, when we return to below average wait times across the resort. In fact, the period between the end of the Martin Luther King, Jr. holiday and Valentine’s Day will see some of the lowest wait times of the year, with thin crowds that rival other slow periods like early September and mid-December.
To see Walt Disney World Crowd predictions for the days of your vacation, check the Crowd Calendar.

To get details about our predictions of future crowds or details about crowds in the past check out the Crowd Calendar and select “Jump to Date” on the left margin.


Like Dawn, we picked DHS–our very first visit to this park–based on the predictions. Pretty disappointing, and I was convinced TP.com was going to call it a “4” and say they were close. Glad to know this is a rare miscue and appreciate the “mea culpa.”
C’est la vie. We’re also the ones who routinely pick the wrong checkout line at the grocery store, so you’d think we’d be used to it by now. Still had a good time at DHS despite the huge crowd and love the personalized TPs–they were particularly valuable at MK.
Yes. We were at HS on Saturday, based on the predictions. I was like, “there is no way this is a THREE”! Big Miss. But we managed. Barely saw fantasmic due to threats of “Standing room only”. It was crowded, for sure.