Walt Disney World Crowd Report – March 16 to 22, 2014
Last week our predictions performed well again, hitting the mark more than missing it. There were a couple days where a park prediction missed by two index levels but never more than that except during a stormy St Patrick’s Day Monday.
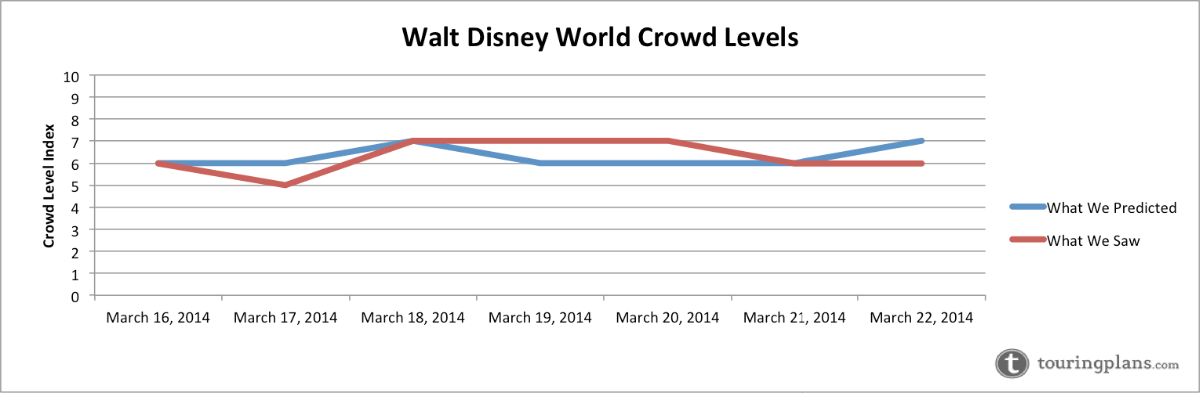
Let’s look at how the crowd levels stacked up day-to-day last week.
| March 16, 2014 to March 22, 2014 |
|---|
With the exception of a slightly higher than expected crowd at The Studios, Sunday crowds were as predicted around the resort. Resort-wide our prediction of a level ‘6’ was accurate. Despite the Extra Magic Hour evening which kept the Magic Kingdom open until 2:00 am for resort guests, crowds stayed one level below our prediction of ‘8’ at the flagship park. Wait times at The Studios translated to a level ‘6’ on our scale, we predicted a ‘4’. We did however correctly predict (within 3 minutes) the average wait times at the super headliners Tower of Terror (46 minutes) and Toy Story Mania (78 minutes).
Sláinte! Crowds gathered all day at Downtown Disney’s Raglan Road Irish Pub to celebrate St Patrick’s Day but rainy weather kept crowds at the parks lower than expected. Especially at Magic Kingdom and Animal Kingdom where actual crowds came in two and three levels lower than predicted, respectively. Only The Studios had a crowd level higher than predicted (a ‘6’, predicted ‘5’) which is not surprising given that park hosted Extra Magic Hour evening after the storms had subsided.
Animal Kingdom bounced back strong from the rainy crowd level ‘3’ on Monday with a remarkable crowd level ‘9’ on Tuesday. This high crowd level was two levels higher than predicted, mostly due to higher than expected wait times at Dinosaur (42 minutes) and Kilimanjaro Safaris (78 minutes). The rest of the parks were as predicted including the resort-wide crowd level of ‘7’.
Our prediction of a crowd level ‘7’ at The Studios and Animal Kingdom proved two levels too high for the former and two levels too low for the latter. This balanced out overall though, with a resort-wide crowd level ‘7’ (we predicted ‘6’). The wait times at Animal Kingdom’s Dinosaur were the biggest difference compared to our predictions, it had an average posted wait of 36 minutes, we predicted 23.
Our prediction of a crowd level ‘7’ at Animal Kingdom was accurate on Thursday and our other predictions were all within two including our prediction of a crowd level ‘7’ at Magic Kingdom on a day that it hosted Extra Magic Hour morning (it was an ‘8’).
Three of our five predictions on Friday ended up spot-on, including our prediction of a crowd level ‘7’ at Magic Kingdom, ‘6’ at Animal Kingdom and a resort-wide crowd level of ‘6’. The Studios was slightly less crowded than expected at a level ‘4’, we predicted ‘6’. All three headliners at The Studios had average posted wait times at least 10 minutes lower than predicted.
Again, our predictions proved accurate on Saturday with a resort-wide ‘6’ (predicted ‘7’), a ‘6’ at Magic Kingdom (predicted ‘7’), a ‘7’ at Epcot (predicted ‘5’), a ‘5’ at The Studios (predicted ‘7’) and a ‘6’ at Animal Kingdom (predicted ‘6’). Most surprising at Epcot on Saturday was the 29-minute average posted time at Spaceship Earth. This would be a clear 10 out of 10 for that attraction.
| March 23 to 29, 2014 |
|---|
The start of spring break is upon us and crowds around Walt Disney World will increase accordingly. We still like March as a time of year to visit however. The weather is nice and although crowds are larger than January and February they are easily manageable with a good touring plan. With a late Easter this year we don’t expect to see the same Easter rush that we would expect historically.
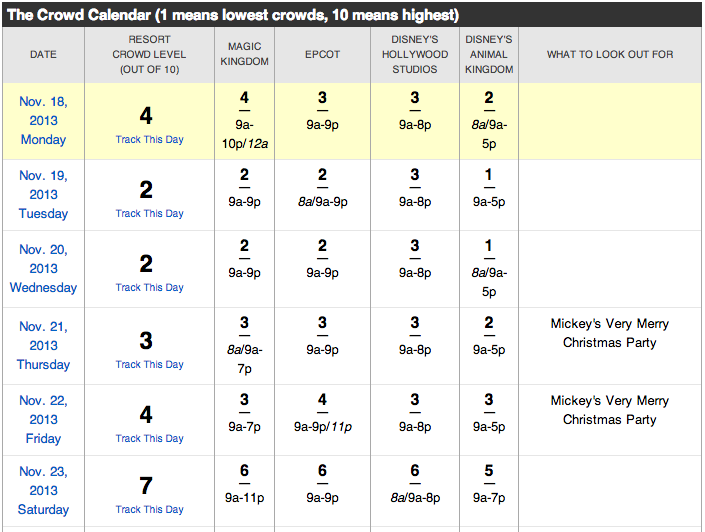
To see Walt Disney World Crowd predictions for the days of your vacation, check the Crowd Calendar.![]()
To get details about our predictions of future crowds or details about crowds in the past check out the Crowd Calendar and select “Jump to Date” on the left margin.
You May Also Like...
-

This weekend will have the longest park hours since Walt Disney World re-opened in July. Extended park hours are a signal…
-
We have been holding off on doing any big Crowd Calendar updates until we saw how the crowds were in 2021.…
-

Disney has shared another update regarding operational changes to Walt Disney World due to Coronavirus. 5 p.m. on Friday March 20,…
-

The February 2020 Crowd Calendar update is now live. So far 2020 is showing increased crowds at Walt Disney World. We…
This analysis is great information each week. Are there any plans in the future to also have an analysis of the Disneyland Resort crowd levels?
Great analysis, as always. You have noted several times in your blog posts that bad weather tends to make the predictions higher than the actuals. Have you noticed a corresponding “rebound effect” where the parks are more crowded than predicted on the next day once the bad weather has passed? Similarly, have you noticed a “good weather effect” where the parks are more crowded due to unseasonably nice weather?