What’s Up with Wait Times at Disney’s Hollywood Studios?
Wait times at Walt Disney World have been significantly higher than we expected over the last few months — 20% higher, year over year, in 2015. Since our crowd calendar is based on wait times, we needed to determine the causes. And we will have updated crowd calendars within a few days.
Today we’ll look at why we think wait times are higher at Disney’s Hollywood Studios. I’ll cover each WDW park in a separate blog post starting tomorrow.
We think higher wait times at Disney’s Hollywood Studios are almost entirely due to these 3 things:
- Closed attractions
- Mechanical problems at Tower of Terror
- Better handling of FastPass+ return lines in the park
We explain each of these in detail below. We also looked at whether Disney has changed the number of FastPasses available, ride capacity, the ratio of FastPass guests to standby guests, or whether guests are using FastPass+ significantly more now. We don’t see any clear evidence of those happening; that’s also explained below. (There’s also increased attendance at the other parks, which we’ll talk about when we cover them.)
Background
Our analysis needs a little bit of math, but it’s all pretty simple.
Take a ride like the Tomorrowland Transit Authority. Its track holds 32 ride vehicles. Each vehicle holds 10 people. One complete trip around the track takes about 10 minutes, so each ride vehicle goes around the track 6 times per hour.
The number of people that the TTA can serve in an hour is 1,920:
32 ride vehicles x 10 people per vehicle x 6 times per hour = 1,920
If the wait at the TTA is 10 minutes, that means there are 320 people ahead of you in line [1]:
10 minutes of wait / 60 minutes in an hour * 1,920 people per hour = 320 people
You can use the same calculation at rides with FastPass+, like Toy Story Midway Mania. TSMM has an hourly capacity of around 900 people. If the posted wait is 50 minutes, the number of people who get to ride before you is:
50 minutes of wait / 60 minutes in an hour * 900 people per hour = 750 people
Most of those 750 people will come from the FastPass+ line – in fact, around 80% of the people who ride before you will come from the FastPass+ line. We’ll use that information a bit later. For now, the thing to know is how to figure out the number of people ahead of you, using the standby wait and the hourly capacity at each ride.
Standby Wait Times for 2014 and 2015
We collect thousands of posted wait times from our users, from our employees, and from Disney’s My Disney Experience app, at every ride, in every park, every few minutes, every day. We’ve done this for many years, and we have over 8 million wait times.
Here’s the average posted wait in line for Toy Story Mania in January 2014 and January 2015, between 10 AM and 5 PM [2]:
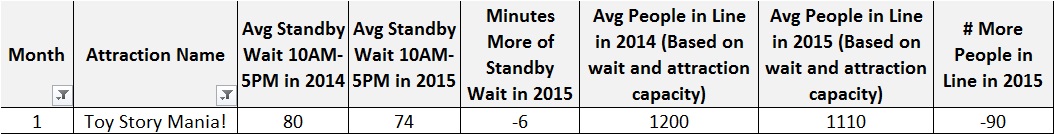
So in January 2015 at Toy Story Mania, there were around 90 fewer people ahead of you to ride TSMM between 10 AM and 5 PM, versus January 2014.
Here’s all the DHS attractions we track, for January 2014 and January 2015:

The red lines are for the Studio Backlot Tour, which closed in September 2014, and the Legend of Captain Jack Sparrow, which closed in November 2014. There were no people in those lines in January 2015. We think most of them got in line at other attractions.
There were also slightly fewer people in line at Muppets and Tower of Terror in January 2015. For the month, there were around 792 fewer people in line at all DHS attractions between the hours of 10 AM and 5 PM, as compared to 2014.
Here’s April 2014 and 2015. Easter was in April in both years, which draws high crowds in the weeks around it. Wait times were slightly higher in 2015. The higher number of people in line in 2015 almost exactly matches the number of people who were in line at the closed attractions in 2014 [3]:
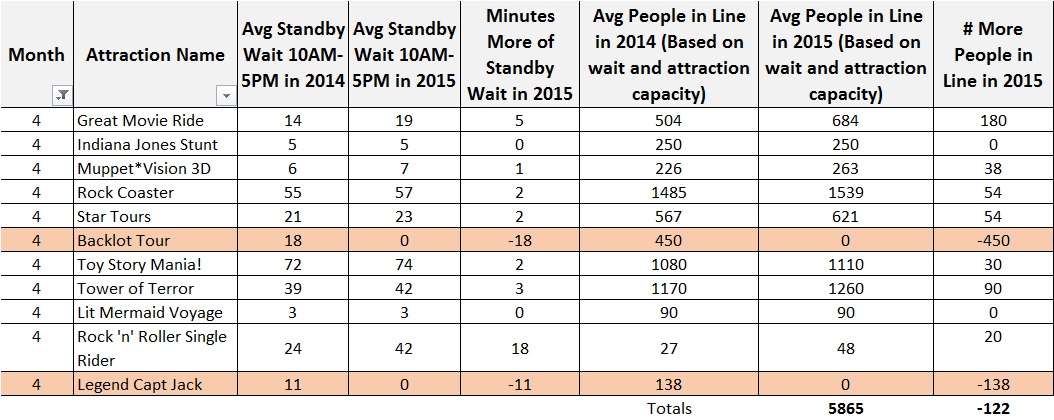
That’s kind of amazing. You can explain 98% of the increase in Easter wait times (122 out of 5,865 people is the remaining 2%) by showing that most guests who used to be in line at closed attractions, got in line at open attractions.
We summarize all of 2015 below.
But Wait…There’s More (Closed Rides, That Is)
The charts don’t include lines for The American Idol Experience, which closed in August 2014, or the Magic of Disney Animation, which closed in July 2015. These attractions didn’t have posted wait times, and we didn’t include them as part of our DHS crowd calendar. And they were not very popular. But American Idol had anywhere from 2 to 4 performances between 10 AM and 5 PM, and Animation had drawing classes, character greetings, and a few things to do. Some people were in those attractions.
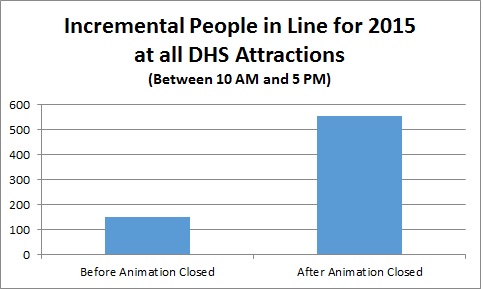
It’s reasonable to say that some of the people who used to go on those attractions now get in line somewhere else. Here’s the average number of extra people in line at DHS in 2015, before and after Animation closed:
Idol closed in August 2014. Here’s the year-over-year difference in extra people in line for September and October (there’s some overlap with Animation, too):
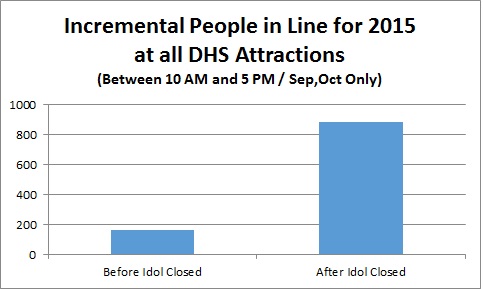
Saying that people move from closed rides to open rides is obvious. It’s the scale of the impact that’s interesting.
How Ride Closures Increased 2015 Wait Times
Wait times are up 20% at DHS for rides open in both 2014 and 2015 (from 30 minutes to 36 minutes) so far this year. That works out to around 319 more people in line at the open rides. But the closing of Backlot Tour, Legend of Captain Jack Sparrow, American Idol, and Magic of Disney Animation account for all of this change and more. In fact, attendance may be down slightly at DHS. Here’s why we think that.
Of all the extra people in line at DHS at any given time in 2015, almost 45% happened at Tower of Terror in February and March:

Tower’s wait times were up 85% in February and 25% in March. It was up 4% in every other month of 2015. That indicates mechanical issues at Tower of Terror, not a brief flash of popularity.
A Smoother FastPass+ Return Experience Increases Standby Waits
When Disney World transitioned to FastPass+ in early 2014, it did not start well. (We wrote a blog post about it in March 2014.) Many guests didn’t understand how it worked. Verifying a reservation took too long, and Castmembers had to deal with MagicBand hardware issues. What used to be a 5-minute wait with paper FastPasses, often turned in to a 10- to 15-minute wait to use FastPass+. Guests complained about long FastPass+ return lines, when the whole point was to make lines shorter.
The problems with FastPass+ in 2014 meant FastPass+ impacted standby wait times less in 2014: Because people had problems getting in the FastPass+ line, a bit more of each ride’s capacity went to standby guests, reducing the standby wait in line.
Most of those FastPass+ issues have been resolved in 2015. MagicBands scan faster, and when lines start to develop, Castmembers have been trained to scan only one person’s MagicBand, instead of everyone in a group. Since it’s faster to get into the FastPass+ line now than in 2014, standby lines are slightly longer.
To put this in perspective, in 2014 we estimated that your wait to use FastPass+ was going to be 15 to 25% of the posted wait time. That’s closer to 10% in 2015. It’s not perfect – long lines still happen sometimes – but it’s better. And we think it’s increasing standby wait times slightly versus 2014.
Why Our Crowd Calendar Didn’t Anticipate These Changes
We track hundreds of variables for our crowd calendar models, everything from park hours to weather. One of variables is “Total ride capacity lost to closures.” And we had the right numbers in there, but the models didn’t adjust properly. At this point, we think that model didn’t give enough emphasis to the high number of ride closures. The models seem to work well with one or two ride closures (we’ve done pretty well at Epcot for 2015, even with Maelstrom and Captain EO closed), but we don’t think the model has ever seen this many rides closed in one park at once. We know that the model sometimes has trouble with things it hasn’t seen before, and we’re working with the company that wrote our modeling software to make sure we make the right adjustments [4].
We should have an updated Crowd Calendar out within a few days. Once we think we’ve got mass closures handled properly, we’ll do another update after that. We know both Soarin’ and Maelstrom will be closed at Epcot in early 2016, and we want to make sure we handle that.
Other Ideas We Considered
Lots of people have a many ideas about what’s causing the higher wait times. We tested many of them and found them less convincing. Here’s a short list of some things we tested.
Is Disney Intentionally Lowering Ride Capacity? No. I said this on a WDWToday podcast and in blog comments here. I don’t think it’s true now. You can explain virtually all of the wait time increases across all four parks by looking at attraction closures, more efficient FastPass+ lines, and mechanical issues. Disney management may be a lot of things, but they’re not Enron. I regret saying it, and I apologize.
My spokesman, Arthur J. Fonzarelli, will now read a prepared statement on my behalf [5]:
Are Posted Standby Wait Times Artificially High? Not as far as we can tell. It’s well known that the posted wait time outside a ride is usually wrong. It’s wrong at every theme park, including Disney. And it’s often wrong on purpose: sometimes it’s meant to be a pleasant surprise, such as when the posted wait time is 60 minutes and you only wait 45. Other times it’s a way for park management to tell you to go somewhere else, such as when Toy Story Mania has a posted wait of 80 minutes at park closing, when the actual wait is 15; they want to close the park on schedule and avoid paying overtime.
Our Lines app lets our users send in both Disney’s posted wait, and the actual amount of time they spent in line. We compared the ratio of actual waits to posted waits for 2014 and 2015 over 11,000 samples. That’s not a huge number. At many minor attractions, we don’t have enough actual wait/posted wait pairs to say anything. But for the big attractions, as far as we can determine, the ratio of actual wait to the posted wait time has not increased significantly across WDW. (If anything, the posted waits are getting slightly more accurate at some attractions.)
Is Disney Prioritizing FastPass+ Guests Over Standby Guests More in 2015? Not according to Castmembers or our counting.
When Disney adds FastPass+ to an attraction, it has to set aside a certain amount of the attraction’s capacity for FastPass+ riders. The default is around 80%, meaning 4 FastPass+ users will ride for every 1 standby guest (a 4:1 ratio). If a bunch of FastPass+ users show up all at once, the Castmembers at the ride can bump up the ratio to 10:1, meaning 91% of the ride’s capacity goes to FastPass+.
If that doesn’t reduce the FastPass line, Castmembers can take 20 FastPass+ guests for every 1 standby guests – 95% FastPass+ allocation – until the FastPass line disappears.
How do we know this? We asked Castmembers what the rules were, and they told us. Then we counted the number of people in line to check their answers.
Last Thursday, we sent Seth, one of our researchers, to stand in line at Peter Pan. It had a 60-minute standby wait. When he got to the front of the line, just as he was about to board, he turned around and walked back through the line, counting the number of people in the standby line as he passed them. He counted 196 people, and the posted wait was still 60 minutes. That indicates around 82%% of the ride’s capacity was being held for FastPass+ guests, almost exactly the 4:1 ratio the Castmember said it would be.
Seth found the same 4:1 ratio at The Many Adventures of Winnie the Pooh, Princess Fairytale Hall, Jungle Cruise, Buzz Lightyear, Space Mountain, and later at Toy Story Mania. The Castmembers at Seven Dwarfs Mine Train said they used a 3:1 ratio (i.e., 75% FastPass+ and 25% Standby); we counted the number of people in line yesterday and that was accurate. It’s a Small World was slightly higher on Thursday (around 90% / 10%), but back to normal yesterday. So with only a few exceptions, 4:1 seems to be the standard ratio, and has been for a long time.
Is it FastPass+ Supply or Demand? Fred, Steve, and I spent a long time looking at this. As far as we can tell, there’s no clear trend on FastPass+ supply, demand, or the relationship to standby wait times.
First, a couple of things: We track the FastPass+ availability every few minutes, at every attraction, every day, up to 60 days in advance. As I write this, we have more than 16 million FastPass+ data points. Knowing when FastPasses run out helps us tell you which FastPasses you should get in advance, and which attractions should have FastPasses on the day of your visit.
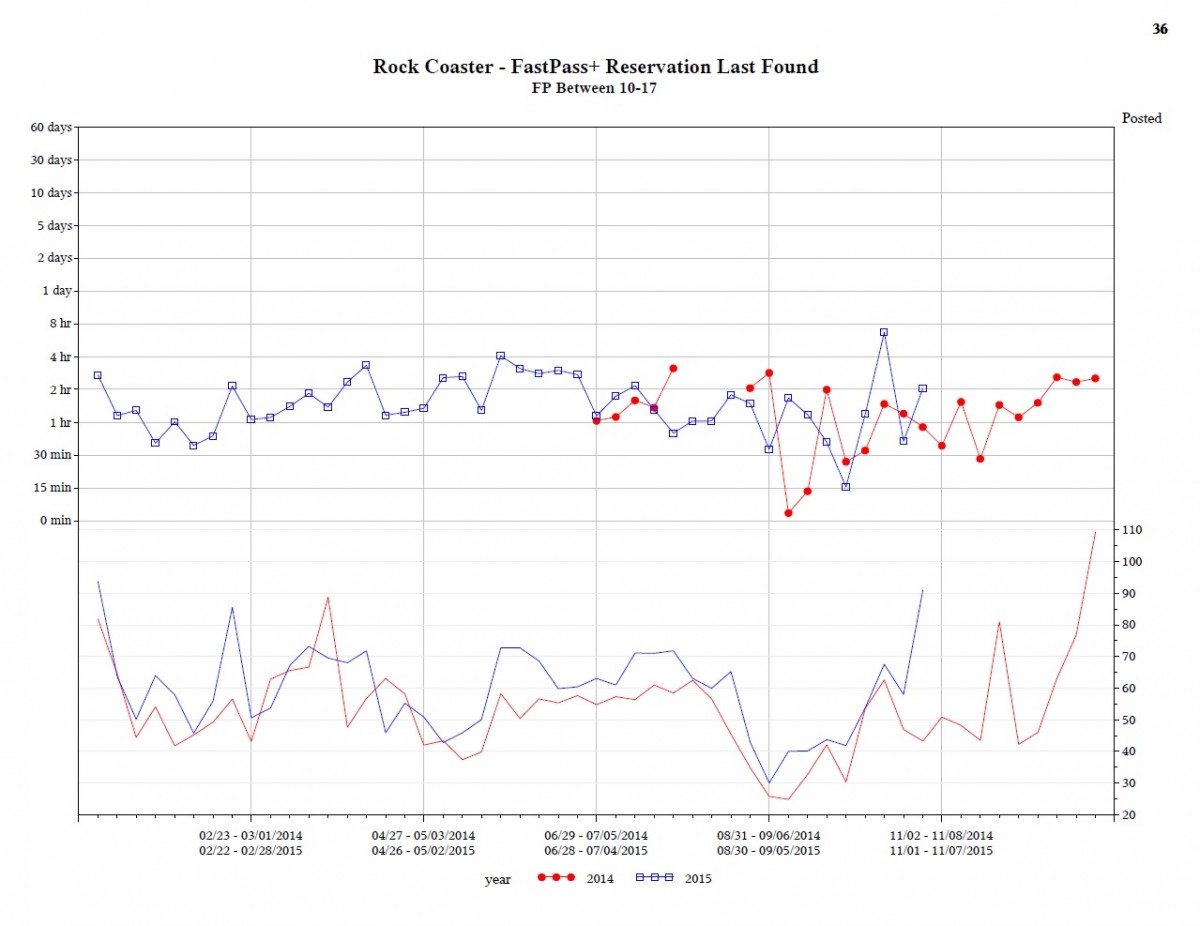
Here’s a chart showing Great Movie Ride’s average FastPass+ availability and standby wait times, by week, between 10 AM and 5 PM, for 2014 and 2015. The Fastpass+ times represent the amount of time before a Fastpass+ reservation became unavailable. So for example, if at 10 AM the last available reservation was for 10:45, that would be 45 minutes. If on a Tuesday we saw the last reservation get nabbed on Sunday that would be two days.

The lines in the top half of the page show when FastPasses run out. Red lines are for 2014, blue for 2015. Higher lines mean FastPasses ran out faster.
There’s a small gap in 2014 FastPass+ data, where our code broke and we didn’t collect anything. But even then, it’s clear that for much of 2014 and 2015, you could get a FastPass+ for Great Movie Ride within 15 minutes of “now” – an “instant” FastPass. If demand for FastPass+ was up in 2015, you’d expect FastPasses to run out sooner; the blue line for 2015’s FastPass availability would be consistently higher than 2014’s red line. But it doesn’t look like that.
The bottom half of the graph shows the average posted wait time at Great Movie Ride. Again, red lines are 2014 and blue lines are 2015. Wait times are significantly higher since early April 2015, even when you could get an “instant” FastPass on the same times both years. In fact, it was harder to get a Great Movie Ride FastPass in late July 2014 than in late July 2015, and waits were higher in 2015. So no matter whether FastPasses ran out faster or slower in 2015, wait times seem to be higher.
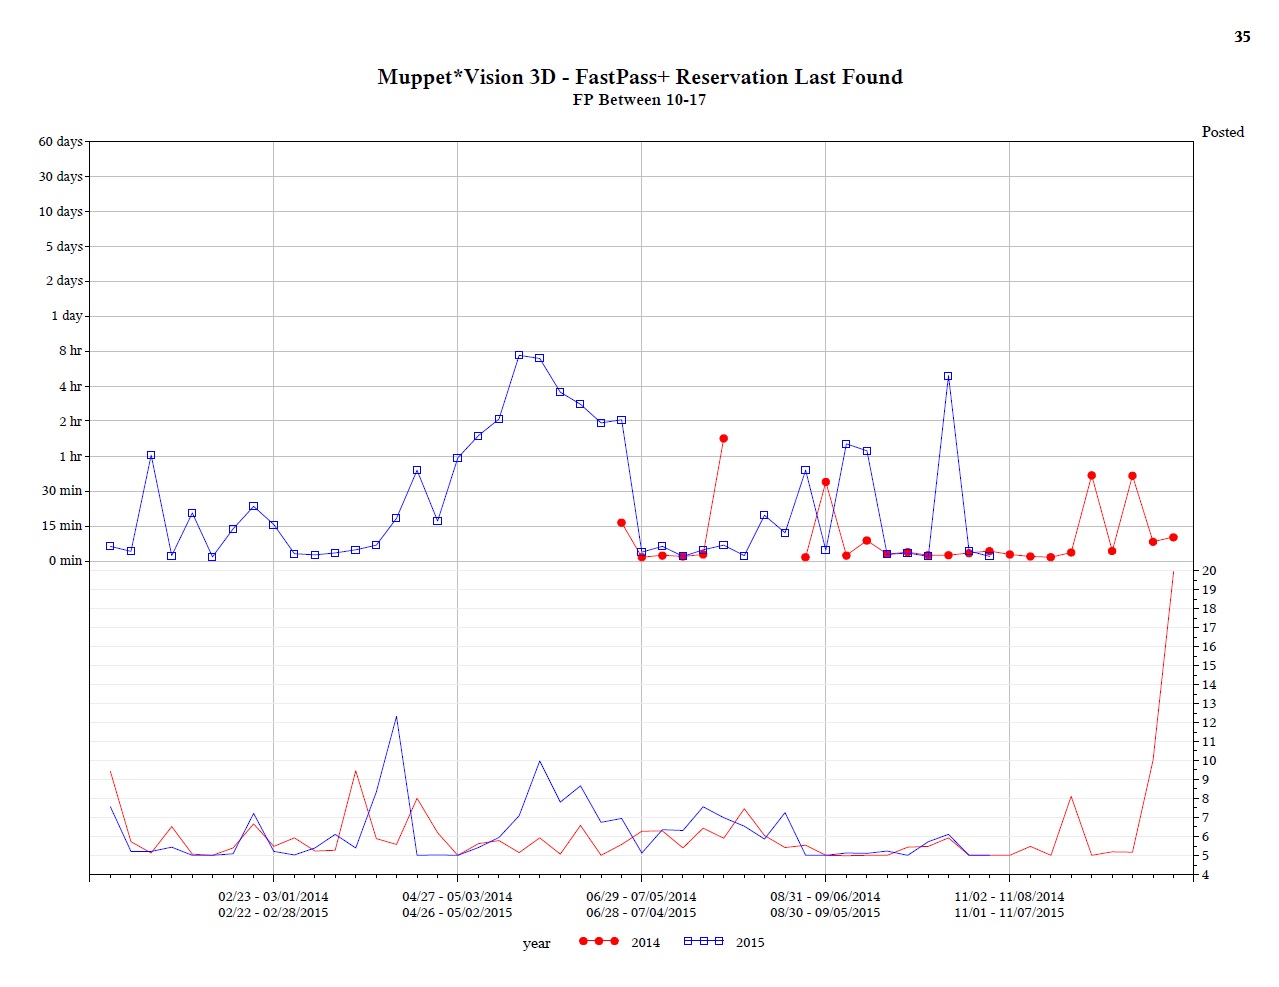
Here’s MuppetVision 3D. We wouldn’t recommend using FastPass+ at Muppets. The thing to note is that there doesn’t seem to be a clear relationship between FastPass+ availability and standby waits. The two lines don’t move in tandem.
Here’s Rock ‘n’ Roller Coaster:

FastPasses ran out as fast or faster at Rock ‘n’ Roller coaster for 8 weeks in the second half of 2014 versus 2015, but wait times are higher (or the same) in 2015.
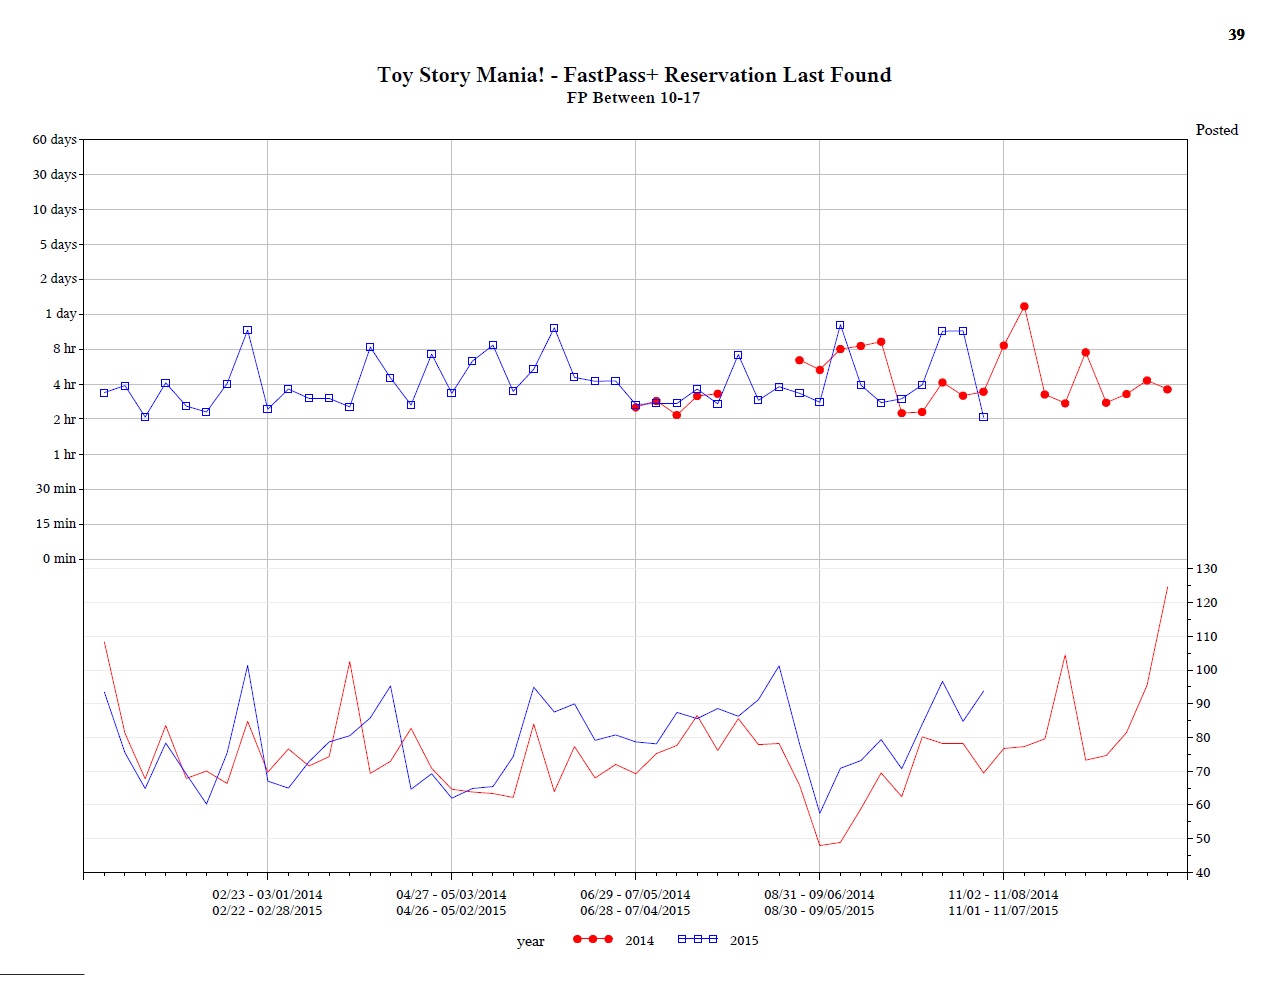
Here’s Toy Story Mania. Again, it was harder to get FastPasses in some weeks in 2014, yet wait times are higher for the same weeks in 2015:
“But wait!” you say. “What if Disney increased the supply of FastPasses AND guest demand also increased? That would explain the higher standby waits.” We thought of that, too. We don’t think it’s happening. Here’s how we checked.
If Disney increases the supply of FastPasses at a ride, they increase the amount of the ride’s capacity that’s dedicated to FastPass+. Remember that the default is a 4 to 1 ratio, or 80% – the Castmembers told us that. So that hasn’t changed.
“But maybe management increased the supply and didn’t tell the Castmembers!” We checked that too. It doesn’t seem to be happening. Let’s say management decided to allocate 90% of Toy Story’s capacity to FastPass+. If that happened, just 81 people in line would result in a 60-minute standby wait. We counted the number of people in line, though, and compared it to the standby time; it’s the same 4:1 ratio as it’s been.
To finish off the Studios, here’s Star Tours. There were 6 weeks in 2014 where it was harder to get a FastPass+, yet wait times were lower:

Here’s Tower of Terror:
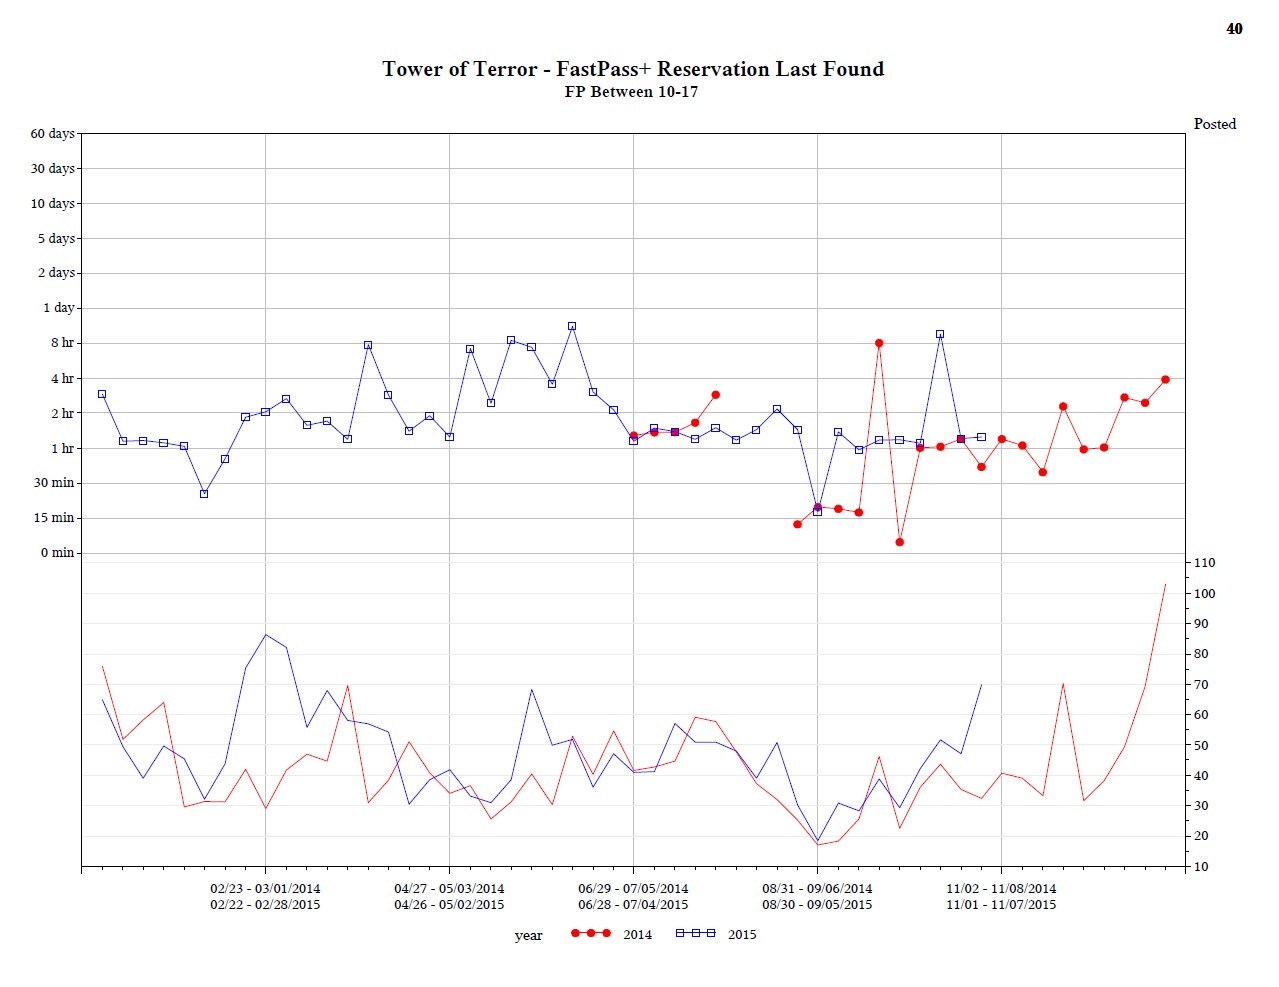
There are actually a few weeks here where you get something that kind of looks like a pattern. Late June’s FastPass+ availability and standby waits look the same for 2014 and 2015, and the high FastPass+ availability for the week of 8/30/2015 matches the lowest standby waits of the year. So that’s promising. But overall, FastPasses have been available consistently about 1.5 hours in advance since the end of June 2015, while wait times have fluctuated between 30 and 70 minutes, so that’s hard to explain.
We also don’t think there’s a clear relationship between FastPass+ availability and standby waits in any other Disney park. We’ll show that over the next few days.
FastPass Supply and Demand In General We also looked at the possibility of any other combination of change in FastPass+ supply and demand. On the supply side, there are 3 possible options:
- Disney has increased the number of FastPasses available
- The number of FastPasses available has stayed the same
- Disney has decreased the number of FastPasses available
The same things could have happened on the demand side. That gives us 3 x 3 = 9 possibilities.
To see whether any of them are true, it’s helpful to consider what would happen to the FastPass+ availability lines in the graphs above in any scenario. Here’s a chart showing what you’d expect to see with those lines, for all 9 possible changes in FastPass+ supply and demand:
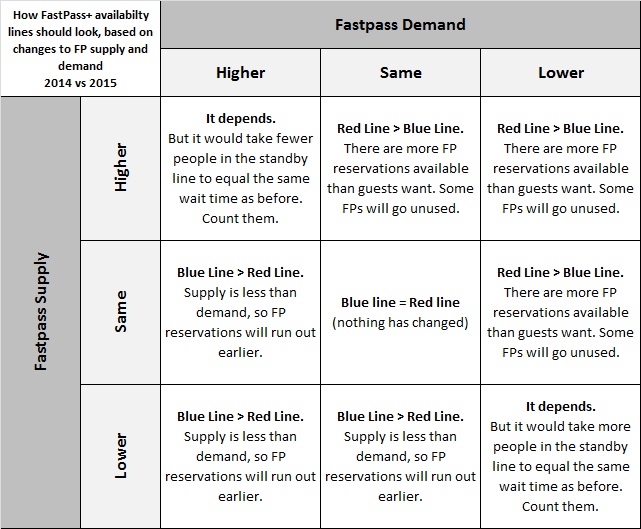
We don’t see a consistent pattern in the year-over-year availability of FastPasses across DHS attractions. That means we can probably rule out all of the options except for the ones in the upper left (“higher supply/higher demand”) and lower right (“lower supply/lower demand”). But as we’ve shown above, counting the number of people in the standby line doesn’t seem to support either of those two scenarios. That’s why we don’t think there have been major changes to FastPass+ supply or demand.
Of course, Disney could be changing the FastPass+ supply dynamically every day (without telling Castmembers to change the FastPass line ratios), differently at each attraction, based on things like projected hotel occupancy or weather, in a way that produces the trend lines above. That would be really hard for us to see (and harder to prove). It would also be moderately complicated to implement, and I’m not sure what the goal would be there. But it’s possible.
So that’s where we’re at for now. Closed attractions and better FastPass+ systems seem to be the best explanation for Hollywood Studios wait time increases. We’re making adjustments to the models and calendars, and we’ll have updates out within a few days. Thanks for reading. See you tomorrow.
Footnotes
[1] In the real world, the actual number of people who ride per hour is almost always lower. Rides sometimes stop temporarily to let people on or off, or for temporary mechanical issues. As long as we use the same attraction capacity for 2014 and 2015, the calculations work out the same. We used the same attraction capacity for 2014 and 2015 which means we are assuming the “real-world” capacity was the same in both years.
[2] Our crowd calendar is based on the standby wait times between 10 AM and 5 PM, at certain attractions in each park. We’re using the 10AM-to-5PM time period here for consistency.
[3] Backlot Tour was closed in February 2014 and February 2015.
[4] Our wait time modeling software is Treenet by Salford Systems. It’s a stochastic gradient boosting modeling engine. It’s more accurate than regression models, which we used in previous versions of the crowd calendar. Our lead statistician, Fred, came to us from Statistics Canada. Our other statistician, Steve, was a statistician at the Centers for Disease Control. That doesn’t guarantee they’re right all the time. But they have some idea of what they’re doing. 🙂
[5] What does the “J” in “Arthur J. Fonzarelli” stand for?
You May Also Like...
-

Just after wait times plummeted following Labor Day Weekend, we've begun to see an uptick at wait times at Walt Disney…
-

Guests can catch a brand new entertainment offering at Disney's Hollywood Studios and I think it will be music to your…
-

Guests will be able to once again see the nighttime projection show, Disney Movie Magic beginning on March 13. Disney Movie…
-

Today is Disney's Hollywood Studios 30th Anniversary! This morning, to celebrate, the park held a fun mini parade and also discuss…
Very interesting analysis, but worrying for Epcot for our next trip in April. Soarin not being open is disappointing but especially if every other ride gets worse queues. Maybe Disney could reduce prices with so much shut at Epcot and Hollywood ?
Is the reverse also true – when a big new ride opens does it reduce lines in the rest of the park(s) ? You probably have the data from the 7 dwarves mine train impact. Or does it just increase the attraction of the Disney. I wonder if some of the rise in Disney lines is that the initial huge pull of Potter at Universal diverted some people there and this is stabilising and they are coming back or it has increased overall attendance at all parks.
With that in mind, whay would be the effect of the opening of the Frozen atraction at Epcot?
We were at HS on 10/24 and it was crazy. 120 min waits on all the major attractions. A regrettable tour day. We did see that there were a couple of large (~200) special needs tour groups on site which we figured contributed to the mess.
Thank you guys for this breakdown. I love your posts and how transparent you are with your process! Keep it up!
Fascinating! Great work!
Len,
Thanks for the great post. Please have your staff create more great news and data-driven articles like this for your blog, because this is exactly the type of content that we come to the TouringPlans blog to read!
Either I’m completely misunderstanding or there’s a typo:
“Here’s a chart showing Great Movie Ride’s average FastPass+ availability and standby wait times, by week, between 10 AM and 5 PM, for 2014 and 2015. The Fastpass+ times represent the amount of time before a Fastpass+ reservation became unavailable.”
Should the last word be AVAILABLE? Ie, 45 minutes until next FPP availability? Thanks for clarifying!
Ah, good question. It’s the average time in advance that no more FastPasses were available for the ride.
Take Rock ‘n’ Roller Coaster as an example. The left-most blue dot (for the first week of January 2015) is around 3 hours. That means that, on average, the last FastPass for a ride at 10 AM was gone at 7 AM that same day; the last FastPass for a ride at 11 AM was gone at 8 AM that day, and so on.
Thank you for such a fascinating and informative post!
Color me impressed!
We are doing a lot of talking about DHS and Epcot in my house right now as we plan a trip for Spring Break 2016. We are sad that Soarin will be closed during our visit. And we are very much on the fence about whether to shift from DHS to Animal Kingdom in light of the increasing wait times.
Our guess, curious what you think, is that this effect will be magnified on days when the crowd level is a 10!
Geeking out here with all of this info – thanks Len! Can’t wait for the rest of the articles!
WOW! You and your team are amazing! Thank you for all of the great info!
Len, a great analysis and discussion.
One further point that I’ve not seen anyone discuss is the impact of a hypothetical increase in variability in arrival rates or service rates on standby by waits.
As you know better than I, in simple waiting line equations an increase in the standard deviation of either of these has a squared impact on expected waits. Disney’s stuff is much more complex than these simple equations, but for real world reasons I’d still expect increases in variability to have a non-linear impact on waits.
Increased variability could come from operations (more breakdowns adds variability to both that ride’s service rates and to other rides’s arrival rates) or from micro behavior–old “patterns” of how people moved in the park because of the timing of American Idol shows have changed… I have no idea how to test it, but non-linear reasons are always interesting to pursue when you are seeing such major output changes in response to what seem like minor input changes…
I can tell you from our last trip that it is difficult to put a finger on why crowds are up but at every park we visited the first few days in Oct. there were more people everywhere. It was not only crowded on the rides but on the walking paths so I don’t think you can just go by ride times any more. I also think you have to figure in because it’s harder to get fastpasses once you get in the parks more people are not riding rides but enjoying the parks themselves.
I was there last year from Oct 8-14. There are numerous school districts that get out for Fall Break for the two weeks around Columbus Day and it seems as though more and more are following the advice they have been hearing for years that this was typically a slow time. We will be there for Nov 18-26 this year and I am curios to see if crowds will be the same since Oct was so heavy. Hoping those took their trips in Oct that would have taken them around this time, but the fact that I am coming in around the end of a Free Dining promo I doubt that will be the case. Oh well. We have come to except that this is the new norm at Disney. We have 8 touring plans so we will make the most of it.
I’m totally geeked out!
Just curious if the heavier volumes at MK could be attributed to people going there multiple days instead of other parks (e.g. AK or HS) because of the closures and mechanical issues you’ve detailed and in the case of HS just not as much to do (not enough bang for our buck). I know when my family goes back next year we are likely to skip HS and visit MK multiple times instead.
This maybe in the article and I missed it but when you say FP distribution hasn’t increased is that just compared to the implementation of FP+ or has it not increased over the number available through the old system?
I think you underestimate DHS’s appeal to families with smaller children. I would think most families prefer it over EPCOT or even Animal Kingdom. There are pre-school and school age friendly shows that appeal to this age bracket. Toy Story, Disney Junior, and Frozen are very popular with this crowd. Its also the only place to meet Phineas and Ferb. Our family has spent two days DHS for our past two trips at the children’s request. Most other families I talk to say the same thing and indicate its their second favorite park after MK.
Shortly after I moved to Florida, my TP subscription ended. With all the changing infrastructure in WDW and the fluctuating crowds, I chose not to renew (I no longer vacation here…so what’s the use).
With this much detail put into your crowd calendars and wait time apps – I have a feeling come next payday I’ll be repurchasing an account.
I think your analysis is excellent but I’m surprised that you didn’t mention the one obvious variable, that is, Disney park attendance has risen year over year for the past couple of years. It was up 4% ’14 vs ’13 and based on comments by Disney is up again this year. That would certainly account for some increase in wait times. Second, minor point, while the 4:1 ratio is the usual target, the ability of the CM working merge does influence the result at any given time. some CMs are just better than others at handling flow control.
Thanks Wayne! We’ll talk about attendance growth with the other parks. I’m skeptical that it’s happening at DHS. I wouldn’t be surprised if attendance is down. I expect Animal Kingdom to move into 3rd place (and DHS to drop to the bottom) when 2015 attendance is announced.
Have you ever tried to determine how an incremental increase (or decrease) in a park’s attendance affects wait times?
I know it would be difficult to do this because Disney does not release daily attendance figures. It stands to reason that higher attendance is going to translate to longer wait times if all other factors are equal (number of attractions operating, park hours, etc.) But I wouldn’t expect that to be directly proportional to attendance. For example, it shouldn’t be hard to find 2 days in which the average wait times on 1 day are roughly half of what they are on the other. But, I wouldn’t think that would mean that there were half as many people in the park that day.
Do you have even a rough idea of how many people are in a park on the most and least crowded days?
Thanks Jack! Disney’s given us actual attendance numbers at certain times in the past. We might be able to use that to correlate wait times to actual people in the park. It would be a rough guess, but it might be possible.
First off thanks for all the info. I am like someone else that posted the comment that their two favorite things are Disney and data. Relative to the comment above regarding attendance figures. Couldn’t you back into this based on the example you gave based on wait times and ride capacity? You have all of the data from every day for every ride and every wait time, couldn’t you just use that to calculate it out?
It would have to be rough, but I think there is some feeling that a 10% increase in attendance should produce only a 10% increase in wait times, and I’m not convinced that it’s that simple.
Even without correlating attendance to wait times, it would be interesting to know how much variation there is in a park’s attendance from day to day. For example, the differences in average wait times at the MK that you posted for Tuesday, October 13 and Wednesday, October 14 are pretty dramatic. Most of the averages are roughly 50-100% higher on Wednesday (a day with longer hours and no Halloween party). I wonder if there were 50-100% more people in the park on Wednesday, especially in the middle of the day when you do your calculations.
There are two things I love: Disney and data. I really enjoyed your analysis! I’d love to see more articles like this in the future. Keep up the good work!
I know this is a small point in the overall article…
“Tower’s wait times were up 85% in February and 25% in March. It was up 4% in every other month of 2015. That indicates mechanical issues at Tower of Terror, not a brief flash of popularity”
Tower was running at half capacity for about half of February and into March. They took down each elevator for a time to perform maintenance. So not necessarily mechanical issues, but mechanical upkeep (semantics, I know)
Wow – thanks Liz! That’s great to know!
Thaks for this post Len, you made me open a spreadsheet file to follow the reasoning and hopefully get new ideas for problems for my students in my Simulation and Queue Theroy class! Great way to match my passion for Disney Parks and my job.
Len, could your next project be a workbook or a series of Khan Academy-style videos that use Disney Parks situations to explain mathematical concepts? You’ve very nearly made me care about statistics. Thanks for all you and your team do!
Thanks Len! I look forward to reading your follow-up posts over the next few days.
Do you think it’s possible that the closures at Hollywood Studios are the main cause of the unseasonably high crowds at the other parks, especially MK?
Thanks Matt! Yes, I think that’s happening, probably more to AK than to MK. We’ll talk about it when we get to AK on Saturday.
What happened to us last week at Hollywood was unpredictable, but impacted wait lines for all the rides in the park…
We showed up for our 3:15 fastpass at Toy Story Mania and found it closed for “technical problems”. We got an e-mail that said we could use that fastpass for any ride from 3:15 to close that day. We DID wait until Toy Story was up again, but the fastpass line was down the street!
A similar thing happened when Rockin’ Roller Coaster was down most of the day; the gate to that area was even closed. So of course, people went to the next closest ride: Tower of Terror. I think we saw 80 minute standby wait because of the fastpass saturation. It cascades thru the day when a ride continues to be down.
It worked to our advantage though, in Magic Kingdom when Splash was down. We had no fastpasses, but rode Big Thunder and hung around the area. When we heard the screaming from Splash again, we got in the standby line; which was posted 50 but was maybe a 10 minute line. I’m sure it was much longer after the fastpassers found it online again!
Thanks John. It would be quite an impact to DHS crowds if TSMM and RnRC were down on the same day. I’d like to be a liquor salesman near where the park managers live.
This is very interesting.
The crowd calendar forecasts seem to have been falling down over the last several weeks. Do you guys think the factors you’re talking about explain the higher crowd numbers you’ve seen this month?
I’m very interested to see the updated forecasts, since we are planning a trip during my kids’ fall break from school in 2016, which is always the week of Columbus day. If we’d gone this year, we would have seen resort crowd levels of at least 7 each day, and up to 10 on Sunday. On our trip last year, the comparable week was 4s to 6s.
If we’re going to see this level of crowds, we could go the last week of July or the first week of August (resort crowd levels of 7s to 9s this year), and have longer park hours and more opportunities for nighttime entertainment at Magic Kingdom. Or we could go during Spring Break and maybe see lower crowds (6s and 7s this year), which seems crazy to me.
Thanks Charles. Yes, we think the Studios’ higher wait times are mostly attributable to the closed attractions and our models not handling that well. We’re updating the models now.
For what it’s worth, the situation at DHS isn’t going to get much better any time soon. There’s only so many temporary attractions they can open to take the heat off whatever’s left. As compared to 2014, you should see higher crowds well into 2016 and beyond at DHS.
Excellent post. I realize that it is a blaming the messenger type thing, but my wife and I are driving down to the World next week for a 2 week 15th anniversary blow out and I am dreading the calendar updates based on the ugly trends I saw last month. This was already on top of a big bump several months ago that saw 2s and 3s turn to 5s and 6s.
In any case, and off topic, thanks for all you and the rest of the Touring Plans team do. This is our first trip to WDW (we are Dianeyland experts), and your books, website and podcasts (Jim Hill and WDW Today) have gone a tremendous way towards making a big confusing trip much more manageable. If you ever need someone to buy you drinks in Pittsburgh, I’m here for you!
They’ve also closed (either temporarily or permanently) some minor attractions at Hollywood Studios that ate up some of our time in the past like the Jedi Training Academy or the Baymax meet and greet. Those would likely account for a decent number of people with nothing else to do. 15 Jedi Training Academy shows per day with an average of 30 or so kids participating in each show, plus parents/grandparents/friends/others watching would be close to another 125-150 people per hour in itself (since the next show is supposed to arrive at least 30 minutes before the show starts, so at most times you have almost 2 full shows-worth of people waiting for this).
I am absolutely stealing your People Mover equations for my students. Talk about a real world, engaging problem! Thank you!
Interesting analysis.
You make the comment that the ratio between posted waits and actual waits has not changed significantly. In your experience, what has that ratio been historically at different attractions?
If the ratio has remained the same, but the posted wait has gone up, that could be significant, especially for some of the “secondary” attractions which seem to have experienced significant increases in posted wait times in recent years. For example, if the average posted wait time for a ride like Haunted Mansion has gone from 20 minutes to 40 minutes, has the actual wait time increased by 20 minutes, or has it gone from 10 minutes to 20 minutes because the actual wait time has usually been about half of the posted time?
I don’t expect you to have precise data on this, but I would be interested in your impressions. I know that our experience over the years has been that our actual wait has been less than the posted wait much more often than it has been the same or longer.
Thanks Jack. Let me get through the other park posts and I’ll circle back with those numbers by attraction. Ballpark, though, the actual wait is probably between 60 and 90% of the posted.
It would have to be rough, but I think there is some feeling that a 10% increase in attendance should produce only a 10% increase in wait times, and I’m not convinced that it’s that simple.
Even without correlating attendance to wait times, it would be interesting to know how much variation there is in a park’s attendance from day to day. For example, the differences in average wait times at the MK that you posted for Tuesday, October 13 and Wednesday, October 14 are pretty dramatic. Most of the averages are roughly 50-100% higher on Wednesday (a day with longer hours and no Halloween party). I wonder if there were 50-100% more people in the park on Wednesday, especially in the middle of the day when you do your calculations.
Great post, nice analysis. My kids get to read posts like this and I get to say see math will be important later in life. 🙂
Thanks!
If this whole “Touring Plans” thing doesn’t work out for you, you’d make a kick-ass Junior High or High School Math teacher. Talk about real-world application! Thanks for all you do, Len!
Thanks!
Thinking just the opposite. As a current high school math grew her and Disney phile, I want to work for you when I retire!
Same here, a dream come true to be conducting research at Disney Parks. I love the scene of Seth turning around at the end of the line of Peter Pan to count the people!! Imagine the face of the people around him!
The J stands for “Herbert”. It’s a soft J, like in “Jalapeno”.
I will assume this is true from now on.
In this case, it has to be Jumptheshark, since the Fonz was the source of that term.
Thanks Stephanie! Tomorrow’s Epcot post will be shorter. 🙂
Wow. This gives me an even bigger appreciation of all that you do! Thanks.