Walt Disney World Crowd Report – December 29, 2013, to January 4, 2014
Happy New Year!
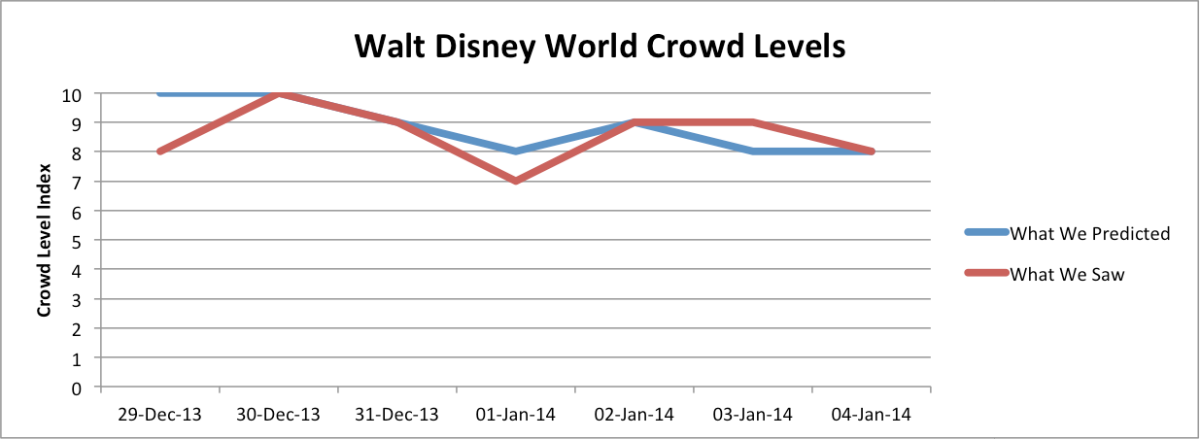
Crowd level predictions this week did very well at the resort level, with only one day missing by more than one, but at the park level we had two predictions that missed by three. Low crowds at Magic Kingdom on Sunday and Animal Kingdom on New Year’s Day were the two surprises of the week, where we over predicted by three index levels. Everything else was accurate within one or two.
We saw extreme crowds again this year during Christmas and New Year’s, but not to the extent that we have seen in years past. When we missed the mark we tended to overpredict, which tells us that this year’s crowds, although extreme, may not have been as bad as history might suggest. That being said, long wait times were observed all over the resort, sometimes reaching three or four hours long!
Let’s look at how the crowd levels stacked up day-to-day.
![]()
![]()
| December 29, 2013 to January 4, 2014 |
|---|
Sunday was the biggest surprise of the week, with wait times lower than normal at Magic Kingdom. It seems strange to say that when Big Thunder Mountain hit an average posted wait time of 78 minutes, but most attractions did not reach their historical extremes. Pirates of the Caribbean stayed below a 20 minute average, and Space Mountain was 63, both about average for a normal time of year. These wait times put Magic Kingdom as a ‘6’ on our scale, much lower than the predicted ‘9’. This is the first time since 2009 that Magic Kingdom was below a ‘9’ on December 29, mostly due to the wet weather on Sunday. Other parks were as crowded as predicted.
The lull was definitely temporary as Magic Kingdom returned to a ’10’ on Monday. Epcot and the Studios also were a ’10,’ while Animal Kingdom was not far behind at a level ‘9’. Visitors to Epcot’s Soarin’ between 10am and 5pm saw an average posted time of 147 minutes. Toy Story Mania at the Studios averaged 149 minutes, and Magic Kingdom’s Space Mountain, 120. Perhaps most remarkable was the average posted time at Peter Pan’s Flight, which reached 121 minutes! Guests who feel the parks are busy in Spring or Summer should recall that at Christmas people wait more than two hours for a two minute ride!
The numerous guests to Walt Disney World distributed themselves fairly evenly among the four parks on Monday, but by New Year’s Eve on Tuesday they flocked mostly to Magic Kingdom and Epcot to countdown the last minutes of 2013. Attendance was pushed to phase 3 capacity at Magic Kingdom, and Epcot wait times reached as high as 240 minutes. By contrast, Animal Kingdom, which closed at 8pm, reached level ‘8’. Kilimanjaro Safaris averaged a posted wait time of 43 minutes, 171 minutes less than Soarin’!
We predicted the resort wide level at an ‘8’ for New Year’s Day, and it came in one level lower, thanks mostly to lower than expected wait times at Animal Kingdom and the Studios. Both surprised us with park levels of ‘5’ and ‘6’ respectively although we had predicted ‘8’s. Kali River Rapids and Kilimanjaro Safaris both had average posted times below ten minutes.
All parks stayed at a level ‘8’ or higher on Thursday, including a ’10’ at both Epcot and the Studios. This was in line with our predictions, with the exception of the Studios where we predicted an ‘8’. Our attraction level predictions at the Studios headliners were all within 10 or 20 minutes, so the wait times did not hit the same extremes as seen earlier in the week. Epcot was the park with the highest wait times, reaching an average of 137 minutes at Soarin’.
Only Epcot hit a level ’10’ on Friday; we predicted ‘9’. Our prediction of ‘9’ at Magic Kingdom was correct, as was our estimate of ‘7’ at Animal Kingdom. The Studios came in at ‘9’, one level higher than the ‘8’ we predicted. As we head into the first weekend of the year, we expect many guests will begin to return home and wait times will start to reduce slightly.
Resort-wide levels did reduce slightly to a level ‘8’ on Saturday, as predicted. Predictions were accurate for Magic Kingdom and Epcot as well, at ‘8’ and ‘9’ respectively. The Studios had the lowest level of the four parks, coming in at ‘7’.
| January 5 to January 11, 2014 |
|---|
Walt Disney World Resort will begin to see the influx of marathoners who flock to the hotels in preparation for the annual marathon weekend. Crowds at the parks this week will depend on how many visitors chose to extend their holiday vacation past the return to school and also may depend on the weather. Sometimes chilly temperatures can reduce the wait times we see in early January.
To see Walt Disney World Crowd predictions for the days of your vacation, check the Crowd Calendar.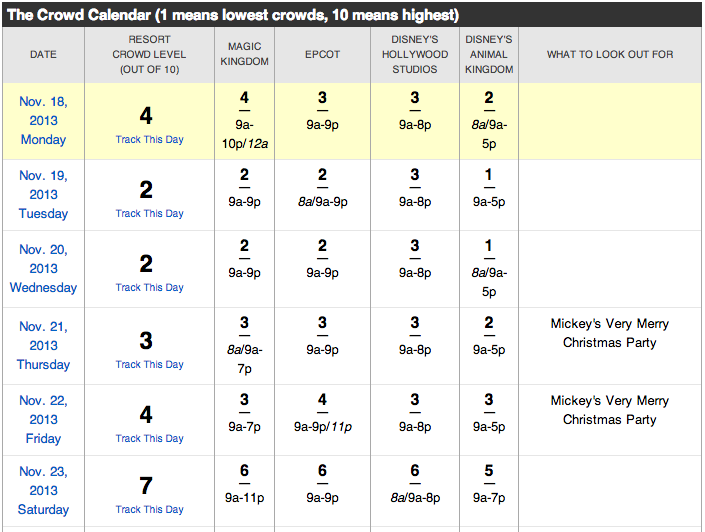
![]()
To get details about our predictions of future crowds or details about crowds in the past check out the Crowd Calendar and select “Jump to Date” on the left margin.
You May Also Like...
-

This weekend will have the longest park hours since Walt Disney World re-opened in July. Extended park hours are a signal…
-

The February 2020 Crowd Calendar update is now live. So far 2020 is showing increased crowds at Walt Disney World. We…
-
The October Crowd Calendar update is now live. We skipped September to give the models a chance to digest the data with Star…
-

We’re here with a series of quick posts, “Disney in a Minute,” bite-sized nuggets of information that can better help you…
Sunday, December 29th, rained all day. By the evening when we visited Hollywood Studios, the park was fairly empty. Osborne lights was the least crowded I’ve ever seen it (outside reunion private event). The last fantasmic had three completely empty sections. It was indeed a very pleasant surprise.