Just How Empty Were the Parks in Early September 2021?
If you’ve been to the parks in the past month, or you read about our recent in-park testing, you know that the parks have been veritable ghost towns. The typical September lull with schools starting up, plus increased COVID cases across the country and especially in Orange County, plus people waiting to visit until the 50th anniversary festivities start up have all added up to a remarkable lack of crowds in late August and early September.
![]()
But early September is always the sweet spot for low crowds, right? (Yes, shh, don’t tell anyone – that’s why my family always visits the week after Labor Day.) So how does this year compare with the Septembers of the past? Was it really remarkably low? Or did the continued operational closures of meet and greets and most shows mean that wait times weren’t so different? Now that the first half of September is a wrap, we can explore that question.
Explain the Math!
We collect actual wait times from Lines App users in the park every day. 2021 has been an especially great year for wait time submissions – thanks to all of you that have timed your waits!! As you can see below, early September this year was no exception.
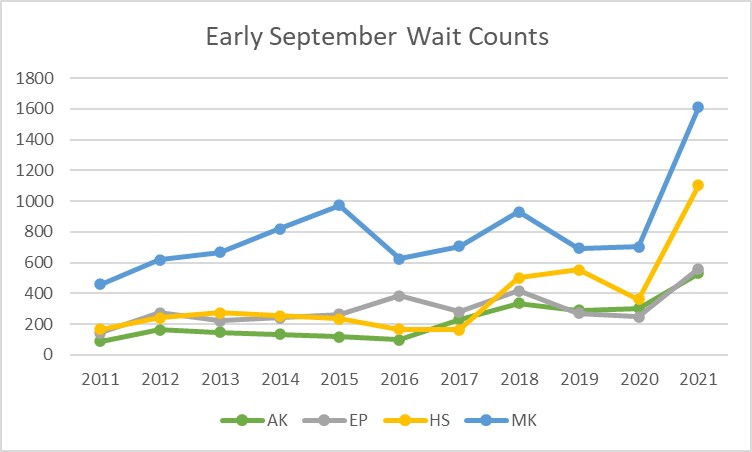
For this post, we’ll be looking at wait times submitted between September 1st and September 15th of each year from 2011 through 2021. And we’ll only include standby waits, so single rider and FastPass wait times are thrown out. That way we’re comparing apples to apples. Magic Kingdom is a good example of increased wait time submissions. From 2015 through 2020, we got somewhere between 600 and 1000 submissions in early September. But in 2021, we had over 1600 submitted standby waits in that same timeframe. As a data nerd, this is like Christmas coming early. All of that data makes my heart very happy.
To compare this year to previous years, we’ll look at average wait times. We can look at Walt Disney World overall, as well as individual parks and even individual attractions. That way we get a picture at each level of wait time trends. We’ll figure out the average submitted time as well as the average posted time when the submitter entered line. That way we can get information not just about wait time trends, but also about how Disney is reflecting changes (or not).
Overall Trend
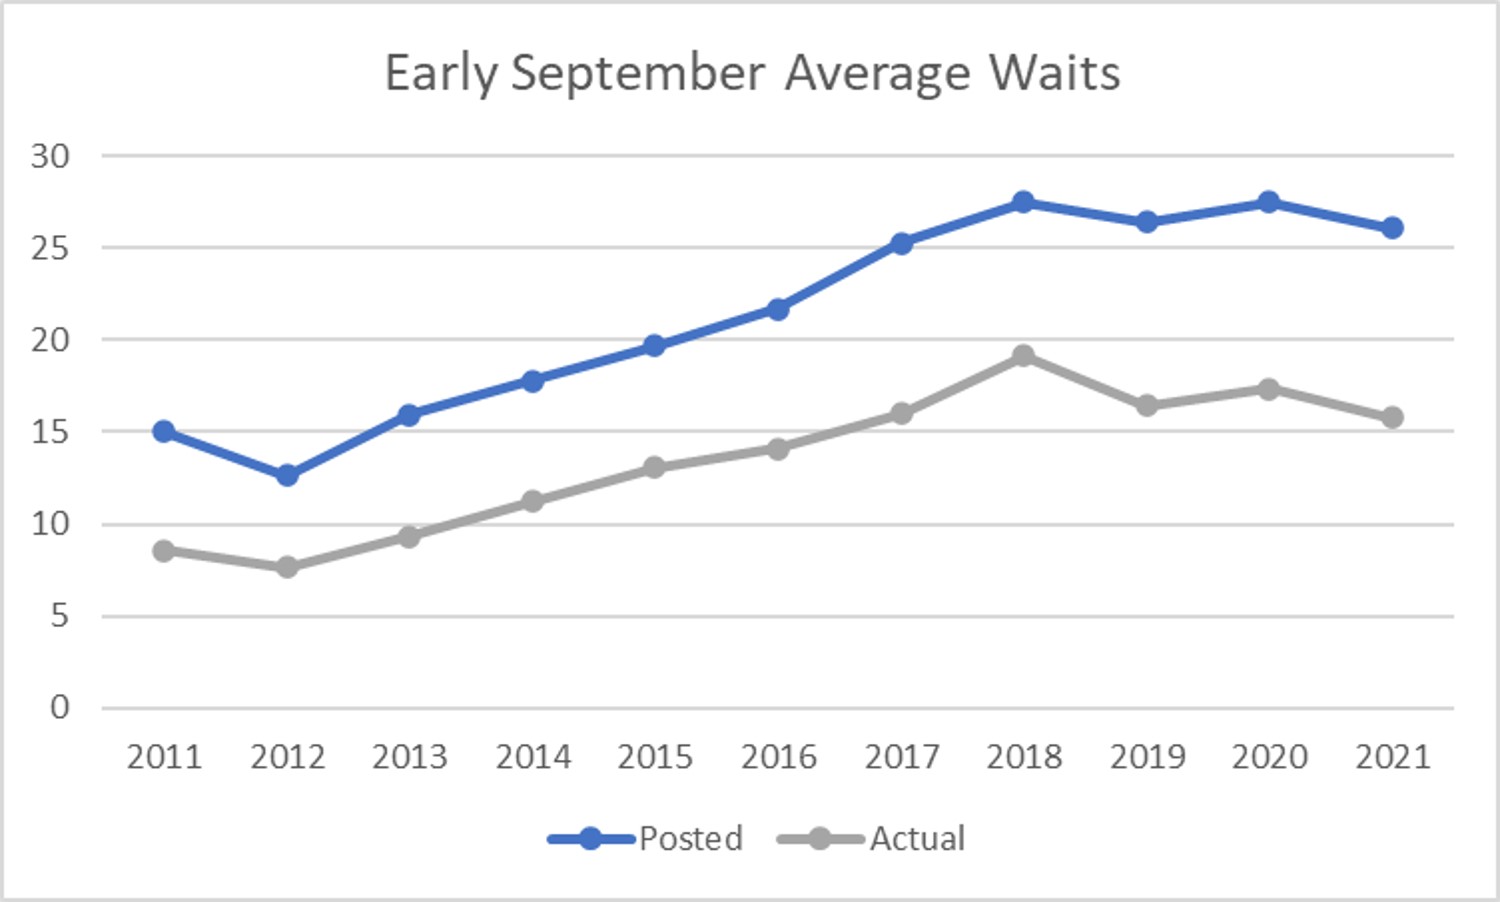
The gray line here is the average of all submitted standby wait times from September 1st through September 15th each year. The good news is that there has been a steady decrease since a peak in 2018. But obviously 2020 was a really weird year, and we’ve discussed how 2021 is anomalous too. What actually stands out to me here is the remarkably steady increase from 2012 through 2018. There’s a big difference in an average wait of under 10 minutes per attraction and an average of almost 20 minutes per attraction.
Also of note, the average posted time increased faster than the average submitted time between 2012 and 2018, so posted times were getting relatively more inflated over those years. And even though submitted times have been decreasing since 2018, posted times haven’t decreased as much. But this overall picture has lots of asterisks by it. What if Disney has opened more new attractions that garner longer waits? What if one park has contributed more longer waits than any of the others? Let’s go one layer deeper.
Park-by-Park Trends
Animal Kingdom

Animal Kingdom is an interesting example. Remember when Expedition Everest was the longest wait there? Then Pandora opened, and average wait times leapt up – by more than double. Almost entirely thanks to the attraction with the longest waits across all of Walt Disney World, Flight of Passage. Interestingly, waits in early September 2021 were slightly higher than in early September 2020.
EPCOT

EPCOT is the park most influenced by festival crowds and locals – and neither of those things tends to dramatically increase wait times, but rather the number of people milling around or eating/drinking their way around the world. Early September wait times have been decreasing in a somewhat haphazard manner since a peak in 2016. The extension of Food and Wine to cover early September hasn’t meant increased crowds this year. 2021 has seen the lowest average waits since 2014.
Hollywood Studios
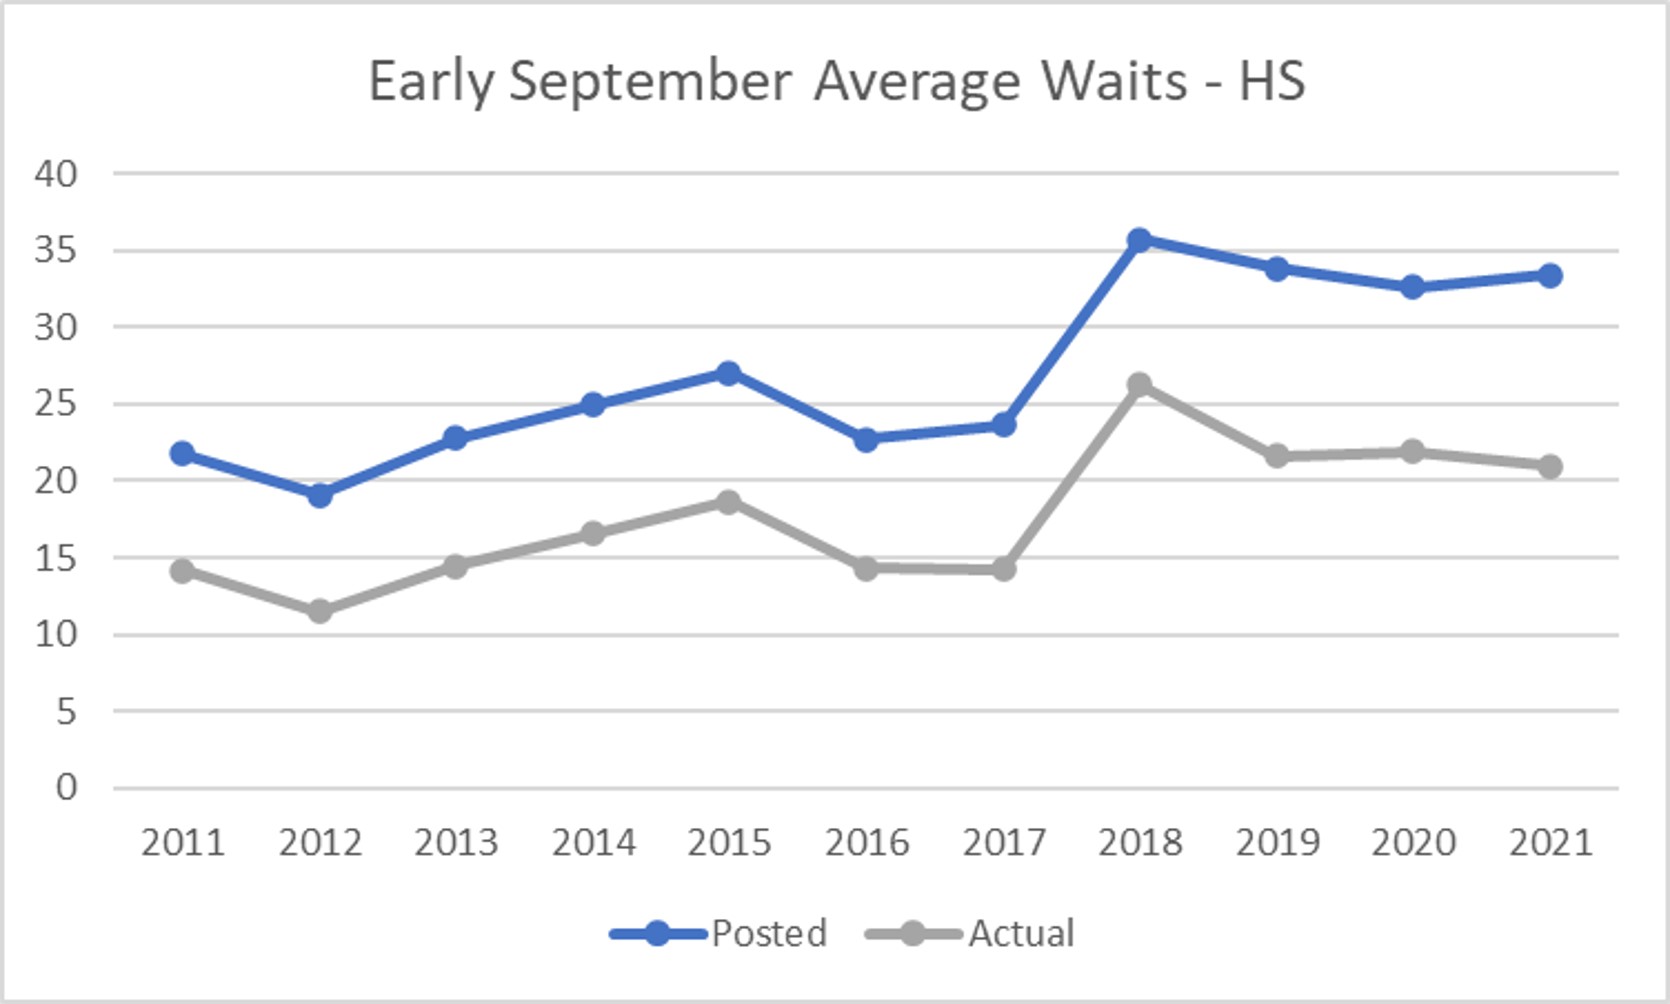
Like the overall average, early September wait times at Hollywood Studios peaked in 2018 before starting to drop. 2020 saw a slight increase from 2019, but 2021 dropped back down. Considering that many of the attractions at Hollywood Studios are considered headliners with high expected waits (Tower of Terror, Rock ‘n’ Roller Coaster, Millennium Falcon, Toy Story Mania, Slinky Dog Dash, etc), an overall average of 20-minute waits in 2021 really isn’t too terrible.
Magic Kingdom

Magic Kingdom has a different shape than the rest of the parks. Its early September 2020 averages were much higher than another early Septembers before them. Huh?! I was actually in the Magic Kingdom in early September 2020 (remember, that post-Labor Day week is totally my jam), and I have some guesses as to why. This was back when, yes, crowd levels were capped pretty low. But operational capacity was also REALLY low. Staffing hadn’t bounced back, lines were very well spaced, and loading was incredibly spaced out. That means less people getting on rides every hours, and that leads to longer waits. Now, I still did 9 hours in the Magic Kingdom with two grandparents and two kids under 5, and we did over 20 attractions (not including rider swaps) plus a table service meal and a counter service meal. So yeah, maybe waits were high – but they were definitely manageable.
The additional good news is that at Magic Kingdom, the operational capacity increases seem to have outpaced the crowd increases. Average standby waits in early September 2021 were back to levels more like in 2015 and 2016.
Individual Ride Trends
We’ll round this out by peeling back one more layer and looking at trends for specific rides. I’m not going to offer much additional analysis here, but we can look at one attraction for each park to see how those change over time too.
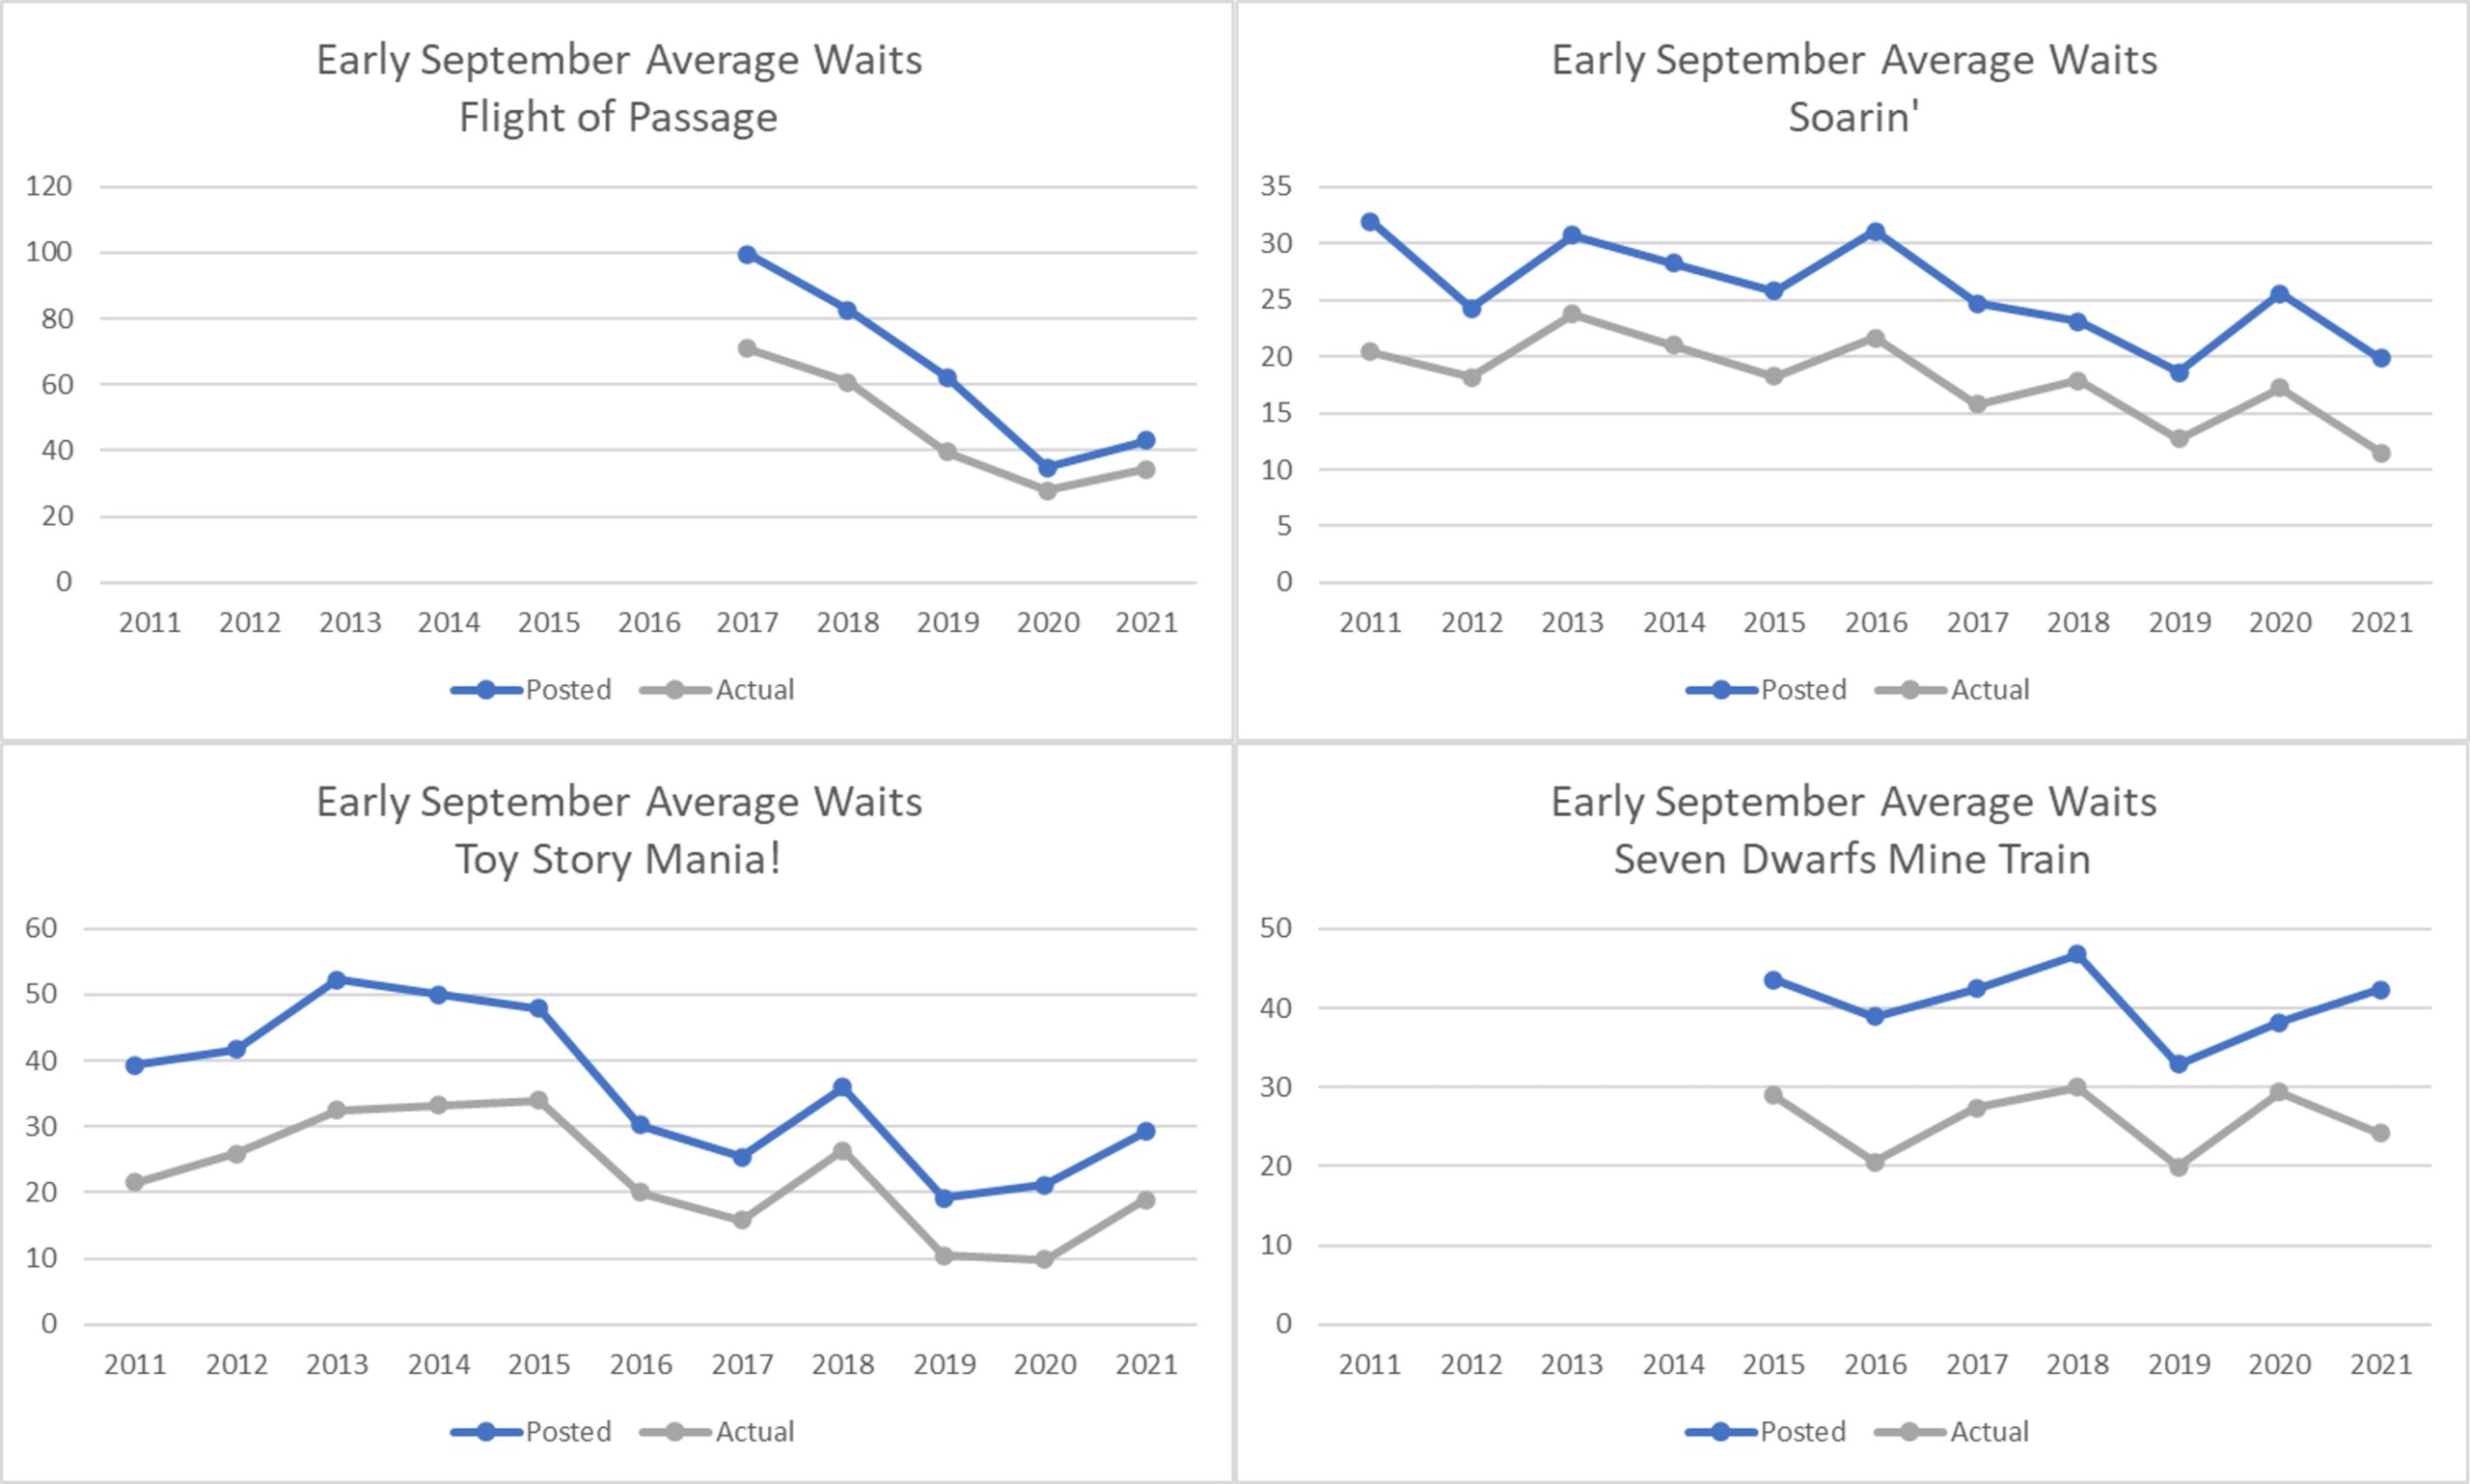
Flight of Passage is the big wait-driver here, averaging 70-minute standby waits in early September 2017. Yikes. We were there that September – Hurricane Irma scared the rest of the humans out of the park the day we visited, so we didn’t wait 70 minutes. Lucky us? Flight of Passage and Toy Story Mania both saw increased average waits in 2021 compared to 2020, while Soarin’ and Seven Dwarfs Mine Train saw decreases.
What Does This Mean For You?
- Big takeaway here is that Disney is still padding posted wait times significantly. With the Genie/Genie+ rollout right around the corner, don’t assume what they tell you about the wait is true!
- Crowds just keep increasing (overall) at Disney. It seems that the pandemic was just a “blip” in that trend. So while early September 2021 wasn’t all walk-ons, it was statistically the best early September for low waits since at least 2017 (which had crowds depressed by the hurricane keeping people away for a few days).
- Overall numbers can also be misleading, so it’s always good to understand trends at specific parks, or even specific attractions if you can. When Rise of the Resistance converts to a regular queue next week, overall average wait across the park is going to go up. But it’s not because there are more people – it’s because there’s a new long line that’s going to likely have a lot of submitted data.
Do you have any great stories about visiting in early September? Are you a post-Labor Day fan like me? Let us know in the comments!

You May Also Like...
-

Fireworks are an iconic part of the Disney theme park experience, and their absence at Walt Disney World has been keenly…
-

Our team is in the parks every day to keep up to date on everything exciting and amazing in the world…
-

Sometimes it's nice to get the help you need in person rather than on the phone or through email. If you…
-

Trying to predict Crowd Levels has been been a challenge this year. In July it looked like we had turned the…
I understand that there are usually a lot of Brits at WDW in September but of course, unless we spend 14 days in a different country first, we still can’t visit USA. Got 2 trips to WDW booked for 2022 to make up for the trips we have had to cancel last year and this year. Really hoping we will be able to come over by then. Really missing my Disney fix.