Walt Disney World Crowd Report November 10 to 16, 2013
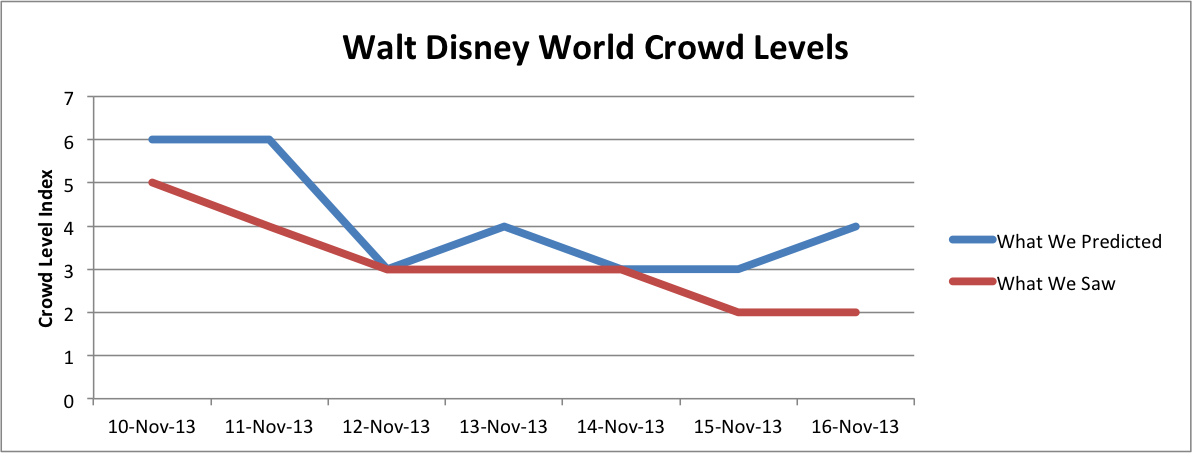
Generally, crowds last week came in lower than expected with no park reaching higher than a level ‘6’ on our scale. We were within 2 index points 86% of the time last week and within 1 index point 61% of the time.

Mickey’s Very Merry Christmas Party season arrived at the Magic Kingdom this week, which means savvy planners who don’t mind the shortened park hours can experience low wait times during the day.
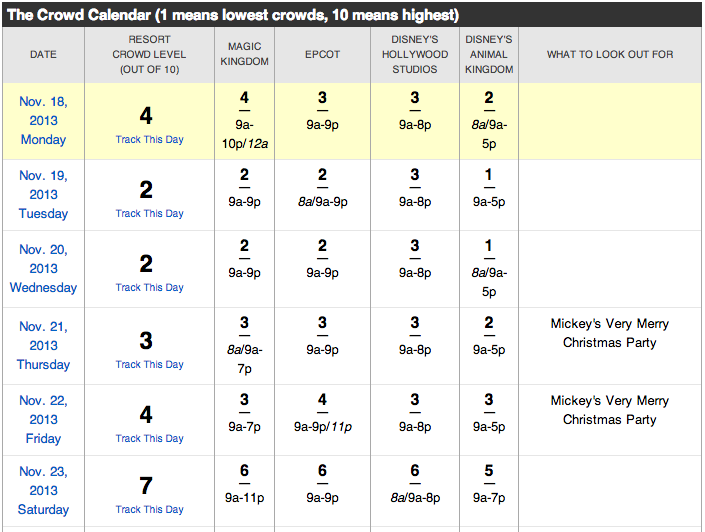
We expect this coming week to be the last few days of the pre-Thanksgiving lull. Large crowds will begin on Saturday or Sunday. To see Walt Disney World Crowd Predictions for Thanksgiving week or any other week, check the Crowd Calendar.
The Walt Disney World Crowd Report – November 10 to 16, 2013
The final day of Wine & Dine Half Marathon weekend and the final weekend of Epcot’s Food & Wine Festival brought in typical weekend crowds for November. Resort wide wait times came in lower than expected at ‘5’ mostly caused by a surprising level ‘4’ at The Studios. We predicted a ‘7’.
Veteran’s Day crowds were lower than normal, we predicted a resort-wide ‘6’ which ended up two points too high. Again, Studios crowds were the biggest culprit with wait times only reaching a level ‘4’. Our estimates were too high at every park but only by 1 point at the Magic Kingdom.
Resort-wide our predictions hit ‘3’ as expected however we underpredicted Magic Kingdom by 2 points (‘5’ vs a ‘3’) and overpredicted Epcot by 2 (‘1’ vs a ‘3’). At Magic Kingdom, it was Jungle Cruise and Buzz Lightyear that came in busier than expected. The average posted times at these two attractions were about double what we predicted.
Wait times were low at all parks as predicted with no park reaching a level higher than ‘3’. Only the Animal Kingdom showed wait times higher than predicted but only by one index point, at a level ‘3’ up from the predicted ‘2’.
Mickey’s Very Merry Christmas Party returned to Magic Kingdom for the first time of the season on Thursday. As predicted, daytime crowds hit a level ‘3’ both at the Magic Kingdom and resort-wide. Animal Kingdom hit a level ‘5’ while The Studios remained low at a level ‘1’ – we predicted a level ‘3’ at both. Kilimanjaro Safaris was a big contributor to Animal Kingdom’s level ‘5’. It reached an average posted wait of 56 minutes which would represent a ‘9’ out of 10 on our scale.
Lowest wait times of the week resort-wide with no park exceeding a level ‘3’. We correctly predicted each park within ‘1’ index point. Another day of low waits at Magic Kingdom during the day thanks to Mickey’s Very Merry Christmas Party scheduled for Friday evening.
A very surprising resort-wide ‘2’ on Saturday, we predicted a ‘4’. The Studios reached a level ‘3’ as predicted but all other parks came in lower than expected. Significantly so at the Magic Kingdom where our prediction of ‘6’ proved three points too high. Other than Winnie the Pooh and Jungle Cruise where our predictions were within 1 index point, average wait times at the attractions ended up about half of what we predicted. Space Mountain for example, had an average posted wait time of 26 minutes. This is quite low, especially for a Saturday.
To get details about our predictions of future crowds or details about crowds in the past check out the Crowd Calendar and select “Jump to Date” on the left margin.


Fred:
Keep these reports coming!! I come to the world once per month on business and I don’t usually go on the rides since my kids aren’t with me, but the nerd in me loves to see how well you guys are doing with the predictions!! In the rare instances you are a bit off, I make sure I enter the times in the app so you get the data. I am also dreading to see how the new fp+ stuff affects all the times.
Sorry, My message did not get completed before it went thorough. But the radio hosts stated that the Sunday of the holiday weekend was the most crowded they had ever seen Epcot. One even stated that he had been there for New Year’s before and did not find it as crowded as that particular Sunday. I know you all try to work hard to give the most accurate crowd predictions, but there seems to be a discrepancy.
Hi Gretchen-
Here’s a look at Soarin’s wait times for Sunday, November 10: http://touringplans.com/epcot/attractions/soarin/wait-times/date/2013-11-10.
Waits averaged about 77 minutes between 10 am and 5 pm. We predicted those would be about 70, so off a little.
Here’s Soarin’s wait times last New Year’s Eve: http://touringplans.com/epcot/attractions/soarin/wait-times/date/2012-12-31
Waits averaged a little more than 190 minutes between 10 am and 5 pm. We would have predicted a little less than 210, so off by 15 or 20.
So last Veterans Day’s crowds were about 40% of last New Year’s Eve’s crowds at Soarin’.
I haven’t looked at Test Track or Mission: Space, but it’s easy enough to do that if needed.
Okay, here’s Test Track:
On New Year’s Eve: http://touringplans.com/epcot/attractions/test-track/wait-times/date/2012-12-31
Standby waits averaged about 200 minutes and we would have predicted 210.
For this past Veteran’s Day: http://touringplans.com/epcot/attractions/test-track/wait-times/date/2013-11-10
Standby waits averaged 82 minutes. We predicted 110, which was high. Part of the issue there is that Test Track was closed on Veterans Day 2012, so we didn’t have a lot of seasonal information to go on.
Like Soarin’, Test Track’s waits on Veterans Day averaged about 40% of the waits on New Year’s Eve.
I am curious as well where you got your numbers for Veteran’s Day weekend. I heard on a radio broadcast that the hosts (all annual passholders who attend frequently) said
We were there last week and thought crowds were heaverier then predicted. Sunday and Monday were very crowded at HS and Epcot respectivly. I think Fastpass+ may cause you to relook at your modeling too because in a couple cases the wait time for the Fastpass line was longer then the Standby.
Thanks Ty! Have you looked at last week’s graphs of the predicted and actual wait times? Here’s last Monday: http://touringplans.com/walt-disney-world/crowd-calendar/date/2013-11-11.
You can navigate forward and back one day using the links at the top.
If you want to look at our predictions and the actual waits at any attraction in any park, look for the link titled “Click here to see individual attraction details” where we describe each park.
I’ve noticed recent changes to the estimates on my personalized touring plans for May 2014. Is this because of a change in predicted crowds, or revised wait times reflective of what we’re seeing now with the “test” (ahem, partial rollout) of FP+? If the former, when should we expect to see some revised wait time predictions that take the effect of FP+ into account? (I realize it’s difficult for you to make predictions when the “test” rules keep changing, but it would be helpful to get even a rough idea of what wait times look like right now, based on the addition of FP+ and not on pre-FP+ average wait times… similarly, it would be helpful if we had an option when optimizing touring plans to utilize standby times only, without the automatic insertion of legacy FP-related steps, since legacy FP is not likely to be available when I visit in 6 months.) Just a thought. Love you either way. 🙂
Fastpass Plus is a moving target right now. No one, including Disney, really knows how the Fastpass systems will behave in May 2014. We can make some guesses but it is probably more prudent to watch and learn for the next little while then make adjustments if needed.
The recent changes you’ve seen are likely due to the launch of our new calendar.
This is interesting…Was there an identifiable reason for this, or is it because of fine tuning the new crowd calendar?
Is this going to be a regular feature? Just curious why this week was examined specifically.
There have been more articles of this type since the rollout of crowd calendar 4. Right now they are probably looking a little more carefully at how the new models are doing, and so it is easy to report on them.
Crowd Calendar 4 allows us to easily look at the results each day, so we are using the information to communicate how we did. We feel that we provide a very accurate calendar but we also feel that transparency is an important part of any statistical tool.
Yes, the idea is to make this a regular feature. We’ll also add a “looking ahead one week” section. Thanks for reading!
The park hours at WDW for December appear to have been revised over the weekend. Can we expect an update to the December Crowd Level Estimates?
The good thing about our new calendar design is that it is less reliant on the published park hours. So no, we don’t expect that these recent park hour adjustments will cause any required updates to the new calendar. We may publish updates to the calendar for many other reasons however, but not very often.
Here’s hoping Saturday is slower than expected 🙂 Im going over there for the day.