
Disney Data Dump June 24 2026
A few weeks ago I called this the slowest start to summer since 2014. Then the crowds got even lower. And now they’ve gone even lower again. At this point, we’re running out of ways to say that Walt Disney World is unexpectedly uncrowded. Even when we expected it to be uncrowded in the first place.
The really interesting thing isn’t that this past week was slow. It’s that we’re now far enough into summer break season that these crowd levels probably aren’t a fluke. Schools are out. Summer promotions are in full swing. Cool Kid Summer has arrived. And yet the parks continue to post numbers that would have looked more at home in late August than late June. Let’s take a look at the data!
Observed Crowd Levels June 16 – 22
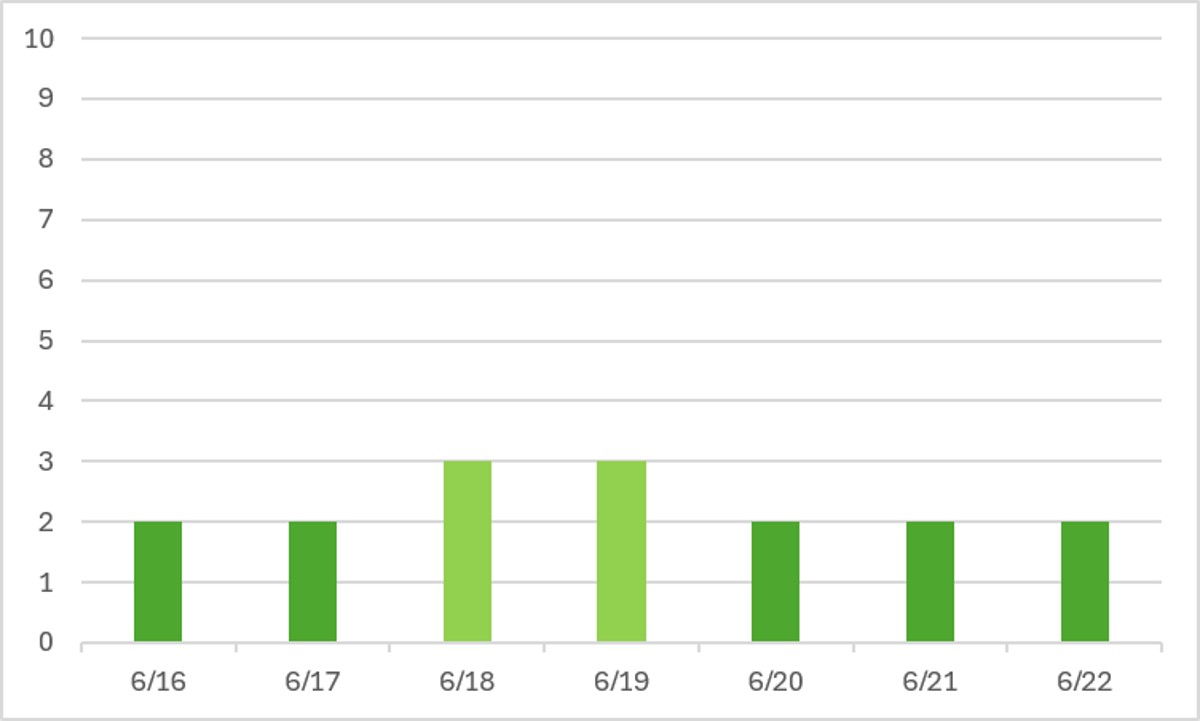
Two weeks ago we hit a crowd level 5 on one day and I boldly proclaimed that we shouldn’t see anything above a 5 for the foreseeable future. Then last week, we only hit a crowd level 4 on one day and I was like, dang it’s even slower than I though. And then this week we barely squeaked up to a crowd level 3. This is crazy stuff, y’all.

Once again, Animal Kingdom had the highest crowd level of any park every day of the past week. Let’s all cross our fingers that it gets some sort of capacity help before fall rolls around and brings crowds back to the park. Meanwhile, Hollywood Studios was empty on the 18th thanks to an early closing, which led to longer lines on the surrounding days. Still, no park got above a crowd level 5 on any day of the past week. A pretty great time to be in the parks … if you can handle the weather.
Performance of Crowd Level Predictions
Each week, I give you a very transparent look into how the TouringPlans crowd level predictions performed. Each day at each park is one data point, so each week we have 28 different crowd level predictions to evaluate. Any time a prediction is within one or two crowd levels, things won’t really “feel” much different than what was predicted. Being off by 3 or more crowd levels is where you might feel that difference in wait times throughout the day.
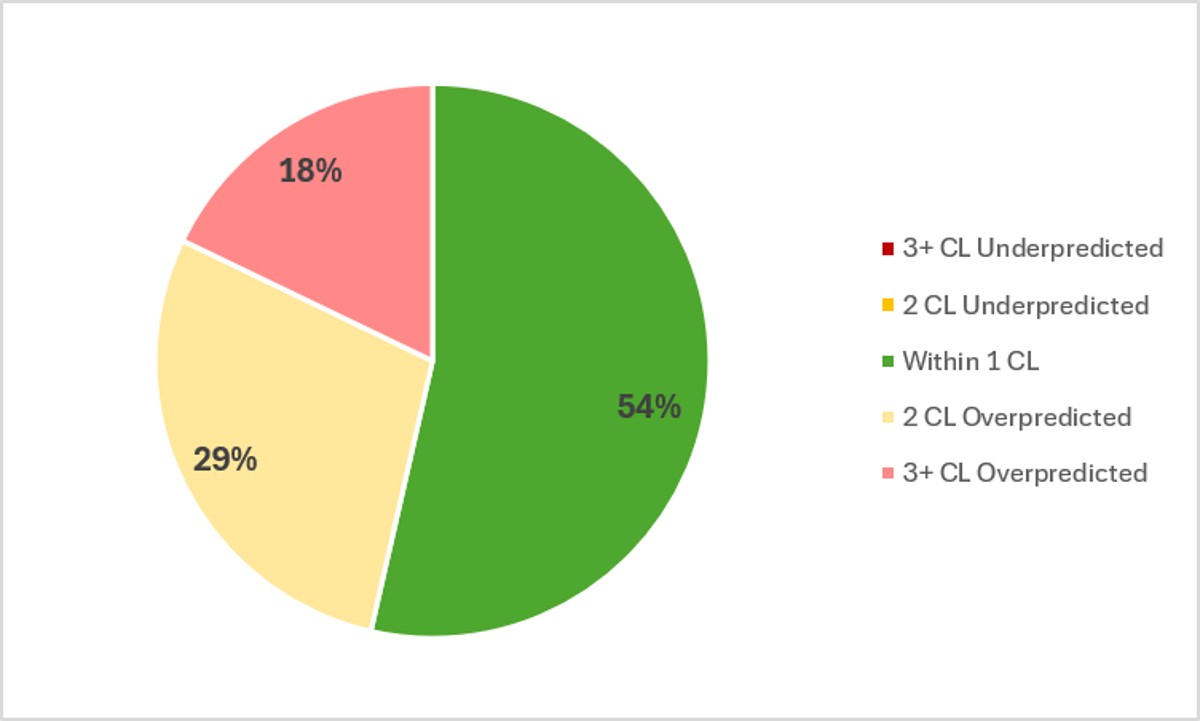
In the past week, Touring Plans predictions were either spot-on or within 1 crowd level 54% of the time, which is a bit lower than the result from last week. And 982% of the time Touring Plans predictions were within 2 crowd levels, so that’s a B- on predictions for the last week. And based on the colors of that pie chart, all misses were overpredictions, meaning parks were less crowded than predicted. In fact, there were no individual park-days in the past week where the crowd level was anything higher than predicted. Instead, if you average all results, each park day was 1.5 crowd levels lower than predicted for the week The biggest miss of the week was an overprediction by 3 crowd levels, which happened at 5 different times – all at EPCOT. Diet EPCOT is not drawing the crowds.
Attraction Downtime June 16 – 22
If we average all of the capacity lost due to unexpected downtime over the past week, it comes out to 5.4% of attractions unexpectedly being down. That’s a bit higher than we’ve seen so far this summer. And over the past week, Animal Kingdom was once again the park with the worst overall downtime, averaging 8.1% of its capacity lost to downtime. That’s a bigger number than we’ve seen in a long time.
The worst day for attraction downtime in the past week was on June 21st. On that day, 8% of all capacity at WDW was lost due to unexpected downtime. And the worst park-day of the past week was a predictable combination of our worst park and worst overall day – Animal Kingdom on June 21st, when 18% of that park’s capacity was lost due to unexpected downtime. Animal Kingdom was open for 10 hours on the 21st, so 18% downtime is the equivalent of the entire park shutting down for 108 minutes. Almost 2 hours out of the 10 hours the park was open. That is a very noticeable impact to your park day.
Attraction Downtime Worst Offender
In the past week, Test Track was the WDW attraction with the worst overall downtime. That’s the third week in a row. It was unexpectedly down for 21% of the past week. That’s pretty close to the downtime we saw here last week. The worst day of the past week at Test Track was on June 20th, when the attraction was down for 38% of the day. But it was also down for 30% of the day on the 21st.
One call-out is that Rock’n’Roller Coaster came in second place in the downtime race this week, at 19%. Over on Instagram I’ve been proclaiming how surprising it is that Rock’n’Roller Coaster went from TONS of downtime even after its extensive refurbishments to basically zero downtime since its retheming … until now. Now it’s breaking down regularly, usually late in the evening.
Rope Drop Downtime
Here are problematic offenders from the past week, with the percentage of downtime during the first hour of the day in parentheses:
- Magic Kingdom: Haunted Mansion (25%), Tiana’s Bayou Adventure (25%), Big Thunder Mountain (24%), The Many Adventures of Winnie the Pooh (18%), Buzz Lightyear’s Space Ranger Spin (17%), Pirates of the Caribbean (13%), Magic Carpets (12%), Mickey’s PhilharMagic (12%), Under the Sea (12%), Jungle Cruise (11%), Barnstormer (11%)
- EPCOT: Frozen Ever After (29%), Test Track (22%), Journey Into Imagination (19%), Remy’s Ratatouille Adventure (11%), The Seas with Nemo (11%)
- Hollywood Studios: Slinky Dog Dash (38%), Rock’n’Roller Coaster (14%), Millennium Falcon: Smugglers Run (12%), Rise of the Resistance (12%)
- Animal Kingdom: Kali River Rapids (46%), Expedition Everest (22%), Na’vi River Journey (19%)
Writing that Magic Kingdom list felt distressingly like I was just listing every available attraction in the park. Yikes. Thankfully, Seven Dwarfs Mine Train, Space Mountain, and Tron all were reliable this week. Pretty much everything else wasn’t! Especially if you’re doing regular entry rope drop, you had a rough week. That left side of the park was not playing nice.
And what was up at Animal Kingdom?? Usually it has no rope drop downtime issues and this week we’ve got three attractions that struggled a bunch in the morning.
Wait Times June 16 – 22
Attractions with the Highest Average Posted Wait at Each Park
- EPCOT: Test Track, average posted wait of 68 minutes (was 73 minutes last week)
- Hollywood Studios: Slinky Dog Dash, average posted wait of 61 minutes (was 62 minutes at Rock’n’Roller Coaster last week)
- Magic Kingdom: TRON, average posted wait time of 57 minutes (was 60 minutes last week)
- Animal Kingdom: Flight of Passage, average posted wait time of 46 minutes (was 56 minutes last week)
A couple of interesting results here! Test Track has now outpaced Cosmic Rewind for highest wait in EPCOT two weeks in a row. A lot of this is thanks to downtime at Test Track. Some of it is thanks to a bunch of people still buying LLSP for Cosmic Rewind and then not enough people waiting in standby to boost wait times very high. And then we’ve got Rock’n’Roller Coaster finally dipping back below Slinky Dog Dash after a month at the top of the wait time charts in Hollywood Studios. Some of that is thanks to Slinky downtime, but maybe demand for the rethemed coaster is getting back closer to normal.
On the whole, there were only three attractions in all of Walt Disney World where the average posted wait time was an hour or more – Test Track, Cosmic Rewind, and Slinky Dog Dash. Everything else was under an hour! That 45 minute average for Flight of Passage is especially crazy.
Parks with the Highest and Lowest Average Wait
- Highest: Hollywood Studios, average park-wide posted wait of 31 minutes (was 33 minutes last week)
- Lowest: Magic Kingdom, average park-wide posted wait of 19 minutes (was 21 minutes last week)
Overall, each park had even lower average posted waits than last week’s already-low numbers. That’s the lowest average wait at Magic Kingdom that we’ve had since last summer. Usually waits aren’t that low unless party days are driving down crowds! Under 20 minutes is very crazy. And every park other than Hollywood Studios was under half an hour. Hooray!
Most Inflated Posted Wait Times
We all know that Disney inflates their posted wait times on purpose. They have many reasons for doing this. Some are totally understandable, and some are potentially more problematic. We can figure out how much posted wait times are being inflated by comparing submitted actual wait times from the Lines App and the posted wait time when the person timing their wait entered the line.
Over the past week, actual wait times in the Lines App averaged 74% of what was posted. That’s close to our historical average in the era of Lightning Lanes. Overall, if the posted wait time at a popular attraction was 60 minutes, you could’ve expected to wait less than 45 minutes instead.
But the worst inflation offender for the past week was Mission: Space. At this one attraction, submitted actual wait times were only 33% of posted wait times in the past week. That means that if the Mission: Space had a 20 minute posted wait, you probably would have actually only waited under 7 minutes instead. A third of what was posted! Remember to always check the Lines app for predicted actual waits instead of making decisions based on what is posted.

This Week’s Wait Time Rock Star
Between June 16th and 22nd, we had just under 1000 timed actual waits submitted through the Lines app. The one person who recorded the most actual waits during that time was jjgilchrist, with 50 overall timed waits – 16 Lightning Lane waits, 28 standby waits, and 6 single rider waits. Thanks for all of that timing, jjgilchrist! It unfortunately does not compete with the the 97 timed waits in a single week from our current timing champion, preef.
Looking Ahead: June 23 – 29
I write this article on Tuesday evenings so that you all have the very freshest of data on Wednesdays. That means the 23rd will already be in the past by the time you’ve read this, so we’ve time travelled!
Same old story as last week 🙂 No reason to suspect that crowds are magically going to descend upon Orlando in the coming week when our already-slow summer has only been slowing down further each week. Unless weather goes crazy, we should stay in this crowd level 2-3 sweet spot for a while. And there are no crazy park hours this week either. Easy planning!
Other than the 23rd (which is in the past when you’re reading this anyway), our pattern of brief storms every afternoon continues. Expect highs in the 90s (with feels-like peaking up around 110) and to feel a lot of relief when that rain cools things off. For a little while anyway.
Were you in the parks this past week? Or are you headed to Orlando soon? Let me know in the comments below!
You May Also Like...
-

Last week there was no Data Dump because my family was very remote in a national park with no cell service…
-

We’re creeping toward July, and with it the promise of holiday travel, late summer debuts, and maybe - just maybe -…
Heading to the parks June 28- July 5th. Keeping all my fingers and toes crossed this trend continues!! I’ve been scouring wait times and Flight of Passage has been insane! Wait times after the initial morning rush has been around 35 minutes!
How do you measure rope drop downtime for KRR? It’s typically not scheduled to open at rope drop, right? I just checked the official page for the ride, and the planned operating hours vary wildly for the next several days… Today it was scheduled to open at 10; tomorrow and Friday at 12:30, Saturday at 10 again, but then 9 for the rest of the days I looked at.