Disney Data Dump June 10 2026
Last week there was no Data Dump because my family was very remote in a national park with no cell service and very questionable wifi. So this week we’re making up for it with two full weeks of data! And honestly, it’s probably a good thing we combined them, because the big picture of what has happened since Memorial Day is good to review all at once.
Cool Kid Summer kicked off. Bluey and Bingo arrived. Rock’n’Roller Coaster came back. Schools across the country started letting out for summer break. Memorial Day came and went. And yet the crowd levels just … sort of sat there.
That’s not to say there aren’t some interesting trends hiding in the data. A few parks are behaving differently than they were earlier this spring. Some of the new offerings are having impacts that aren’t quite what I expected. And one attraction has suddenly become important enough that it might change how you think about touring an entire park.
But before we get into all of that, let’s take a look at two weeks that should have been the start of summer crowds.
Observed Crowd Levels May 26 – June 8
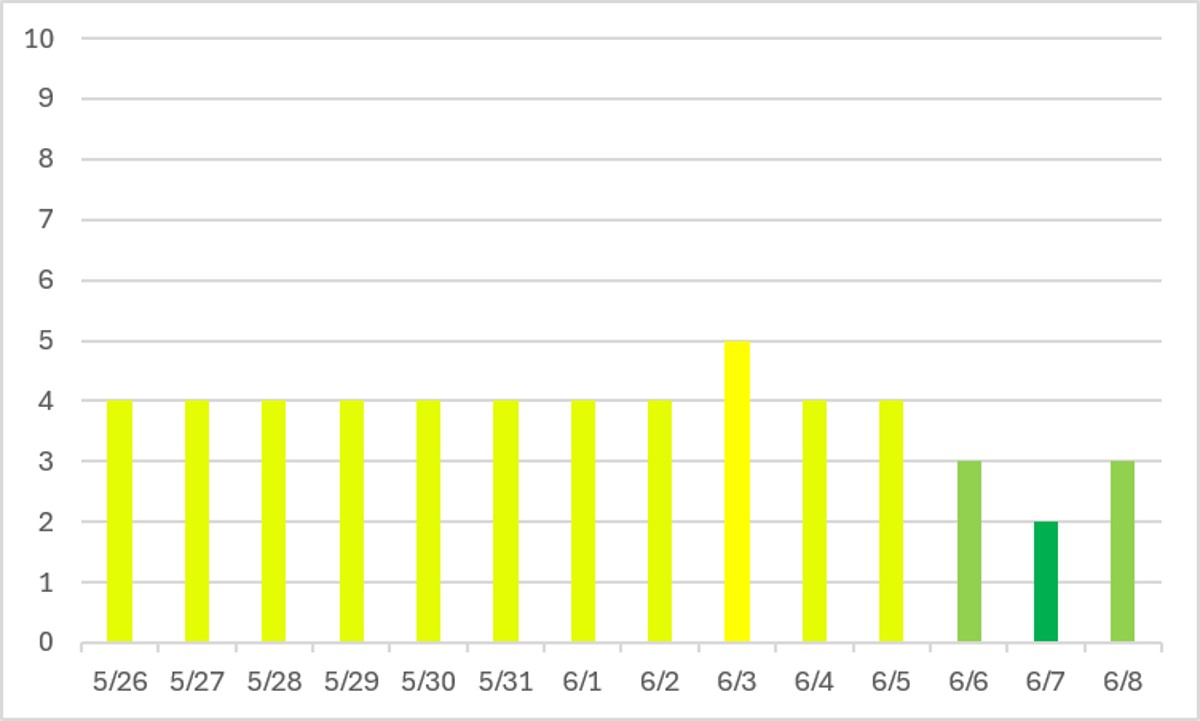
What a roaring start to summer! Interestingly, that steady string of crowd level 4 days is mostly made of people trying to “beat” the summer rush and summer heat. And they still got a pretty good taste of summer heat, and may have actually been the summer rush. Things are already cooling off, crowd-wise, as we make our way through June.

This is always a crowded and crazy graph when we cover two weeks. My fault for not having wifi or cell service last Tuesday! I spent a few weeks speculating about what would happen when Cool Kid Summer kicked off. We’d get Soarin’ Across America at EPCOT, Rock’n’Roller Coaster and The Walt Disney Studios at Hollywood Studios, and Bluey and Bingo at Animal Kingdom. Would it shake things up??? Well … maybe not so much.
Animal Kingdom has been leading the pack on crowd levels for a couple of months now, and that’s mostly still the case. But we’re seeing Hollywood Studios and Magic Kingdom up a little higher instead of being in the 2-ish region. I think this points to more out-of-town visitors. Those two parks are the biggest draws, while EPCOT and Animal Kingdom tend to pick up more locals. So maybe our mix of visitors is shifting as we head into summer, but crowd levels certainly aren’t picking up steam.
In fact, if you exclude 2020 (when the parks were still closed) and 2021 (pandemic aftershocks), these were the slowest two weeks following Memorial Day since well before 2018.
Performance of Crowd Level Predictions
Each week, I give you a very transparent look into how the TouringPlans crowd level predictions performed. Each day at each park is one data point, so each week we have 28 different crowd level predictions to evaluate. And that means this week we have 56 data points! Any time a prediction is within one or two crowd levels, things won’t really “feel” much different than what was predicted. Being off by 3 or more crowd levels is where you might feel that difference in wait times throughout the day.
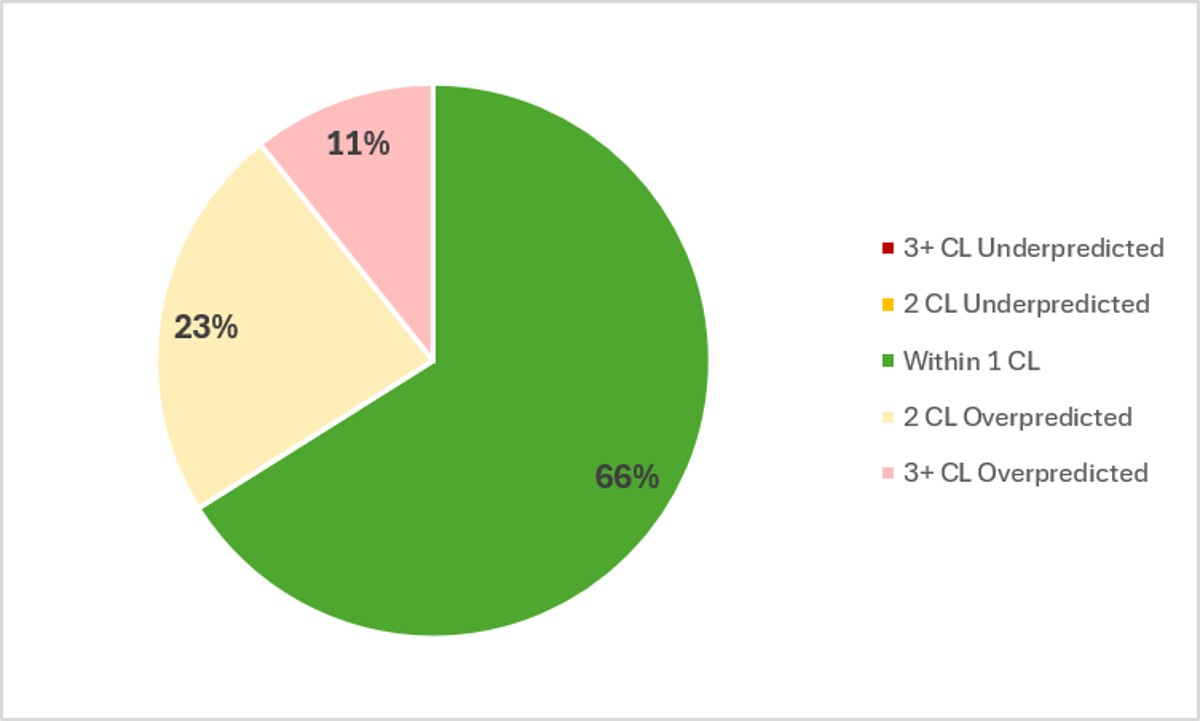
In the past two weeks, Touring Plans predictions were either spot-on or within 1 crowd level 66% of the time, which is still trending lower over the past few weeks. And 89% of the time Touring Plans predictions were within 2 crowd levels, so that’s a B+ on predictions for the last two weeks. And based on the colors of that pie chart, all misses were overpredictions, meaning parks were significantly less crowded than predicted. The biggest miss of the week was an overpredictions by 4 crowd levels, which happened at Animal Kingdom on June 7th. AK was predicted to be a crowd level 6 that day, and only managed a 2.
Attraction Downtime May 26 – June 8
If we average all of the capacity lost due to unexpected downtime over the past two weeks, it comes out to 5.1% of attractions unexpectedly being down. That’s a little higher than what we’ve seen for the past month or so. A lot of that is thanks to storms rolling through and shutting things down (or even earthquakes …). And over the past two weeks, Magic Kingdom was the park with the worst overall downtime, averaging 6.1% of its capacity lost to downtime. That’s a bit higher than our “winning” numbers for the past month too.
The worst day for attraction downtime in the past two weeks was on May 31st. On that day, 9% of all capacity at WDW was lost due to unexpected downtime. But the worst park-day of the past week was actually at Animal Kingdom on May 29th, when 19% of that park’s capacity was lost due to unexpected downtime. Animal Kingdom was open for 12 hours on the 29th, so 19% downtime is the equivalent of the entire park shutting down for over 136 minutes. More than 2 hours out of the 12 hours the park was open. Yikes.
Attraction Downtime Worst Offender
In the past two weeks, Test Track was the WDW attraction with the worst overall downtime. It was unexpectedly down for 14% of the past week. (It was followed VERY closely by Space Mountain, at 13.5). The worst day of the past two weeks at Test Track was on May 29th, when the attraction was down for 41% of the day. But there were also 4 other days (out of the last 14) where it had over 20% downtime. Test Track tends to struggle coming back online after afternoon storms, so it gets significantly impacted by this rainier weather season.
Rope Drop Downtime
Here are problematic offenders from the past two weeks, with the percentage of downtime during the first hour of the day in parentheses:
- Magic Kingdom: Big Thunder Mountain (32%), Space Mountain (28%), The Many Adventures of Winnie the Pooh (19%), Haunted Mansion (19%), Tiana’s Bayou Adventure (13%), TTA PeopleMover (10%), Pirates of the Caribbean (10%)
- EPCOT: Frozen Ever After (18%), Soarin’ Across America (15%), Test Track (13%), The Seas with Nemo (12%)
- Hollywood Studios: Rise of the Resistance (16%), Slinky Dog Dash (15%), Mickey & Minnie’s Runaway Railway (14%)
- Animal Kingdom: Kali River Rapids (15%)
Welllllll Disney is keeping us on our toes. Especially at Magic Kingdom. Big Thunder being down in the morning is now a regular thing, and a terrible thing for strategic regular rope droppers. Space Mountain is also having struggles, which isn’t surprising. The golden lining for that is that if Space is down for early entry, cast members frequently open Tron early. And then you add in a bunch of other downtime at Magic Kingdom, and rope drop was very tricky to plan for.
EPCOT wasn’t so bad, although Frozen is a bummer, and Soarin’ doesn’t really make sense. Still, the two biggest draws (Cosmic Rewind and Remy) had reliable weeks.
Hollywood Studios and Animal Kingdom did pretty well over the past two weeks. I’m shocked that Rock’n’Roller Coaster isn’t on this list (or the top overall downtime list). It was frequently near the top of both of those before it rethemed. Retheming shouldn’t have fixed reliability issues …. but maybe it did?
Wait Times May 26 – June 8
Attractions with the Highest Average Posted Wait at Each Park May 26 – June 1
- EPCOT: Cosmic Rewind, average posted wait of 92 minutes (was 71 minutes the week before)
- Magic Kingdom: TRON, average posted wait time of 73 minutes (was 55 minutes the week before)
- Hollywood Studios: Rock’n’Roller Coaster, average posted wait of 69 minutes (was 54 minutes at Slinky Dog Dash the week before)
- Animal Kingdom: Flight of Passage, average posted wait time of 68 minutes (was 57 minutes the week before)
These results show that the post-Memorial Day but pre-June (mostly) waits were much higher than the week leading up to Memorial Day and the holiday weekend. Increases of 12-21 minute at headliners are nothing to blink at. These aren’t the worst waits you’ll see for these rides, but it’s still something that impacts your day.
Attractions with the Highest Average Posted Wait at Each Park June 2 – 8
- Hollywood Studios: Rock’n’Roller Coaster, average posted wait of 78 minutes (was 69 minutes the week before)
- EPCOT: Cosmic Rewind, average posted wait of 76 minutes (was 92 minutes the week before)
- Magic Kingdom: TRON, average posted wait time of 70 minutes (was 73 minutes the week before)
- Animal Kingdom: Flight of Passage, average posted wait time of 63 minutes (was 68 minutes the week before)
… and then things calmed right back down. A little bit. Everywhere except Rock’n’Roller Coaster. This is a big deal folks. The highest wait at Hollywood Studios isn’t Rise of the Resistance. It isn’t Slinky Dog Dash. It’s the Muppet coaster. That should impact your rope drop strategy and your Lightning Lane strategy if you’re buying LLMP.
Parks with the Highest and Lowest Average Wait May 26 – June 1
- Highest: Hollywood Studios, average park-wide posted wait of 35 minutes (was 30 minutes at Animal Kingdom the week before)
- Lowest: Magic Kingdom, average park-wide posted wait of 22 minutes (was 18 minutes the week before)
Not crazy waits, but one interesting note is that Hollywood Studios finally overtook Animal Kingdom with highest posted waits. I predicted that waits were going to get crazy at Animal Kingdom thanks to the arrival of Bluey. But during this week, Bluey was on VQ and the average overall wait at Hollywood Studios blew up thanks to Rock’n’Roller Coaster being very popular and having very high waits. (fwiw, Animal Kingdom was right behind Hollywood Studios, with an overall park average of 34 minutes)
Parks with the Highest and Lowest Average Wait June 2 – 8
- Highest: Hollywood Studios, average park-wide posted wait of 35.5 minutes (was 35 minutes the week before)
- Lowest: Magic Kingdom, average park-wide posted wait of 22 minutes (was 22 minutes the week before)
Then when Bluey went on standby …. not much changed. Rock’n’Roller Coaster’s increased waits were enough to drag Hollywood Studios even higher. And Bluey’s wait is sneakily split between the posted wait for the train and then the posted wait for the show, so it actually brings the overall park average down instead of up.
Most Inflated Posted Wait Times
We all know that Disney inflates their posted wait times on purpose. They have many reasons for doing this. Some are totally understandable, and some are potentially more problematic. We can figure out how much posted wait times are being inflated by comparing submitted actual wait times from the Lines App and the posted wait time when the person timing their wait entered the line.
Over the past two weeks, actual wait times in the Lines App averaged 74% of what was posted. That’s a little higher than our historical average in the era of Lightning Lanes. Overall, if the posted wait time at a popular attraction was 60 minutes, you could’ve expected to wait just over 44 minutes instead.
But the worst inflation offender for the past week was Carousel of Progress [almost RIP]. At this one attraction, submitted actual wait times were only 24% of posted wait times in the past two weeks. That means that if the Carousel of Progress had a 10 minute posted wait, you probably would have actually only waited 2 and a half minutes instead. Less than a quarter of what was posted! Remember to always check the Lines app for predicted actual waits instead of making decisions based on what is posted.

This Week’s Wait Time Rock Star: May 26 – June 1
Between May 26th and June 1st, we had just over 1250 timed actual waits submitted through the Lines app. The one person who recorded the most actual waits during that time was aggie07, with 34 overall timed waits – 16 Lightning Lane waits, and 18 standby waits. Thanks for all of that timing, aggie07! It unfortunately does not compete with the the 97 timed waits in a single week from our current timing champion, preef.
This Week’s Wait Time Rock Star: June 2 – 8
Between June 2nd and 8th, we had just over 1250 timed actual waits submitted through the Lines app. The one person who recorded the most actual waits during that time was Digordie95, with 35 overall timed waits – 1 Lightning Lane wait, 23 standby waits, and 11 single rider waits. Thanks for all of that timing, Digordie95! It unfortunately does not compete with the the 97 timed waits in a single week from our current timing champion, preef.
Looking Ahead: June 9 – 15
I write this article on Tuesday evenings so that you all have the very freshest of data on Wednesdays. That means the 9th will already be in the past by the time you’ve read this, so welcome to your future!
We’re entering a little stretch of summer after the Cool Kid Summer debut and before July 4th where things should be calm, calm, calm. No crazy events or activities. No wild swings in park hours. Plenty of families across the country wanting to avoid theme park time in the summer heat. That should mean plenty of easy touring and no crowd levels above a 5. Maybe nothing above a 4!
Scattered thunderstorms are still in the forecast for pretty much every day. Highs in the 90s means that you’ll need to be prepared for heat, sun, and storms every day. Fans, sunscreen, umbrella, ponchos or rain jackets … all of the things.
Addendum
I accidentally missed last week’s article because my family is in the middle of an epic 18-day road trip through 10 national parks and a few other cool sites too! I can share pictures in next week’s data dump … or would you be interesting in a full blog post with some of my non-Disney planning tips and experiences? Let me know 🙂
Were you in the parks this past week? Or are you headed to Orlando soon? Let me know in the comments below!
You May Also Like...
-

We’re creeping toward July, and with it the promise of holiday travel, late summer debuts, and maybe - just maybe -…
-

Welcome back to the Data Dump! We’ve now had several straight weeks of low-to-moderate crowds and stable wait times. Hooray! As…
I’m late to post but I’d definitely appreciate a full blog post with your non-Disney planning tips and experiences! Your trip looked amazing on IG and I’d love to be able to reference the info later in a blog post.
Hi Becky –
Always enjoy looking at your data!
I do have a question – how do you determine the overall crowd level (first bar graph)? I ask because on 6/3 the crowd level is a 5 but if you look at your second bar graph (the individual parks), I would have thought that 6/3 would be a 4 and 6/4 would be a 5. Is the overall crowd level a weighted average as MK was a 5 that day? Would make sense as MK would draw the greatest crowds (and AK the smallest which would explain why AK was a 7 on 5/30 but the overall crowd calendar was a 4).
Thanks much – Jerry