
How TouringPlans Calculate Attraction Closures
 One of the most disappointing things that can happen at Walt Disney World, or any theme park, is to arrive at an attraction and find out the ride is closed. Some poor Cast Member has to tell a countless number of guests that the attraction is unavailable. The next questions the cast member gets is “When will it reopen?” and “Why is it closed?” Many closures are due to weather. Beyond that, the cast member generally will not know (or will not share) much information, nor will he or she tell you how long a closure will last.
Back in May, Len Testa announced that the Lines app now predicts when closed attractions will reopen. Re-optimized touring plans will adjust plans and moved a closed attraction to a time we expect the ride to be reopened. A warning: This post is on the geeky side and shows the analysis that is being used to make the app work. If you don’t want to peek inside the black box, feel free to stop reading. If you choose to proceed, may the light shine upon thee.
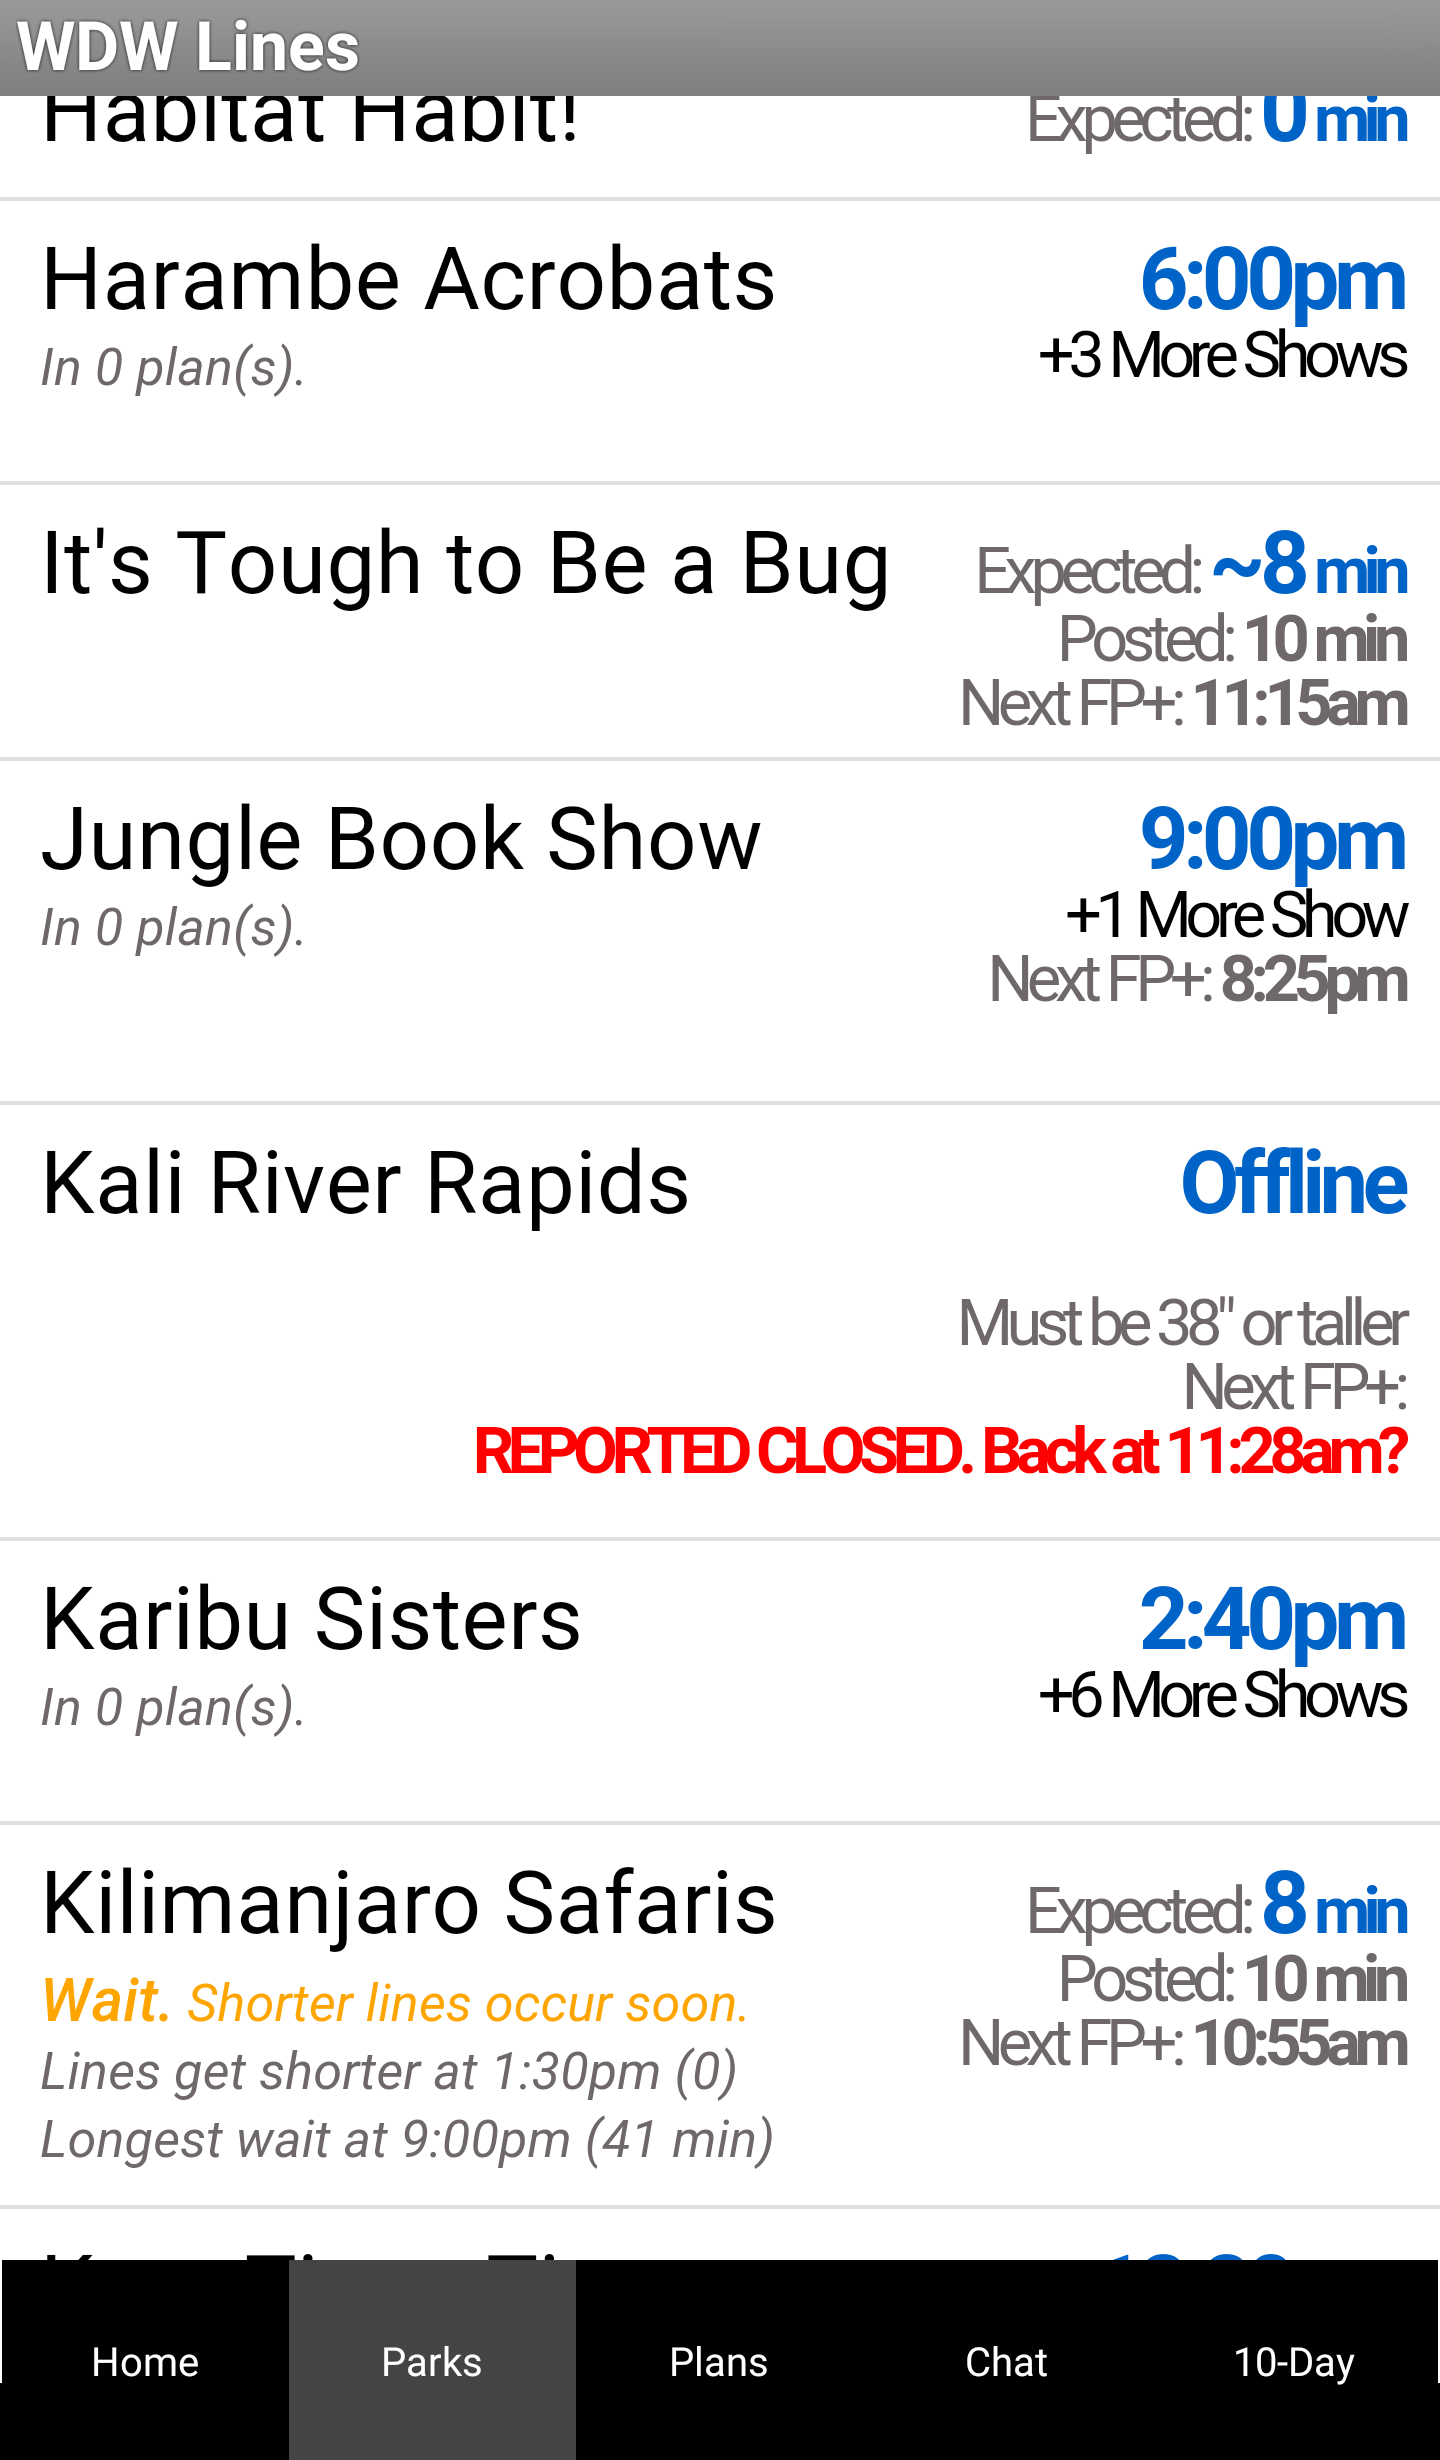
Along with the millions of wait times that are submitted to TouringPlans we also get thousands of submissions that mark attractions as closed. In the past 365 days, we identified 1,890 attraction closures at Walt Disney World. To save you a trek across the park, the Lines app indicates when attractions are closed. A submission of an active wait time also tells us when the attraction reopens. With this information, we can do better than the Disney cast members and estimate how long an attraction will be closed.
Not all closures are equal. Different attractions have different protocols for re-opening. Some attractions have to go through a whole safety check cycle for any type of closure. The length of closures can also depend on the time of day. If an attraction goes down close to the end of the day, Disney may choose not to even try to re-open it.
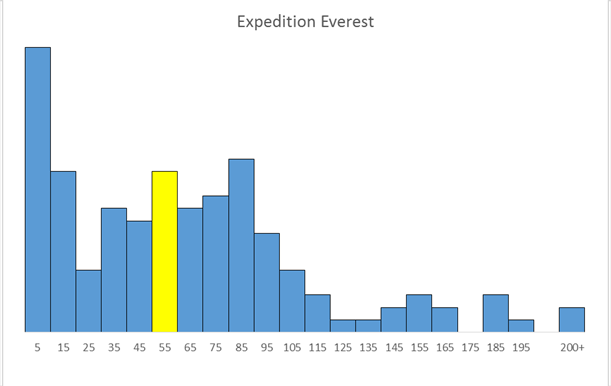
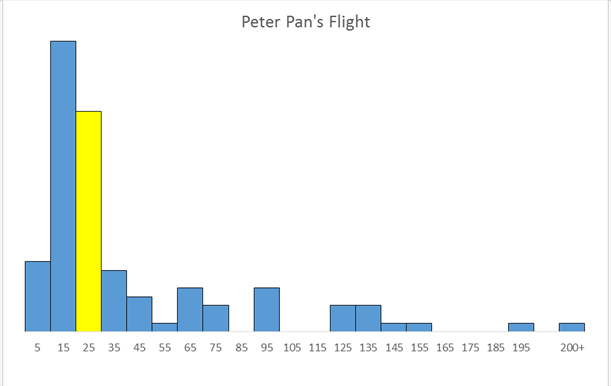
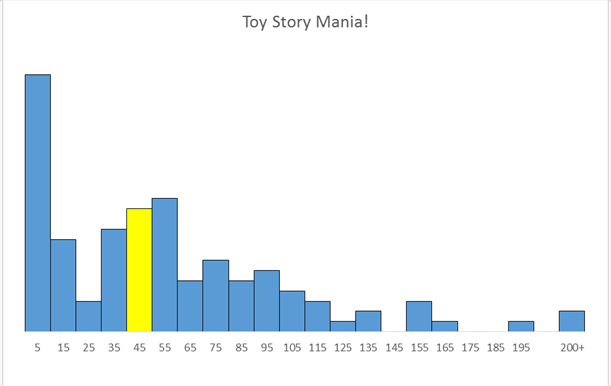
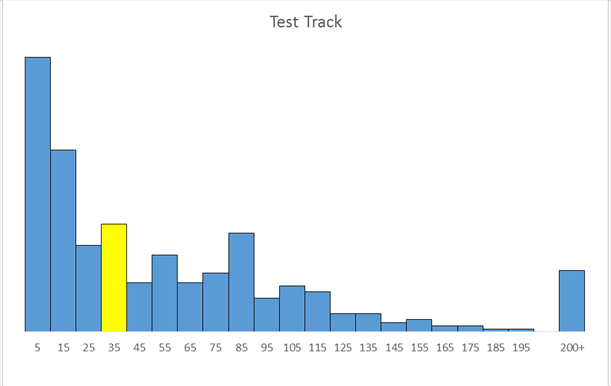
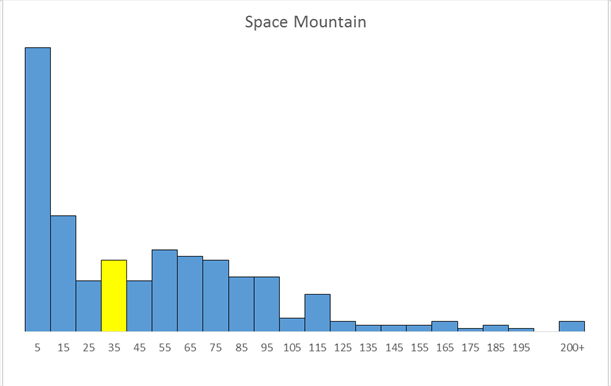
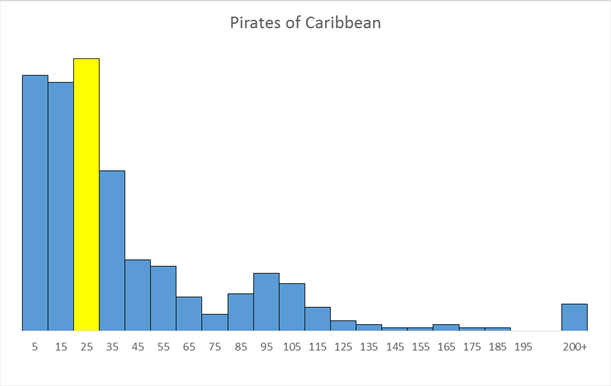
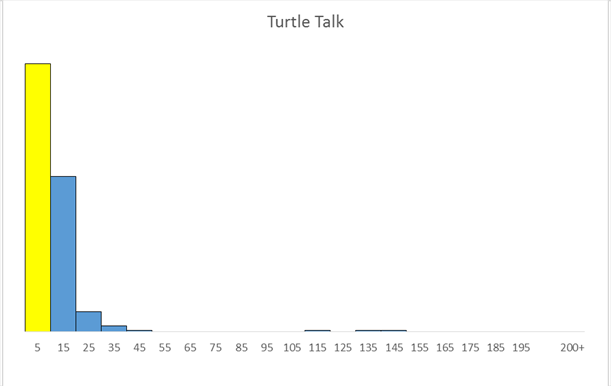
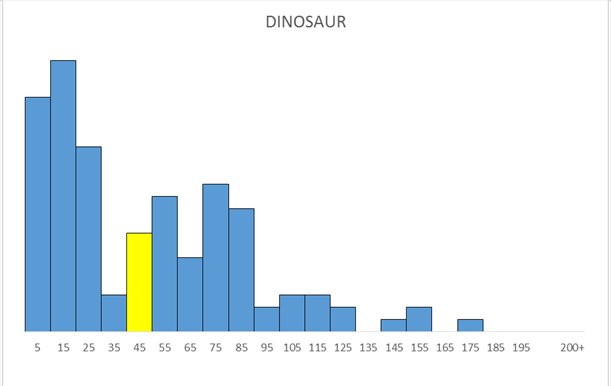
The good news is that most closures are short: 40% of all closures are under 20 minutes, and just 8% of closures are more than 100 minutes. Below are a few attractions and the distribution of length of closures. The highlighted bar is the median closure length. The median is the point where half the data is below and half the data is above.


 Once a closure is reported the app will estimate a reopening time. The initial estimate is based on the attraction previous closures and the time of day.
If the reopening time is approaching and the attraction is still reported close, the reopening time will be pushed back. The Lines app will tell you two pieces of information: last reported closure time, and when the attraction will reopen.
Have you used the reopening feature in Lines? Hopefully, it has helped you and improved your touring.
You May Also Like...
-

D23 is in full swing, and already there have been big announcements. One that took almost everyone by surprise was the…
-

In honor of Prime Day, we've opened our own TouringPlans Amazon Store! Here, you'll find our top picks for beating the…
-

Last weekend, we held the first TouringPlans virtual touring plan as we "visited" Magic Kingdom for the day and shared our…
-

This is a post in progress. Additional information about the effects of Hurricane Idalia on the Walt Disney World Resort, Universal…
This may not be the exact right forum to bring this up, but since talk in the comments has turned to actual wait time submission – have you considered expanding the app’s capability to allow users to directly enter their actual wait time?
There have been many, many times where I’ve either forgotten to start the timer when I get in line, or (much more likely) forgotten to stop the timer at boarding time. Allowing this type of entry would clearly require a higher level of trust on your end of things, but in my experience, if I could submit the time I got in line and the time I boarded after the fact, you would have many more actual times from me.
Thanks for the info. I was wondering this when were waiting for Frozen in early July. It just kept pushing the reopen prediction to three minutes from the current time. It makes sense now that I know you didn’t have the data yet – how could you have? I’m excited for this feature. You guys just keep adding these perks to Touring Plans. Thank you!
I can’t get enough of these kinds of posts. I love when Len, Steve, and the TP team gives us a glimpse of what Oz is doing behind the curtain. Yes, I’m a geeky programmer. Great job, as always, always refining.
I was wondering this too.
But on the other hand, I was in line for Luigi’s Roadsters at Disneyland when it went down and as any good Lines user will do I reported it but I also continued timing the actual wait, is it useful for predictions to submit a “I waited in line during a closure” time? I was unsure if the computer would recognize this or just get confused and think the line got really long at a weird time.
First, thank you for timing your actual wait times.
I’ve never thought about timing a wait time that includes a closure. How that data is stored, it is not obvious that the total wait time included a closure. We have the data to check and see if the beginning and ending time included a closure period. This sparked my interest. I’ll take a look at the data and see how frequently this happens.
This is awesome, love the histograms. I’m curious — my experience has been that when a ride closes, it will often reopen and then close again later in the day. Have you done any analysis of the probability of closures recurring, or the distribution of total “closed” time each day?
Hope to see more “behind the scenes” posts like this!
For this analysis, we assumed that each closure was independent. It would be interesting to see if recurring closures are more likely.
I would like to add weather to the closure models. If we could tell a closure is due to weather and have a weather forecast we could improve our predictions. Automating this would be the difficult part.
https://developer.forecast.io/ minute-to-minute precipitation forecasts 😉
Looks good. I so much want to do short-term prediction using weather forecasts. The biggest restraint is my time.
Ah, cool! I was actually wondering about this recently. How does Lines account for something like Frozen Ever After where there’s not as much data, but is seeing a bit more closure time since it’s new?
When we don’t have enough have historical data for a specific attraction we will use a more generalized model or use a similar attraction as a starting point.
For Frozen we used a model that looked at all the Epcot attraction closures.
I used this app quite a few times last week in Epcot to find out when the test track would be up and running again. I think it probably took longer than predicted as each time I checked on my lines app it told me to check back later and gave me a suggested time to check again. I found this to be really useful as we were walking around the world at the time so we didn’t rush back at our fastpass time just to find out that test track wasn’t working – as we were then able to use our fastpasses at any time, we were able to get around the whole world before going back to the test track which had by then started working again! Although the rest of my group are not touring plan addicts like I am – they were pleased I had the app that day!!!