
Crowd Calendar Adjustments
For readers keeping track, we are currently on the fourth iteration of our Crowd Calendar methodology, which has evolved as we have gotten more data and better technology. In the beginning, the only information we had was data collected by the Testa family doing wait time loops and writing down their observations (seems like 100 years ago). When the Lines app was introduced, however, we began getting hundreds of wait times submitted daily by users.
Today, we get thousands of wait times submitted each and every day. Gifted with all of this wait time data, we can validate and evaluate our predictions and methodologies. Well, it is about time to make some new tweaks, which we plan on implementing for 2017. The reason we are bringing this up now is so users are aware and so we can get feedback. Without our users we wouldn’t be able to do this, so we want to make sure we’re giving you the best product we can.
The Touring Plans Crowd Calendar is based on wait times at specific attractions at each park. Yes, simply using that day’s attendance would be better–and we would love to use it, but Disney simply does not release daily park attendance. The reason we decided on attraction wait times is that they are quantifiable and predictions can be verified.
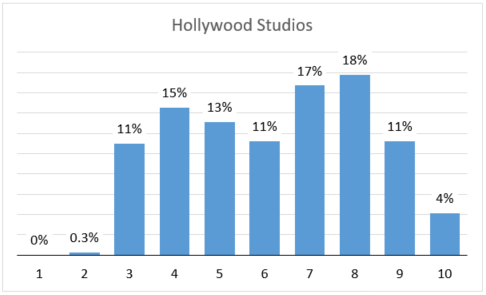
This method is not perfect, though. For instance, the Disney Hollywood Studios changes over the last couple of years have skewed that park’s crowd levels. There are fewer operating attractions at the Studios right now, and the ones that remain tend to be very popular (Rock ‘n Roller Coaster, Toy Story Midway Mania, et al). Therefore, the wait times have increased, but not because there are more people in the park, just that there is less for them to do once they get there.
The way we have designed the current distribution of our crowd levels is to have half of each year’s days with crowd levels between 1 and 5, and the other days with crowd levels between 6 and 10. With the current settings, there are no days with a crowd level of 1, and very few days with a crowd level of 2. The way we plan on adjusting our settings means that some of the “3” days will become “1” or “2” days. Other parks’ crowd levels are also currently skewed, but not as significant has Hollywood Studios.
The way we go from attraction predictions to crowd levels is a little bit science and a little bit art. When all attraction prediction are very low or very high it is “easy” to score those days as a “1” or “10” respectively. The artistic part comes when selecting the attractions that best represent a park’s crowd levels. We avoid including a new attraction since elevated crowd levels are partly due to its popularity, not the park’s crowd level. The Magic Kingdom has the most attraction and gives us the most flexibility in selecting attractions.
We score each attraction on a scale of 1 to 10 based on the daily average wait time. For Crowd Calendar 4.0 we use wait times between 10am and 5pm as the evaluation period, which was selected because all parks are open between 10am and 5pm. One of the adjustments that we are planning on making is starting the evaluation window to 11am because the 10 o’clock hour is not a good indicator of the entire day’s crowd level–even on crowded days the mornings can have low crowds. By using 11am to 5pm as the evaluation time period we see more variation between days. We don’t use times after 5pm because guests start to leave and are beginning to spend time going to dinner.
Here is a table showing the Magic Kingdom attractions. The list is ordered by the range of daily average wait times with the ranges calculated by dropping the top 5% and bottom 5% days. The median is the daily average wait time where half the days are above and half are below. The attractions that are in bold font are the current attractions used in the Magic Kingdom crowd level.
| Attraction | Range | Median |
|---|---|---|
| Splash Mountain | 67 | 40 |
| Space Mountain | 57 | 51 |
| Big Thunder Mountain | 47 | 42 |
| 7 Dwarfs Train | 43 | 93 |
| Buzz Lightyear | 40 | 30 |
| Under the Sea | 35 | 36 |
| Princess Hall: Cinderella/Rapunz | 34 | 55 |
| Dumbo | 33 | 27 |
| Peter Pan’s Flight | 33 | 49 |
| Jungle Cruise | 30 | 42 |
| Town Sq Mickey | 27 | 29 |
| Tomorrowland Speedway | 27 | 27 |
| Winnie the Pooh | 26 | 38 |
| it’s a small world | 23 | 19 |
| Ariel’s Grotto | 23 | 32 |
| Barnstormer | 23 | 22 |
| Pirates of Caribbean | 23 | 21 |
| Astro Orbiter | 21 | 26 |
| Enchanted Tales with Belle | 21 | 31 |
| Haunted Mansion | 19 | 23 |
| Princess Hall: Frozen | 17 | 60 |
| Magic Carpets | 17 | 12 |
| Pete’s: Goofy/Donald | 16 | 19 |
| Pete’s: Minnie/Daisy | 15 | 23 |
| Mad Tea Party | 13 | 17 |
| Laugh Floor | 8 | 14 |
| PhilharMagic | 7 | 10 |
| Town Sq Tink | 7 | 19 |
When selecting attractions to include the crowd calendars, we want a broad range attractions and attractions with a large variation in wait times. Enough time has passed now that we can add the New Fantasyland attractions. Even with Splash Mountain having the largest range of wait times, its wait times are a better prediction of the weather than the crowd levels. Princess Hall changes are coming up so we will not include them right now.
We have empirical data showing that wait times are up, but at Disney’s May 10, 2016, Q2 Earnings Release, Disney said that attendance was down. At this point, we have to assume the higher wait times are the new normal. With the higher wait times and new evaluation window, we have to change the thresholds for each attractions’ crowd level.
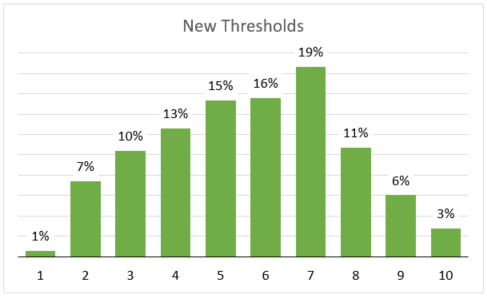
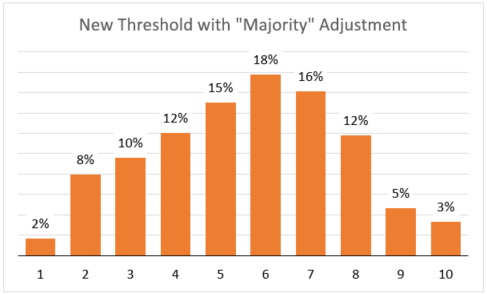
The next adjustment we are considering is how we combine attractions’ crowd levels to park crowd level. The Crowd Calendar 4.0 method was to drop the highest and lowest crowd levels and take the average of the remaining attractions’ crowd levels. The new idea is to add an additional step: If majority (50% or more) attractions have the same crowd level, that will be the park crowd level. This change would only affect 30% of the park/days but does increase the number of days with extreme crowd levels.
Thoughts? Suggestions? Questions? Let us know below.
You May Also Like...
-

The April Crowd Calendar update only has minor changes. We are halfway through spring break, and crowd levels have been in-line…
-
We have been holding off on doing any big Crowd Calendar updates until we saw how the crowds were in 2021.…
-

The February 2020 Crowd Calendar update is now live. So far 2020 is showing increased crowds at Walt Disney World. We…
-
All four Disney World Parks are now open and crowd levels can be described in one word. Low. Every day has…
My suggestion is to add an “11” to those days that we all know are going to be crazy both Crowd Feel & Ride Time and just pull them out of the calculations.
If I’m planning a trip the weeks after Easter or Christmas, and I don’t already know it’s going to be crowded, then anything else your App does for me is pointless. However, those of us trying to determine trips in May or September will have a better guide for planning if we see an 8 in May and a 4 in September. (e.g.)
Big picture: Everything you do is most appreciated. Families are spending a lot of money and looking to get the best experience possible. Thank you so much for all you’ve done to make our trips as great as they can be with minimal wait times.
A “10” should be those days. 1’s and 10’s are designed to be the bottom 5% and top 5% days of the calendar.
Will Universal Parks’ crowd calendar be getting an upgrade, too?
I would certainly use attraction wait time as the basis for the crowd calendar. It may not work for everyone attending these parks, but it is the best measure for most of us readers of this blog. We are planners who want to experience as much as we can on our trips to these parks, and basing the crowd calendar on wait times support your customer’s needs.
Yes, Universal and Disneyland will be updated.
As the mayor of Swallow Falls says, “all I heard is blah blah blah science.” Seriously, this is a terrific application of operation research methods. I’d love to see the next version of the CC bring back the tenth place in the crowd level measure. My family always goes at peak periods (e.g., spring break) so the current crowd calendar shows 9 or 10 for every park. That doesn’t give me enough distinction to help me choose during these periods. One park might be 8.6 and the other 9.4, but the calendar shows 9 for both. If you have all the data, please show it so users can make better decisions. Thanks!
Including the decimal point implies a level of precision that our predictions do not have. A 9.2 and 9.8 are not significantly different.
Yay statistics!
Wait times are the leading indicator and best measure of what the impact will be on your vacation. Say at any given time 25% of the total attendance of the park are in shops. If, for whatever reason… maybe there’s some incredible giveaway they do and everyone has to go to shops for it… that were to double to 50%, I think the wait times wouldn’t drop commensurately… because a) not everyone who is in the shop used to be on a ride and b) Disney can throttle its wait times as they please… running fewer vehicles, progressing through more slowly, etc.
All that to say, roll out 4.0 as soon as possible! I vote for the second “Majority” adjustment too. Lean on the wait times for the feel.
Sounds great. I think you should roll that out whenever it’s ready rather than wait for 2017. IIRC normally the crowd predictions change a bit maybe 30 days out, and I’d always have more accurate (or maybe simply distributed better) information when available.
Bruce
My comment is to this statement:
>> If majority (50% or more) attractions have the same crowd level, that will be the park crowd level.
Personally, I would only take account of the more popular rides anyway. If (to take an extreme example) Country Bear Jamboree went from a crowd calendar 4 to a crowd calendar 8, it probably wouldn’t affect wait times – they would still be every 12 minutes or so. So I would only use the attractions which normally have a mean wait time of (say) half an hour or more as part of that computation.
The big outlier in the crowd calendar predictions is Epcot during Food & Wine (and to a lesser extend Flower&Garden). The crowds in the park, especially on the first few weekends of each, are huge, and in NO way accurately predicted by ride wait times. I’m the first to say that given the available data, I don’t have a good, fast way to fix this, but I have thought of one that might work:
Since you you allow users to report their wait times on rides, why not also allow users to report wait times at each of the food booths at F&W and F&G? These booths are frankly why most guests are going to Epcot at those times anyway, and from those numbers, after a few years of data and calibration, you should be able to improve the crowd predictions for those times of the year. It won’t be a quick fix, but it should be better than what exists now.
Yes yes yes! I would love to see this functionality come into play with your app! Even just knowing what the current wait time is without historical data would be handy.
It raises an important question – do we want crowd calendars to reflect attraction wait times, or the number of people in the park? Your issue points out one of those few cases where there’s a disconnect between the two.
I don’t know the answer, but my personal choice would be to reflect wait times. For the way I tour, large numbers who are not visiting attractions don’t matter to me.
This is a great idea, and I think it would be valuable to have two calendars: A Ride Wait Time calendar, and a Crowd Feel calendar. The only issue is a Crowd Feel calendar would be a lot harder to generate. Measuring wait times for food would be a good place to start, though!
The Crowd Feel calendar would be really useful for knowing how far in advance you need to stake out a spot for parades and fireworks.
You blinded me with science. I just want to say how happy I am that I have access to a crowd calendar that is so firmly based in real statistics that has been developed over years (decades?) of careful analysis. Yours is the first and still the best!
YES! What she said.
So do you add say pop warner, cheerleading, large tour group seasons,different state school holidays etc?
Yes. We have a ton of factors that go into our models. We try anything we can think of. School holidays are one of the more significant predictors. This year we doubled the numbers of school districts that we follow. Recently we added sunrise and sunset times.
Thanks Steve. I’ve been asking Fred and Len questions on the forum about my wait times at Epcot increasing so drastically with a crowd level of 4 on 6/25/16. (Soarin’ went from 29 mins to 80 mins.) I guess based on your discussion, the popularity of the new attraction is not reflected in the crowd level prediction for Epcot that day.
I like what you are doing for HS. Have a greater spread in crowd levels increases the usefulness of this information in choosing what park to go to. Are you going to reapportion the wait times at each of the park in order to obtain a greater spread in park crowd levels at the other parks? If the vast majority of days are 5s or 6s and there are few if any 1s 2s or 10s, using crowd levels becomes much less useful in choosing what park to go to on a particular day. Also are you going to use this information to adjust the overall crowd level at Disneyworld?
Yes. HS was justed used as an example, and HS has the biggest change in wait times.