
Deep Data Dive into Park Pass Availability in 2020
Background
When it reopened in July, Walt Disney World set limits on the number of people that could be in each theme park each day. To keep track of that, Walt Disney World requires guests to obtain a Park Pass reservation.
Disney hasn’t said how many Park Passes are available for each day and park. (We estimate it’s between 12 and 15% of the park’s theoretical capacity right now.) We’re told that the number of Park Passes has not increased since the re-opening. Based on our observations EPCOT and Disney’s Animal Kingdom have more Park Passes than the Magic Kingdom and Hollywood Studios, respectively.
Disney tracks each park’s reservation inventory by splitting the available reservations into three groups:
- Onsite resort guests
- Date-specific ticket holders
- Annual passholders
In practice, we think Disney gives priority to onsite resort guests and date-specific ticket holders since Disney has said that those two groups spend more per visit than annual passholders. Because they’re the lowest priority group, passes for annual passholders are “sold out” the fastest.
Which Disney World Parks Run Out of Reservations Fastest?
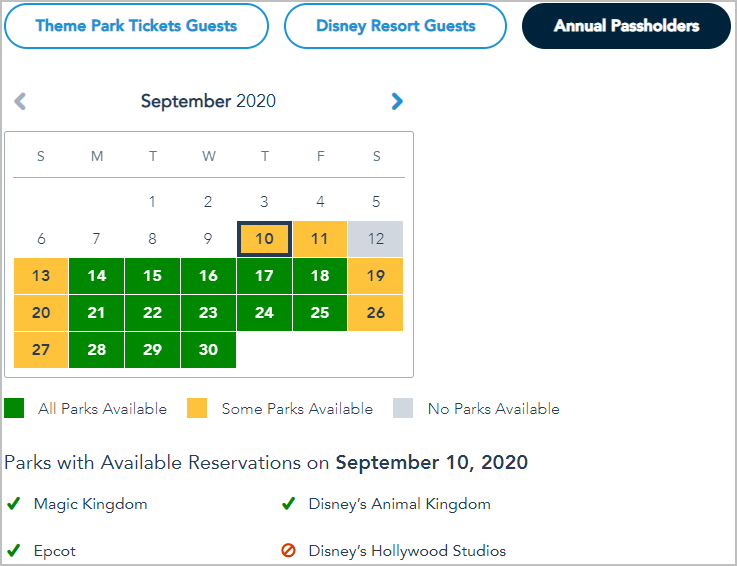
In general, Disney’s Hollywood Studios runs out of reservations first, followed by the Magic Kingdom. To check the current Park Pass availability go to https://disneyworld.disney.go.com/availability-calendar/?segments=tickets,resort,passholder.
Park Pass Data
We like data, and the Park Pass system has some good data. We were hoping to infer crowd levels based on Park Pass data, on the assumption that the faster the Park Passes sell out, the higher the demand, and the higher the crowd levels. But there’s a limit to what we can infer. When the Disney website says that there is availability, we don’t know if 1% or 99% of the Park Passes have been distributed. In the Park Pass data, we have observed availability returning to a group after showing no availability. We assume in most cases that this is Disney moving inventory from one group to another.
We started collecting data on Park Passes in late July. For this blog post analysis, I will only be looking at data since August 1, 2020.
100% Unavailable
Since tracking the Park Pass data on September 5 and 6, the Saturday and Sunday of Labor Day weekend had all parks for all groups unavailable. September 7, Labor Day, only had Disney’s Hollywood Studios sold out for all groups. We don’t know the attendance numbers for the parks, but we can assume what we saw on September 5 and 6 were peak capacity with the current health and safety measures.

The table above shows that Annual Passholders have been the most affected by the Park Pass restrictions. Besides Labor Day weekend, Disney Resort Guests’, and Theme Park Ticket Guests’ demand has not exceeded capacity. The numbers in the charts show how many days prior that the Park Pass first sold out. Disney has reallocated Park Pass capacity so it is possible, and likely, that Park Passes can become available after they were not. The white cells with a number were sold out at some point, but on the specific date, there was Park Pass availability.
Reallocated Park Pass Capacity
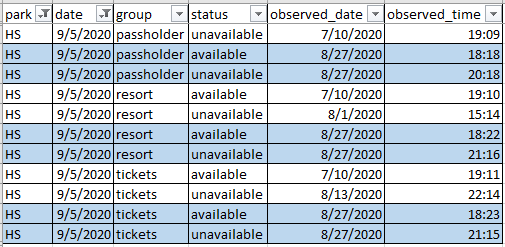
Here is an example of Park Pass capacity being reallocated. On August 27, Annual Passholder and Park Ticket guest Park Passes became available. The availability lasted for a few hours to a few days.

One other part of the Park Pass data is that Disney has restored availability after a park and group has been sold out. In most cases, it appears that Disney is redistributing Park Passes between the three groups.
Here is the same data for Hollywood Studios. On August 27, all groups had no Park Pass availability. Availability was added for all groups, which would mean that the park’s capacity had to have been increased. Since all groups became unavailable in just a few hours this might have been a mistake on Disney’s side.
Wait Times and Park Pass Capacity
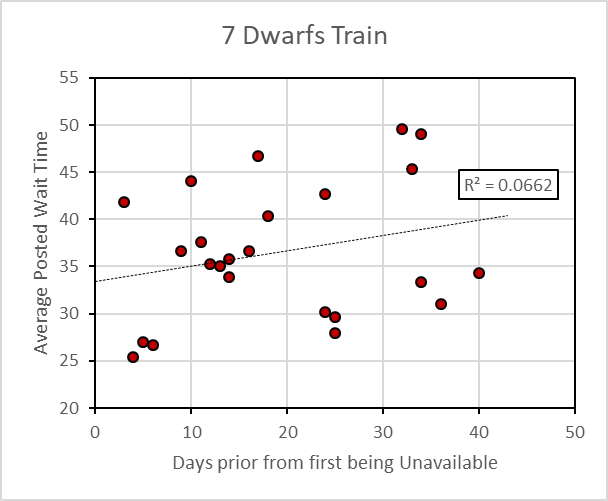
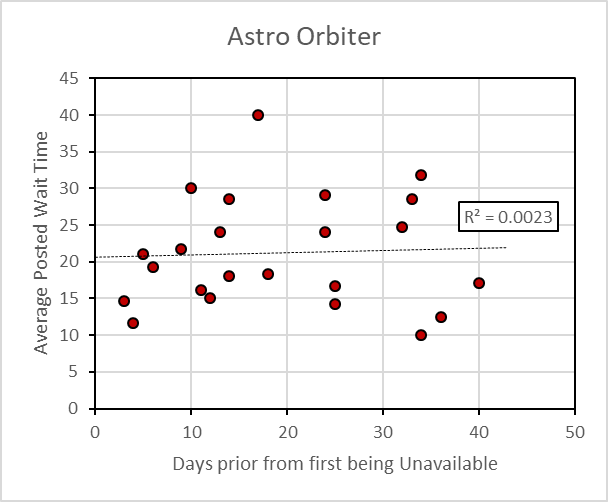
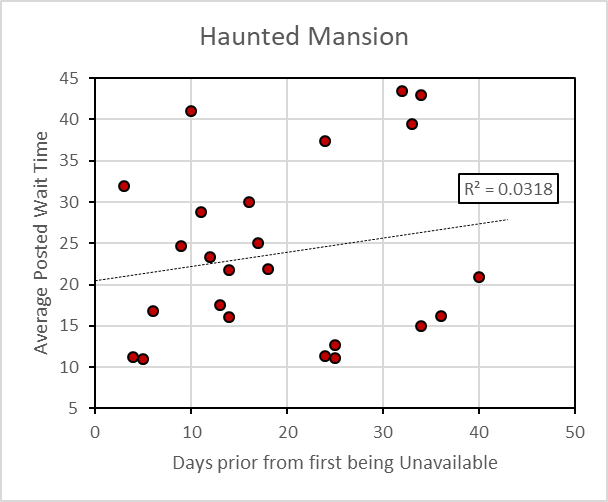
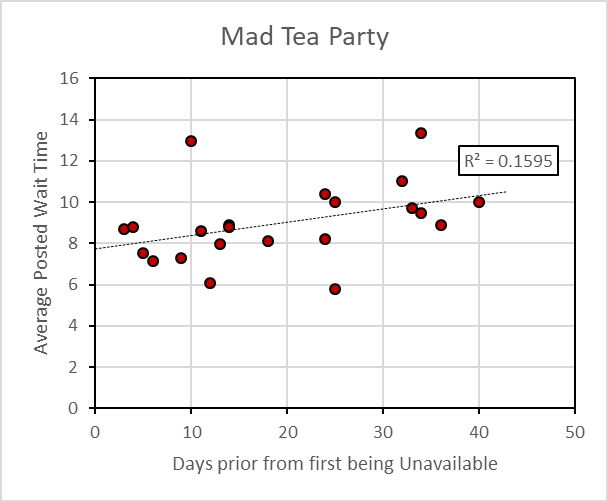
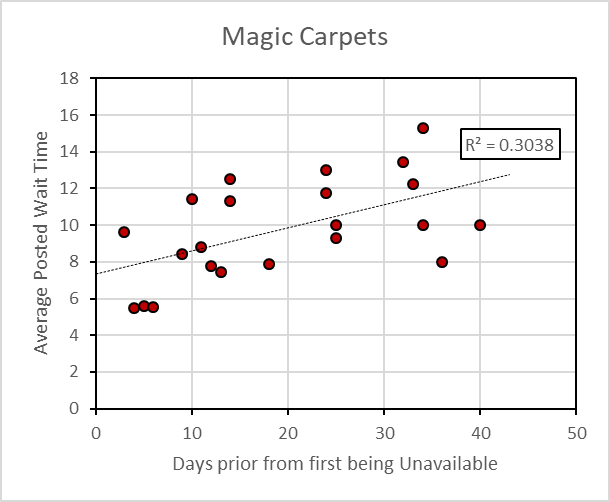
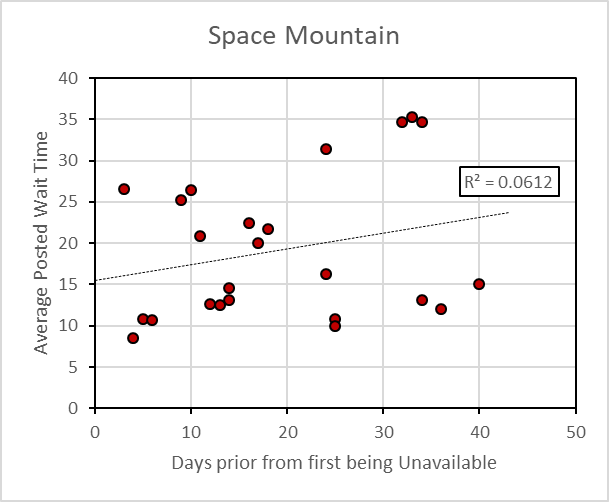
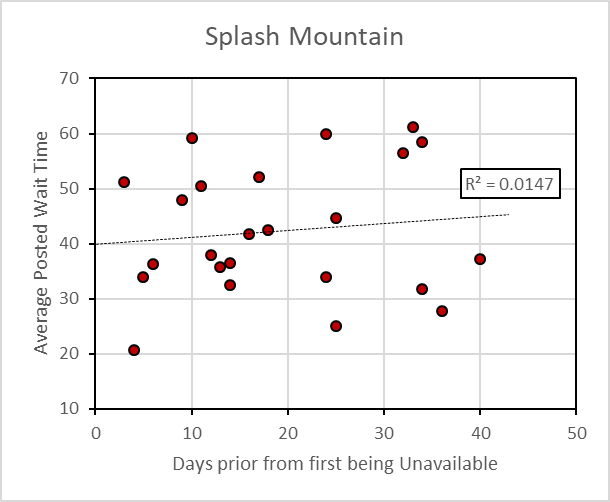
Our hypothesis is that the faster a park’s reservations sell out, the higher wait times will be, and thus higher crowd levels. Since Disney Resort Guests and Park Ticket Guests are rarely unavailable we cannot infer much from that data. Annual Passholder Park Pass reservations do become unavailable. Below are charts showing the relationship between an attraction’s average posted wait time and the number of days prior that Park Pass reservations were not first available. The R-squared (R2) statistical measure that represents the proportion of the variance for a dependent variable that’s explained by an independent variable. R-squared values range from 0 to 1. An R-squared of 1 means that all variance of the dependent variable is completely explained by the independent variable.
Magic Kingdom


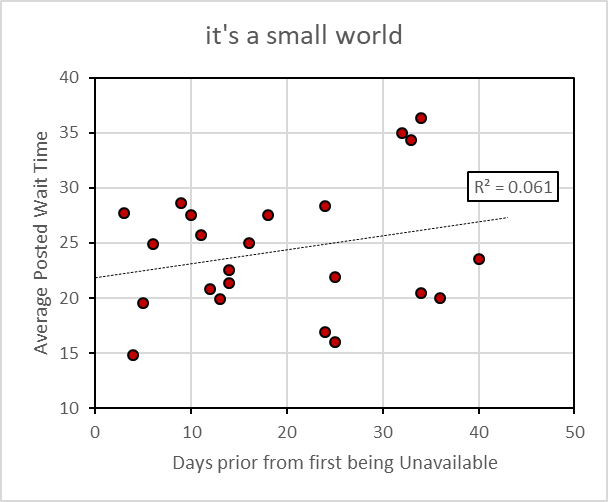
EPCOT


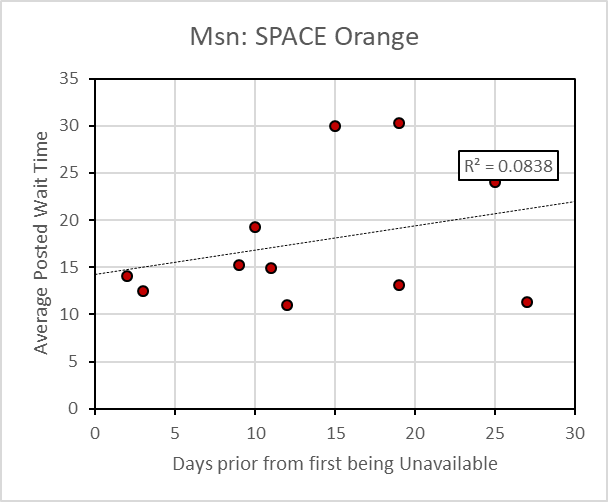


Hollywood Studios


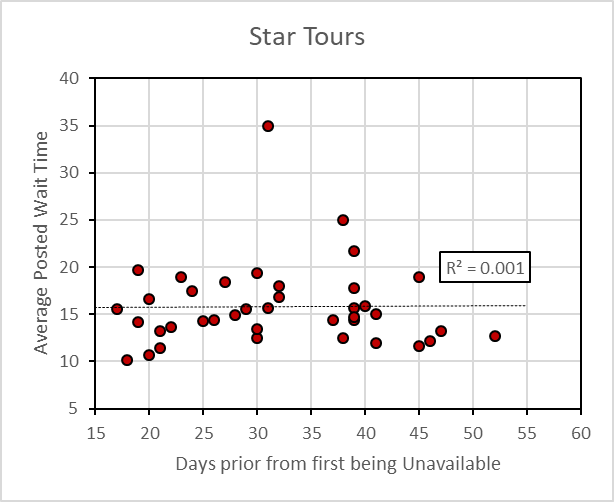


Animal Kingdom


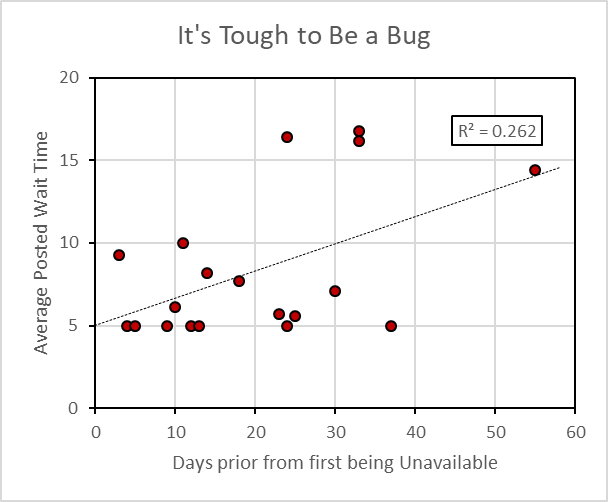


The slope of the regression line is positive on most of the charts. This supports the idea that the quicker Park Passes become unavailable, the higher the wait times. The variance is high, so the R-squared is low for many attractions. Park Passes becoming unavailable for Annual Passholders is more a function of the limited availability than demand.
Peak Crowd Levels
Labor Day weekend had the highest crowd levels since reopening. Without Disney increasing attendance levels at Walt Disney World, we do not expect to see crowds much higher in the rest of 2020.
| Resort Wide | Magic Kingdom | EPCOT | Hollywood Studios | Animal Kingdom | |
| September 5, 2020 | 2 | 2 | 4 | 1 | 2 |
| September 6, 2020 | 2 | 2 | 5 | 1 | 2 |
| September 7, 2020 | 2 | 2 | 4 | 1 | 1 |
EPCOT had the highest crowd levels. This is not due to EPCOT being the most popular park, but a large park with more space for guests to social distance. Conversely, Hollywood Studios was only a crowd level of 1 all weekend. This is due to the park being small and having less space for social distancing. I expect Disney is evaluating how Labor Day weekend went and will adjust capacity limits. I suspect Disney will increase capacity for the Magic Kingdom, Hollywood Studios, and Animal Kingdom.
Crowd Calendar Update
With knowing that Epcot can hit a 5 with current health and safety measures, we expect other traditionally busy times will have similar crowd levels. Also believing that Disney will increase capacity we are going to raise our crowd level predictions for select dates.
Have any questions or thoughts for the stats team? Let us know in the comments.
You May Also Like...
-

What Is Disney's Park Pass Reservation System? When it reopened in July 2020, Walt Disney World set capacity limits on the…
-

The parks are reopening soon (July 11 for the Magic Kingdom and Disney's Animal Kingdom and July 15 for Disney's Hollywood…
-

With the release of 2022 Walt Disney World Vacation Packages, Disney has officially confirmed that the Disney Park Pass Reservation System…
-

This is a follow-up to my recent Park Pass analysis blog post. The big unanswered question: If Park Pass availability does…
Does your data suggest how far in advance park reservations should be made? I know “as soon as possible “ is always good but if it’s almost a year to your next trip, is it really necessary to purchase tickets now?
Have you looked at the Park Availability for March and Spring Br all because the availability is totally swapped – tons of AP availability and nothing for resort guests! I would love to see this updated for this month as it looks to be the busiest we have ever seen the parks!
We have been watching Park Pass availability. I think what is happening with AP availability is due to passholders can only reserve 3 days at once. I’ll plan a blog post update once we see how March pans out.
From a fellow mathematician, a logarithmic transform might help with that R-squared. Or treat it as a count and do a Negative Binomial… when I used Negative Binomial it really knocked my CI’s down and helped with my residual plots.
That 110k just floored me… as I pull into Epcot. Wow, that’s why 18k people looks like there are so few people even at max current capacity.
Hey Brandon – we think the total park capacity for all three groups combined is around 12-15% of its overall capacity. So for the MK, for example, we think Disney’s capped attendance at around 12,000 people right now. The MK’s theoretical capacity is around 90,000.
Here are the other numbers we’re working from:
EPCOT: 18K / 110K
DHS: 6.5K / 60K
AK: 8K / 60K
As a Disney fan with a math degree, I love going through this stuff! Knowing you use a mathematical approach with solid data is why you are my number one go-to for my Disney plans!
I’m not sure this is possible, but have you ever placed someone outside the gates and counted the number of guests through the turnstiles on a sold out day?
We have thought about it. Logistically it becomes difficult. The Magic Kingdom might be the easiest as everyone has to walk through two tunnels at the train station. Then the problem is, do you have to count all day?
This data is amazing! When do you think those crowd levels will be updated in touring plans?
“Disney hasn’t said how many Park Passes are available for each day and park. (We estimate it’s between 12 and 15% of the park’s theoretical capacity right now.) We’re told that the number of Park Passes has not increased since the re-opening.”
Do you mean 12-15% per group?(3 ticket groups), or is that percent the total current capacity per park?
In other words, is the total park passes available between 36% and 45% of normal capacity?