
TouringPlans Lines App: Ride Prompts, Expected Waits, and a Math Problem
If you don’t already have it on your phone, now is a good time to download the TouringPlans Lines app. Even if you don’t have a Disney World trip on the calendar, the Lines Chat alone is is comedy gold and worth the effort.
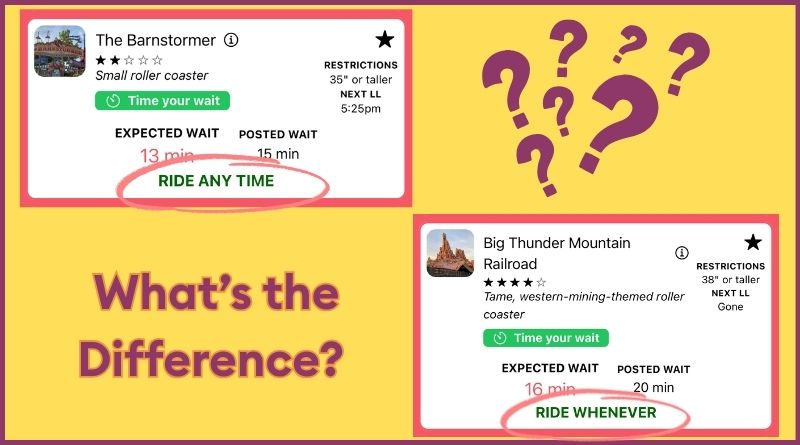
Let’s assume that you’re a reasonable adult who makes good decisions and you do have at least one Disney World trip in your near future. This post is for you, because we’re going to break down the difference in ride prompts that you’ll see when you’re using your Lines App to get around Walt Disney World.
We also include some excellent information from Len at the bottom of this post about our current wait time forecast / expected wait time accuracy! Scroll all the way down for this data.
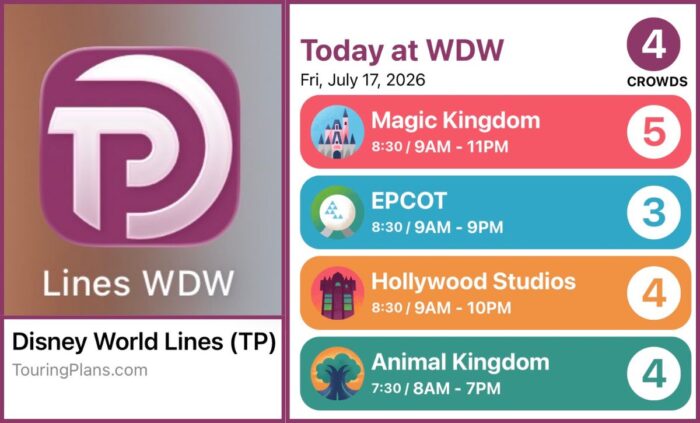
The right side of the image above shows the Lines app landing page. You’ll be able to get 10 days of park crowd calendar forecasts from the app and Subscribers (Liners) have access to a rolling 365-day Crowd Calendar.
Let’s pretend that you have very low crowds on your park day and you don’t want to commit to an actual Touring Plan. No problem! You’re still going to want to know the best time to ride certain attractions, so we’ve done a quick primer on a few ride prompts you’ll see.
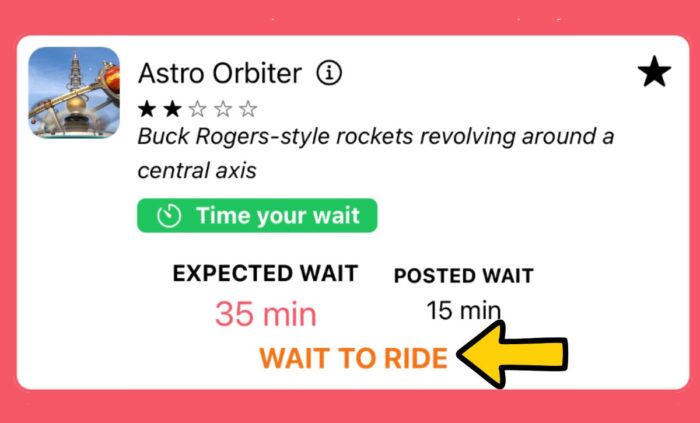
Wait to Ride
This one is pretty easy, but it means there will be shorter waits during the day. You can see that when we captured this wait time for Astro Orbiters, our expected wait, 35 minutes, was more than double Disney’s posted wait.
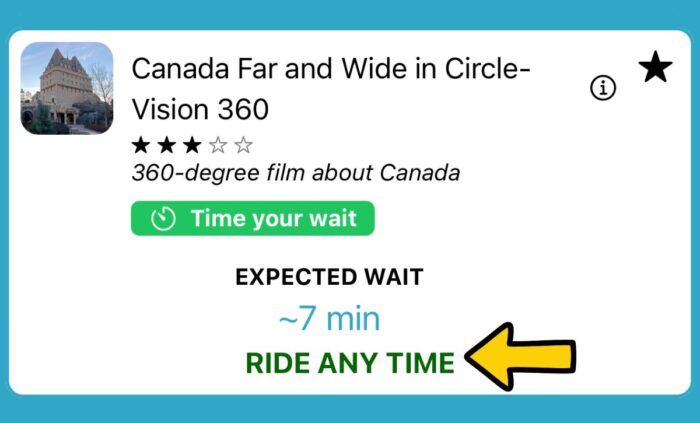
Ride Any Time
The Ride Any Time prompt is generally for continuously-running shows, like Canada Far and Wide. Your wait time for attractions with this designation should be the amount of time between when you arrive and the next show. If you pop over to the Canada pavilion just as the doors have closed, your wait will be the length of the current show.
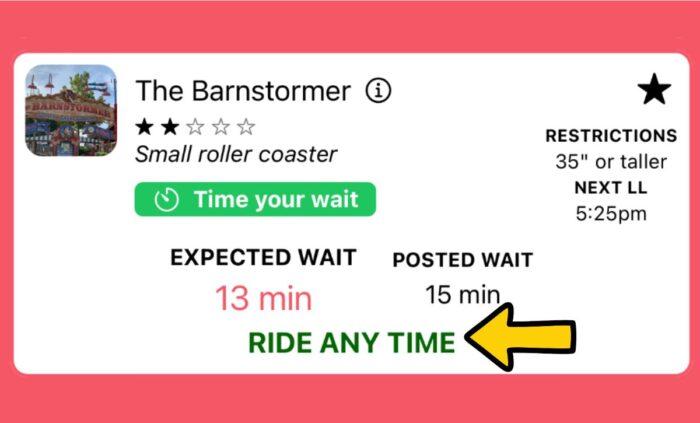
The Barnstormer is not a show, but the Ride Any Time prompt applies because we’re forecasting the wait times to be about the same or lower than the expected wait you’re seeing.
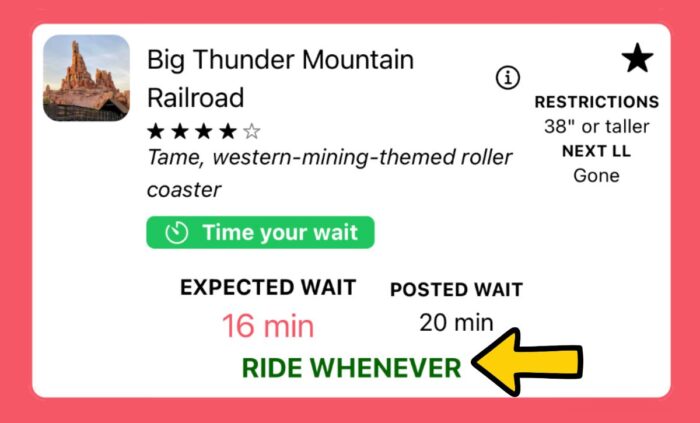
Ride Whenever
- There’s no clear dip in waits expected for the next 5 hours
- In the next 5 hours, all the wait times look to be about the same
Our Expected Wait Time Accuracy
We’re pretty proud of our wait time accuracy so far this year! Many thanks to the Lines who have submitted thousands of actual wait times on our app. Let’s break down how we turn those actual waits into more accurate expected waits on the Lines App…
We measure our actual wait times by capturing the second you start your timer in the Lines app and Disney’s posted wait at that moment. When you stop your timer, we save how long you waited. At that point, we know how long your were in line and how long Disney said you were going to wait. This is why we stress the part about not stopping the timer until you’re about to board your ride vehicle. The more accurate your actual wait time, the better our forecasts and expected waits.
A big part of our data analysis focuses on which number was closer? Did Disney’s posted wait time “beat” our expected time? If so, why?
Our expected wait time goal right now is 70% and we’ve been at that mark for all of 2026 with recent numbers trending a smidge higher. That means that our goal is to be as accurate or more accurate than Disney at least 70% of the time.
There are a few areas that prevent us from being 100% accurate. First, there are times when a ride has a posted wait of 5 minutes and our expected and your actual waits are also 5 minutes. No wiggle room there.
Weather makes the numbers go wonky. The Magic Kingdom has nearly a dozen rides that go down when there is lightning within 6 miles of the park. Disney knows before we do that they’re going offline for weather and it takes us a minute to catch up.
Unposted ride downtime is, obviously, unpredictable. Very often Disney will take a ride offline for several minutes but not clear the line or post “Offline” on the My Disney Experience app. So, the wait times go up considerably but the ride is still showing open and running. This is going to skew any actual waits we gather during that period and affect our overall accuracy for that ride that day.
Posted ride downtime, like when Disney takes Rise of the Resistance offline, is common and impacts not only that ride, but other attractions in the area. Since we can’t predict downtime, our accuracy takes a hit for the few minutes it takes us to capture everything.
The Problem
Does anyone know why Disney’s posted wait times for Buzz Lightyear get more accurate when Space Mountain goes down? Please email len@touringplans.com if you have some math or data to explain this!
Our biggest point of pride in the Magic Kingdom at the moment is, thanks to a ton of in-park research & Liner work, our expected wait times are more accurate than Disney’s posted wait times 80% of the time during the first hour the park is open!
We track times in 15 minute increments from open to close each day ~ including Early Entry!
Many thanks to our Liner pal, Patti, who suggested this post! Do you have suggestions for blog posts about the Lines app? Please let us know. Thanks for reading!
You May Also Like...
-

TouringPlans Subscribers (Liners) have submitted 45,197 actual wait times for Walt Disney World and Disneyland Resort since May of this year!…
-
Len has been running wait time numbers for Walt Disney World ~more than 1 million of them!~ to help you maximize…
Are there “when to ride” indicators for the Disneyland app as well?
Space Mountain wait times are off/misleading because Disney is trying to get you to come over to that side of the park (and stay and shop and eat and ride secondary attractions like Buzz + tertiary attractions like TTA, Carousel of Progress, Speedway rather than move onto Fantasyland or back across to other Mountains). Once Space goes down, Buzz Lightyear becomes the main draw to that side of park so the wait time has to be more accurate to draw people over. Wait times at Buzz are generally inflated to get you to opt for those tertiary attractions. If the posted wait time at Buzz is accurate, that will draw you over even if Space is down. Is that cynical enough? (Tron exists in a vacuum because of Lightning Lane Single Pass and still generally new for most guests and so a constant draw.)