
Disney Data Dump June 21 2023
We’re halfway to the holidays! And while I don’t like skipping over the summer … those deals are pretty great. And we all know how Disney works. Great deals = not enough vacations booked at full price to fill up the resorts and the parks. And not enough vacations booked = not many people in the parks. And not many people in the parks = lower than expected wait times. So if you’ve got a vacation booked any time in the near future, enjoy your vacation! The parks won’t be empty, but they shouldn’t be slammed either. Let’s take a look at what that looked like this week.
Observed Crowd Levels 6/13 – 6/19

So our little pattern of decreasing crowds through the week, follow by a spike on Monday, isn’t quite as drastic as the past two weeks. It’s still there, though. Disrupted by a blip on Friday. Come on, Friday, get with the program. Monday is still easily the worst day to visit a Walt Disney World park, if you care about wait times. And the weekend is still the best time to go. It’s weird and counter-intuitive. But it’s true.

If we drill down to the park level, we see that our reliable Magic Kingdom trend is still there – other than that blip on Friday. Last Tuesday was a crowd level 8, and eventually that dropped all of the way to a crowd level 3 on Sunday. Then back up to a 6 on Monday. Day of week is becoming an increasingly important (at least during the summer) predictor of crowds. Keep this in mind if you’re traveling any time before Halloween parties start … in August.
Performance of Crowd Level Predictions
Each week, I’m giving you a very transparent look into how our crowd level predictions performed. Each day at each park is one data point, so this week we have 28 different crowd level predictions to evaluate each week. Any time a prediction is within one or two crowd levels, things won’t really “feel” much different than what we predicted. Being off by 3 or more crowd levels is where we’d like to be more accurate because you might feel that difference in wait times throughout the day.

In the past week, Touring Plans predictions were either spot-on or within 1 crowd level 50% of the time. A smidge better than last week! 82% of the time Touring Plans predictions were within 2 crowd levels, and that means we earn a B- for our predictions this past week. That’s the best we’ve seen in … at least a month. And that’s because only just now are crowds starting to get back close to what we would expect for this time of year. Mostly. Kinda. Even still, predictions are definitely still skewed. Only one park day in the past 7 days was underestimated by 2 or more crowd levels. That’s compared to the 13 park-days that were overestimated by 2 or more crowd levels. Not great. The biggest miss of the past week over-predicted crowds by “just” 4 crowd levels. That happened at Hollywood Studios on June 14th and 17th, when Touring Plans predicted crowd levels 9 and 8, and they ended up being crowd level 5 and 4 days, respectively.
Attraction Downtime 6/13 – 6/19
If we average out all of the capacity lost due to unexpected downtime over the past week, it comes out to 3.7% of attractions unexpectedly being down. Back down a little from the big uptick we saw last week. Yay! The park with the biggest issues was Animal Kingdom, with 5% of its capacity lost due to unexpected downtime. This is starting to become a recurring trend. When we started these posts, Animal Kingdom was regularly the most reliable park. And now it is somewhat regularly finding itself at the bottom of the list instead.
The worst day for attraction downtime in the past week was on June 16th. On that day, 7% of all capacity at WDW was lost due to unexpected downtime. The worst park-day of the week was at Animal Kingdom on June 15th. On that park day, 12% of the capacity at the park was lost due to unexpected downtime. Animal Kingdom was open for 11 hours on the 16th, so 12% downtime is the equivalent of the whole park being down for almost 80 minutes. Not as bad as last week, but … not good.
Attraction Downtime
The worst offender of the past week was DINOSAUR, which was unexpectedly down for approximately 12% of the past week. The worst day for the dinosaurs was on June 15th, when they were unexpectedly down for 64% of the day. In fact, it didn’t really come up for the day until around 10:30 am and then it went back down at 3:15 pm and didn’t come back up until an hour and a half after the park opened on the 16th.
Rope Drop Downtime
Here are this week’s problematic offenders:
- Magic Kingdom: Pirates of the Caribbean (unavailable for 30% of its first hour of the day), Haunted Mansion (unavailable for 19% of its first hour of the day)
- EPCOT: Journey Into Imagination with Figment (unavailable for 18% of its first hour of the day), Spaceship Earth (unavailable for 13% of its first hour of the day)
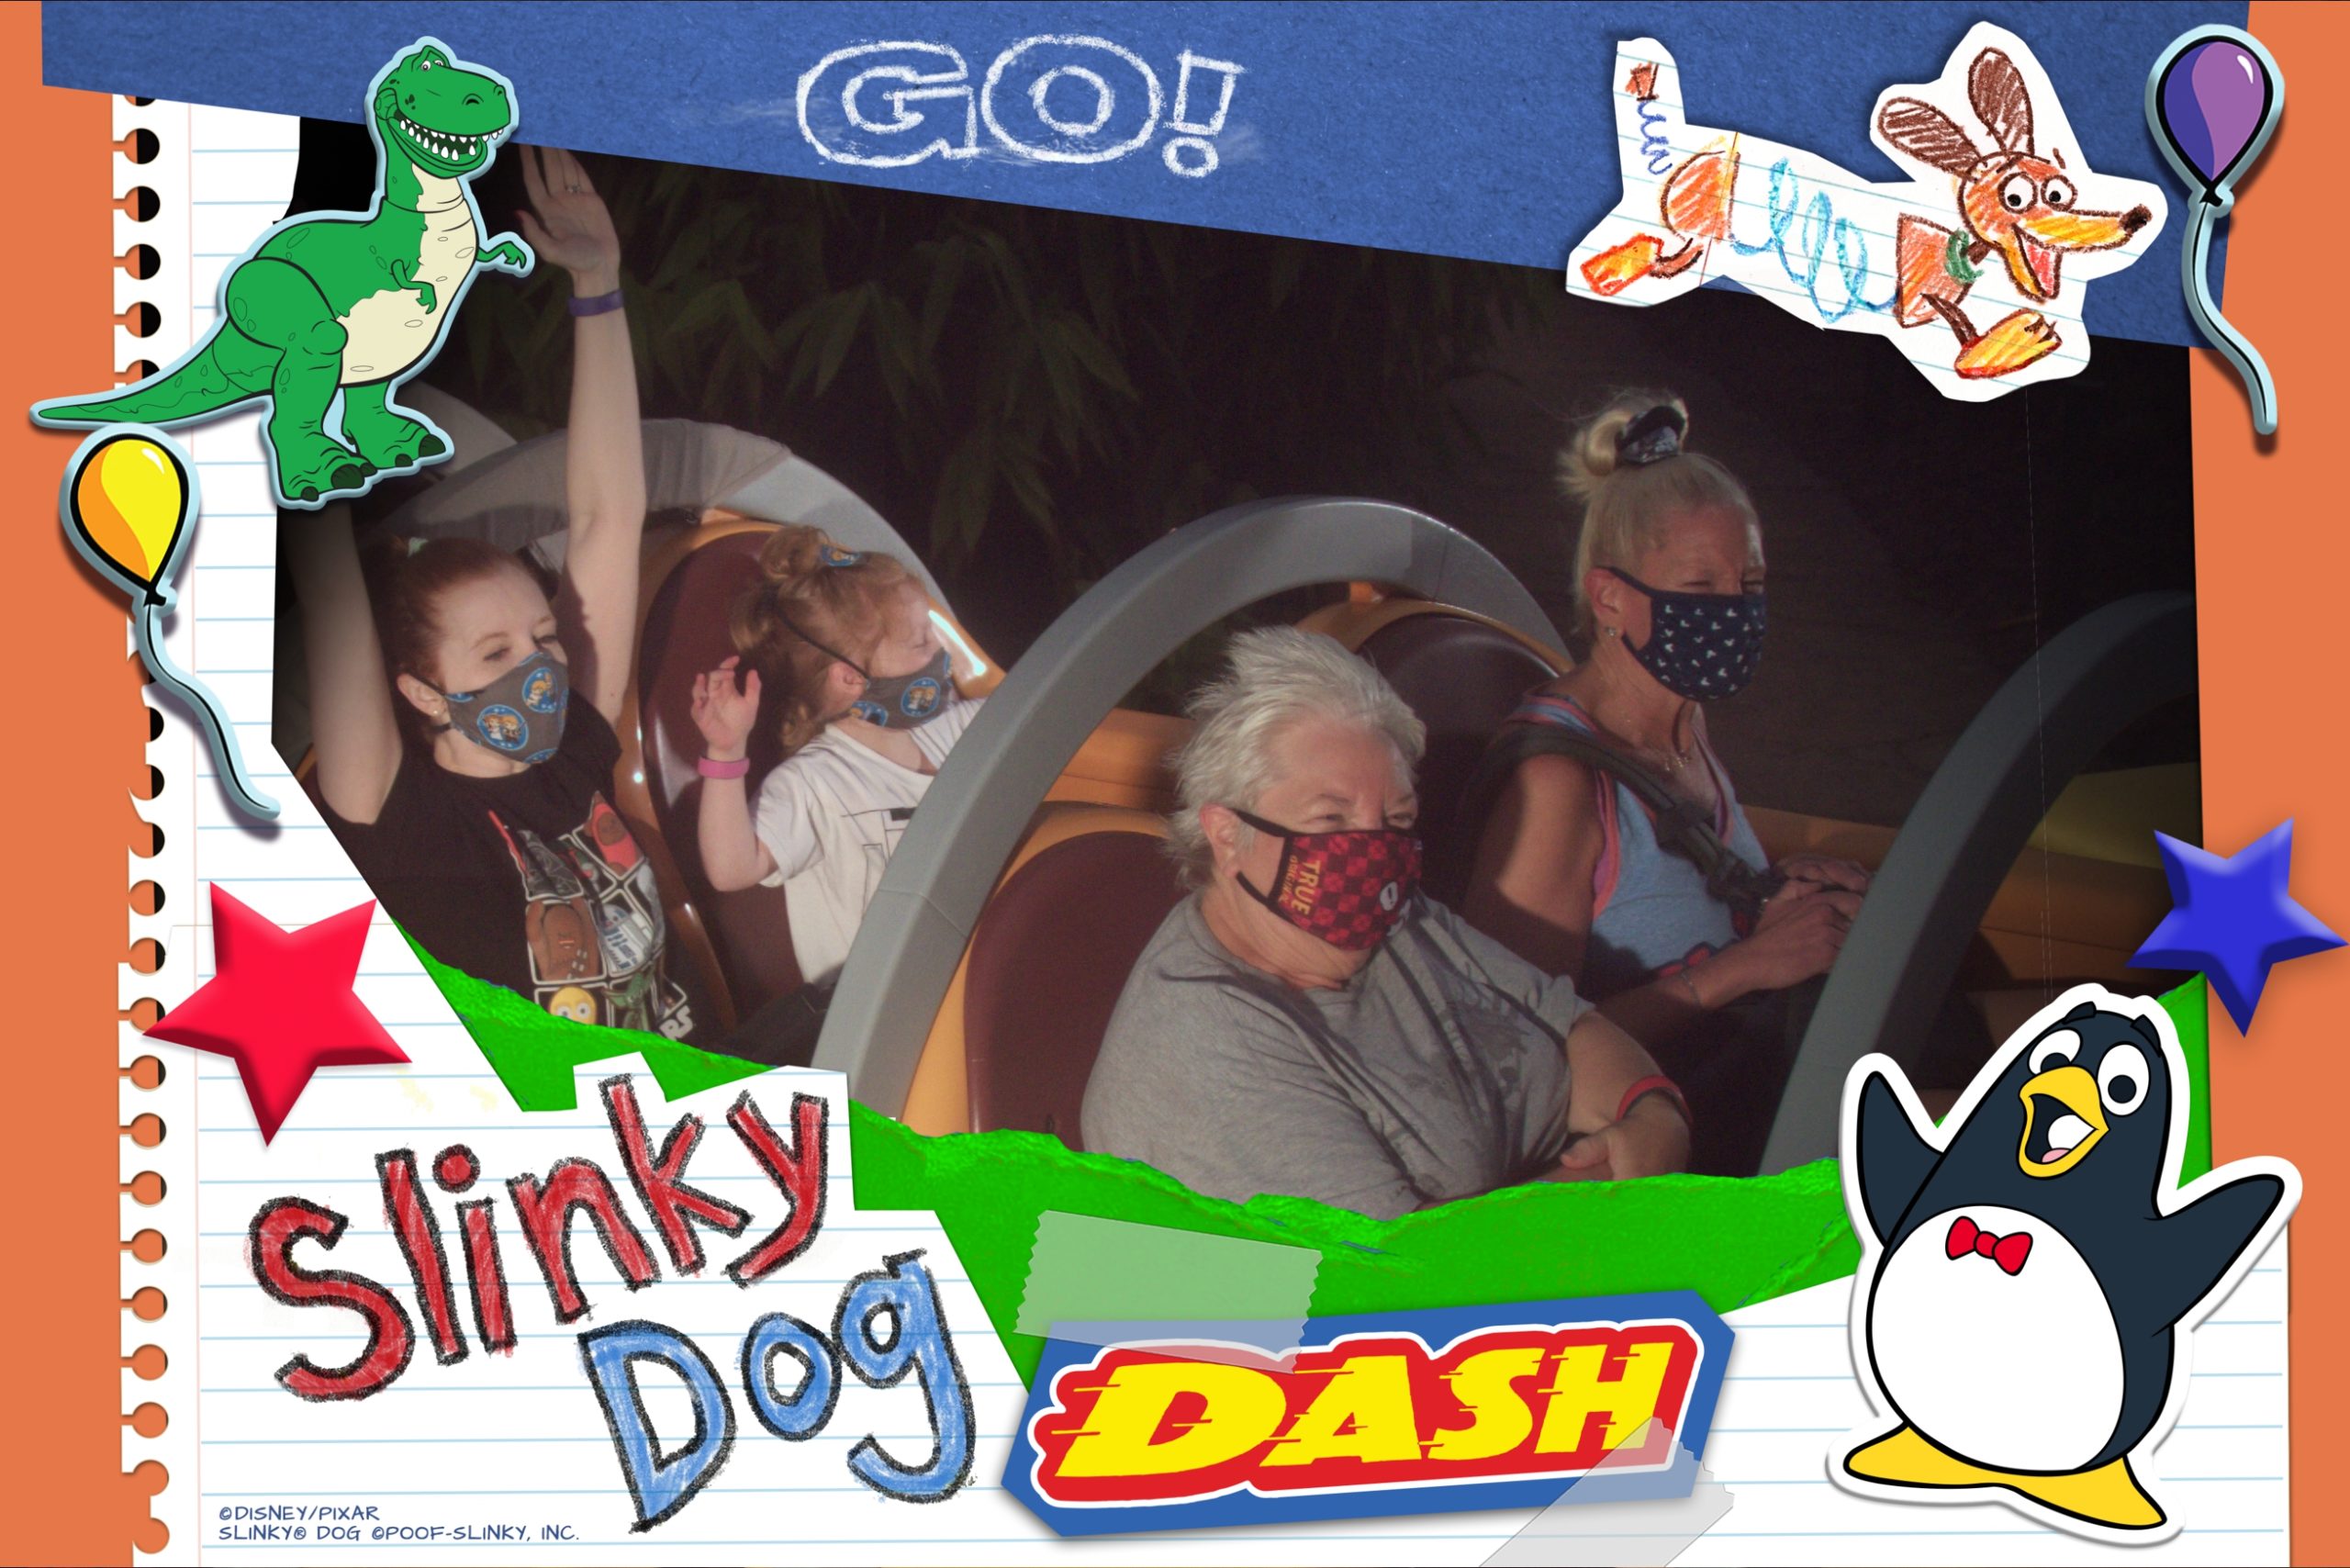
- Hollywood Studios: Millennium Falcon: Smugglers Run (unavailable for 14% of its first hour of the day), Rock’n’Roller Coaster (unavailable for 13% of its first hour of the day), Slinky Dog Dash (unavailable for 13% of its first hour of the day)
- Animal Kingdom: DINOSAUR (unavailable for 24% of its first hour of the day), It’s Tough To Be a Bug (unavailable for 14% of its first hour of the day)
An interesting mixed bag of results this week, but overall a pretty ugly week for rope drop at Walt Disney World. Figment and Spaceship Earth aren’t such a big deal. But Hollywood Studios had some headliners down, and Magic Kingdom saw a rough “second rope drop” with Pirates and Haunted Mansion both being unreliable.

Wait Times 6/13 – 6/19
Attractions with the Highest Average Posted Wait at each park
- Hollywood Studios: Slinky Dog Dash, average posted wait of 97 minutes (85 minutes last week)
- Animal Kingdom: Flight of Passage, average posted wait time of 84 minutes (88 minutes last week)
- EPCOT: Frozen Ever After, average posted wait time of 64 minutes (68 minutes last week)
- Magic Kingdom: Seven Dwarfs Mine Train, average posted wait time of 77 minutes (84 minutes last week)
Other than Slinky Dog Dash being an anomaly, we’re seeing some relaxed wait times at the most popular attractions this week. Y’all – wait times shouldn’t be decreasing. They should be heading steadily upward as we head toward July 4th and the summer peak. It will be interesting to see what happens over the next couple of weeks.
Parks with the Highest and Lowest Average Wait
These parks likely won’t change week-to-week unless something ridiculous happens, but these data points will give us a high-level view of how wait times are trending from week to week.
- Highest: Hollywood Studios, average park-wide posted wait of 40 minutes (39 minutes last week)
- Lowest: EPCOT, average park-wide posted wait of 25 minutes (26 minutes last week)
At this level too, things look remarkably similar to last week. We’re certainly not seeing a ramp up in crowds … yet.
Actual Wait Time Rock Star
The Actual Wait Time Rock Star for the past week was … Digordie95, who submitted 40 actual wait times through the Lines App over the last 7 days! This includes 4 Lightning Lane waits, 33 Standby waits, and 1 virtual queue wait. Thank you for all of that timing, Digordie95! Although you sound like you may be evil … You came pretty close to the all-time record of 50 recorded waits times in a single week, currently held by shop.kgb and ccsademko.
Looking Ahead: June 20th through June 26th
It takes some time to crunch all of the numbers, so when you’re reading this article, June 20th will already be in the past. But we’re trying to stay as timely as possible. So let’s get along with our predictions.
At this point I expect things to stay steady until we hit July and the holiday weekend. There are no special events. The afternoon thunderstorms are becoming more steady. Everyone is out of school already. With all of the recently-announced fall and holiday travel deals, it’s very apparent that bookings are light all of the way through the end of the year. So I doubt we’ll see any crazy crowds magically descending upon the parks anytime soon. Enjoy your moderately-crowded stormy summer!
Just make sure you all go home before Labor Day when my family flies in!
You May Also Like...
-

Anyone else feel like you can finally breathe a sigh of relief now that the school year is over with all…
-

We've made it through another week, Disney data fans! And as we progress through June and march toward July with its…
-

In the world of Disney Data, this week was all good news. Wait times were the lowest we've seen since mid-September…
-

What a week! Annual Passes back on sale, both Maleficents getting their fire-breathing capabilities revoked, new container-cabins announced for Fort Wilderness…