Disney Data Dump April 26 2023
What a week! Annual Passes back on sale, both Maleficents getting their fire-breathing capabilities revoked, new container-cabins announced for Fort Wilderness … and some very enjoyable low-to-moderate crowd levels. We’ve made it past the craziness of Spring Break and we’re in the lovely pre-Summer period (anyone else have 18 seasons between winter and summer like Saint Louis?). Let’s take a look at just how lovely it was in Orlando this past week.
Observed Crowd Levels 4/18 – 4/24

Now if that little string of light colors doesn’t scream late spring at Walt Disney World, I don’t know what does! The period in-between spring break season and the end of the school year is always a pretty chill time to visit the parks. The weather is better than August/September, so you’ll see more kid-less folks choosing this time of year, which means crowd levels stay a little higher than rock-bottom. But this is what a pleasant week looks like on a crowd calendar. No one should be angry about this.

Even Hollywood Studios, our stereotypically big baddie when it comes to wait times and crowd levels, had a couple of very rare green crowd days! We had one small string of crowd level 4 days back in early March, but otherwise we don’t find yellows and greens like this unless we rewind all of the way back to mid-September.

Each week, I’m giving you a very transparent look into how our crowd level predictions performed. Each day at each park is one data point, so this week we have 28 different crowd level predictions to evaluate each week. Any time a prediction is within one or two crowd levels, things won’t really “feel” much different than what we predicted. Being off by 3 or more crowd levels is where we’d like to be more accurate because you might feel that difference in wait times throughout the day.
In the past week, Touring Plans predictions were either spot-on or within 1 crowd level 50% of the time. This is still lower than the historical average, but significantly better than last week! 79% of the time Touring Plans predictions were within 2 crowd levels, and that means we earn a C+ for our predictions this past week. Predictions were very skewed this week. Rather than having a roughly equal number of over- and under-predictions, all predictions were over-predictions. These are the kind that make people happy because the parks are less crowded than they expect, but any skewed results make stats people like me a little sad inside. The biggest misses of the past week all over-predicted crowds by 4 crowd levels. That happened at EPCOT on April 18th and 23rd, and at Hollywood Studios on April 19th.
Attraction Downtime 4/18 – 4/24
If we average out all of the capacity lost due to unexpected downtime over the past two weeks, it comes out to 3.4% of attractions unexpectedly being down. This is just a little bit higher than what we saw last week, and pretty similar to two weeks ago. And the park with the biggest issues was Animal Kingdom (what?!), with 4.7% of its capacity lost due to unexpected downtime.
The worst day for attraction downtime in the past week was on April 19th. On that day, 6% of all capacity at WDW was lost due to unexpected downtime. The worst park-day of the week was at Animal Kingdom on April 19th. On that park days, 11% of the capacity was lost due to unexpected downtime. Animal Kingdom was open for 11 hours on the 19th, so 11% downtime is the equivalent of the whole park being down for almost an hour and 15 minutes. Thankfully, this didn’t have a huge impact on wait times, because Animal Kingdom was still only a crowd level 3 that day.
Attraction Downtime
The worst offender of the past week is a relatively rare one for us – Frozen Ever After, which was unexpectedly down for approximately 12% of the past week. This is a pretty low “worst” downtime percentage compared to past weeks, but it’s never a good sign when a big headliner ride is down the most. The worst day for our Frozen friends was on April 20th, when it was unexpectedly down for 26% of the day. And this was closely followed by April 19th, when it was down for another 24% of the day. It didn’t have a really stable day until April 24th, when it didn’t experience any downtime. Yay!

Rope Drop Downtime
Here are this week’s problematic offenders:
- Magic Kingdom: Pirates of the Caribbean (unavailable for 17% of its first hour of the day), it’s a small world (unavailable for 14% of its first hour of the day)
- EPCOT: Frozen Ever After (unavailable for 19% of its first hour of the day), Test Track (unavailable for 17% of its first hour of the day)
- Hollywood Studios: No rope drop downtime issues this week, whaaaaaaaaaat
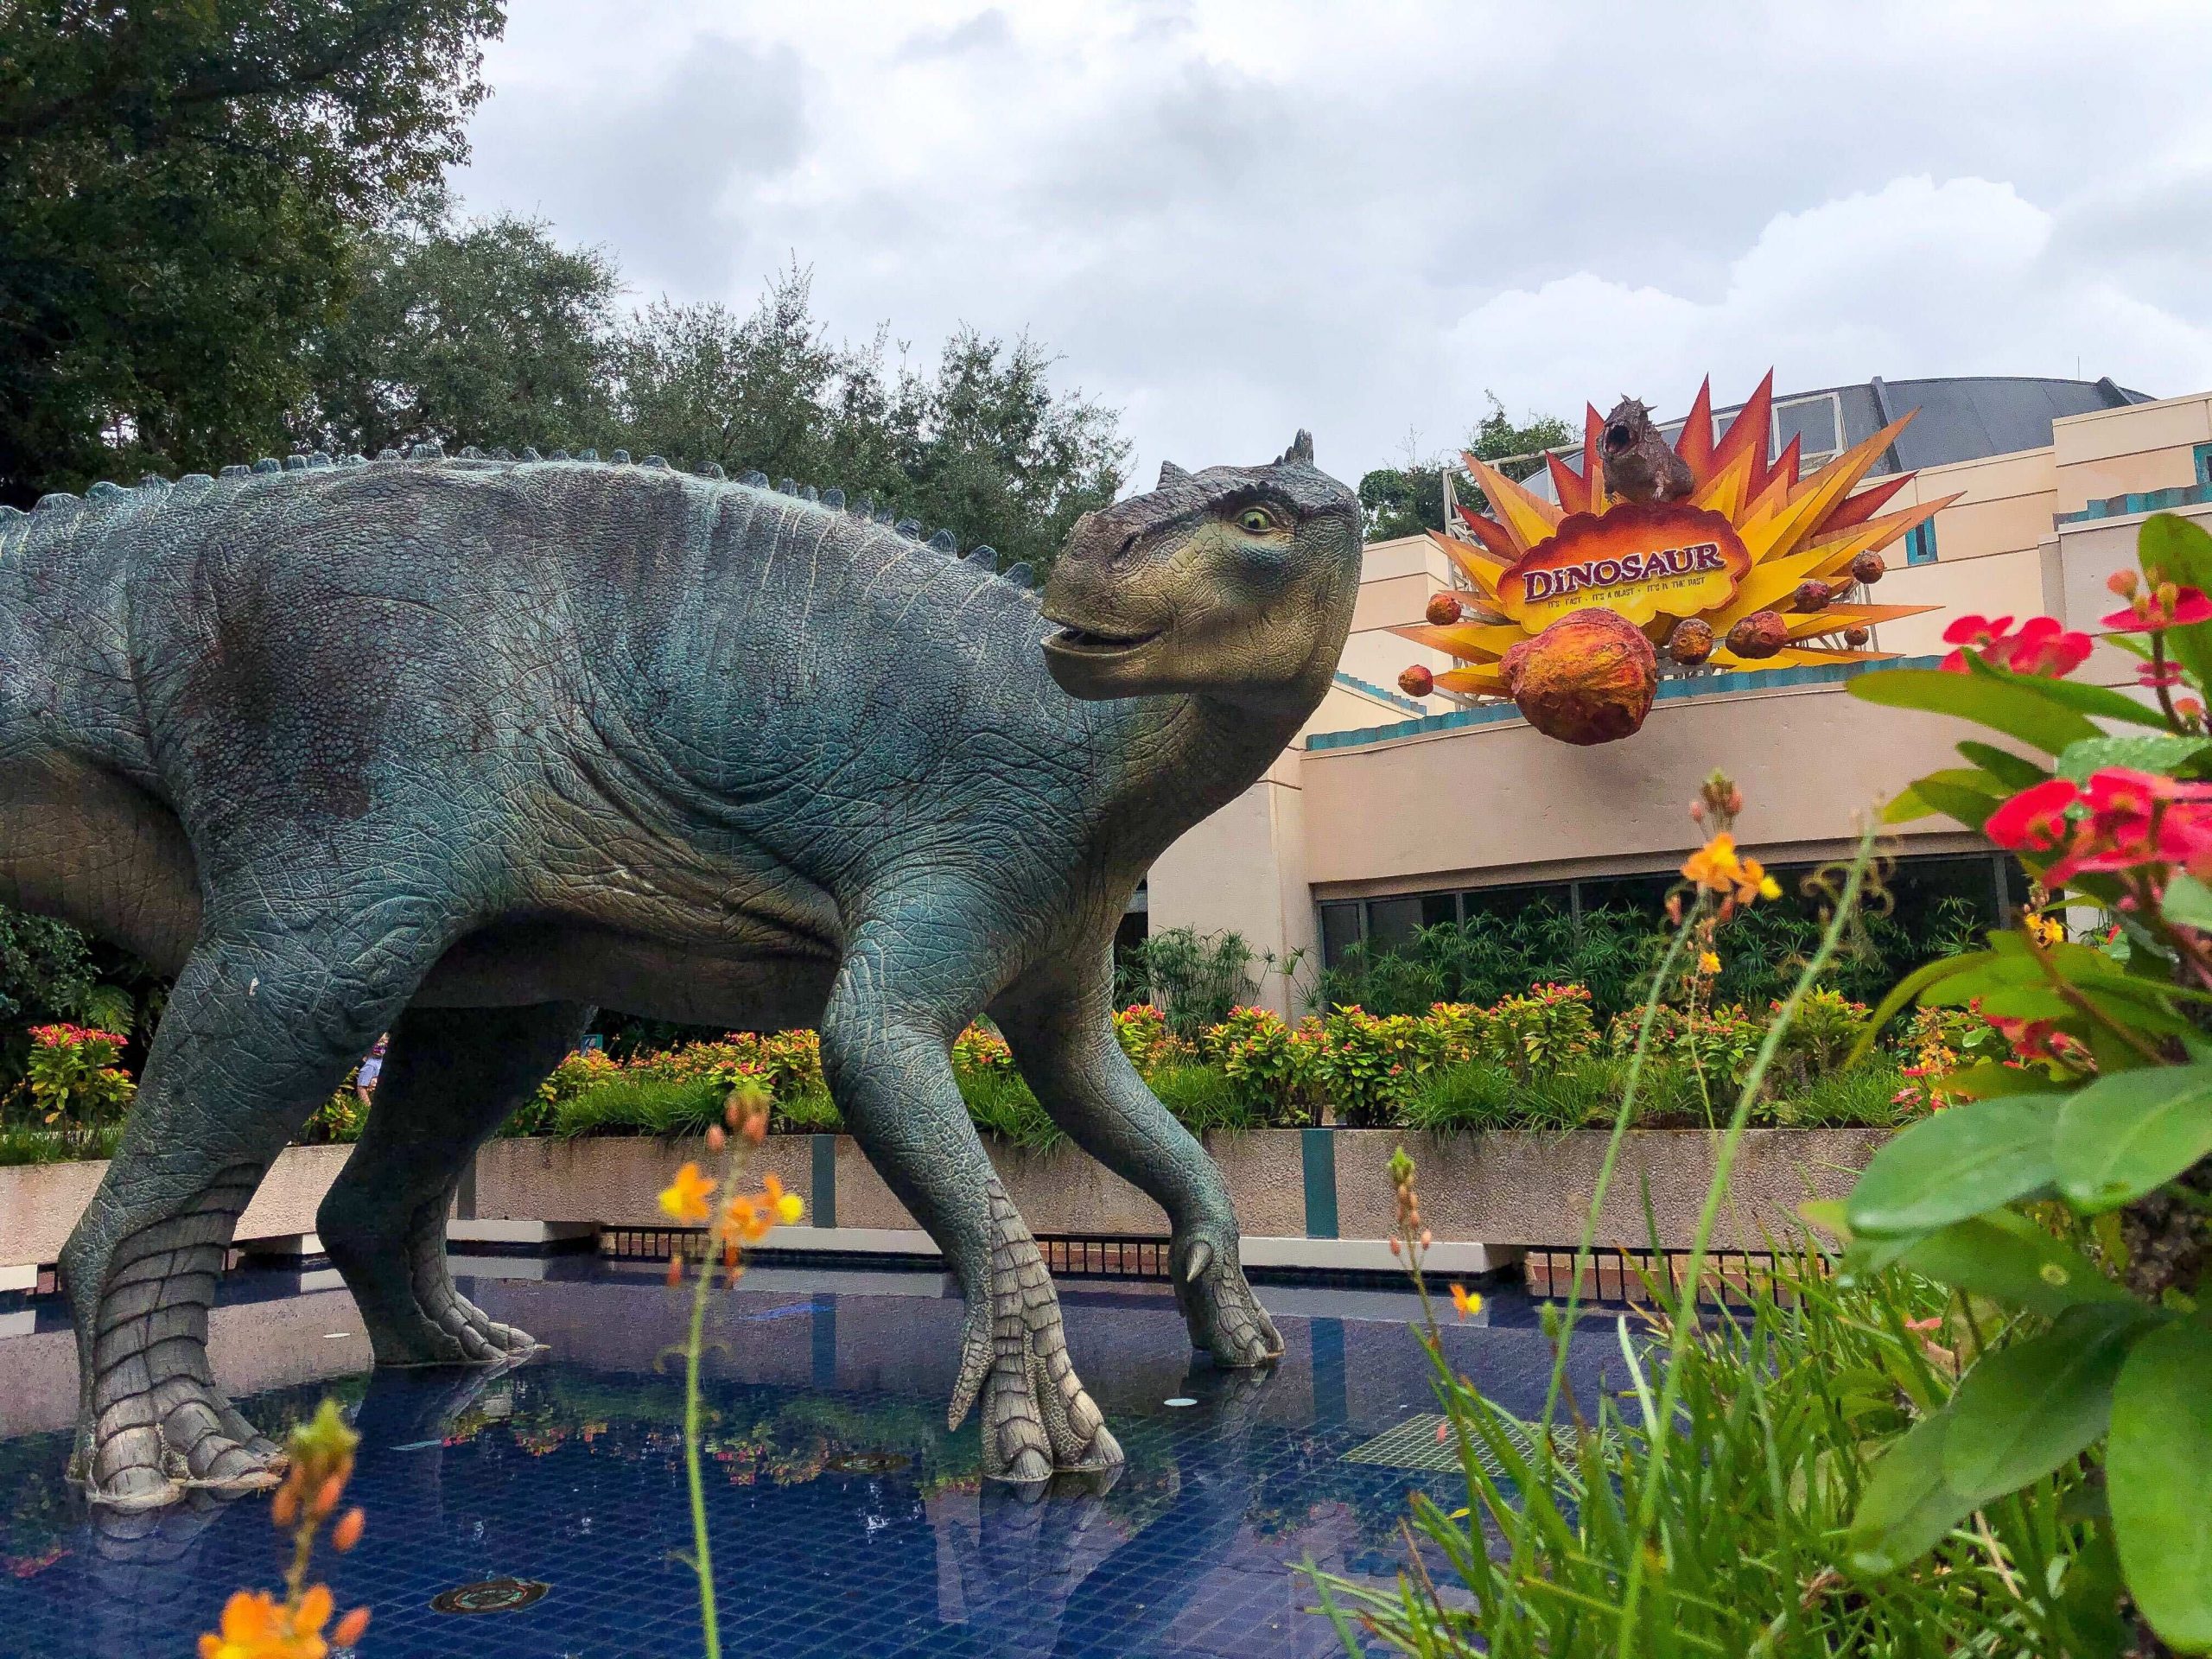
- Animal Kingdom: DINOSAUR (unavailable for 14% of its first hour of the day), Kali River Rapids (unavailable for 13% of its first hour of the day), Expedition Everest (unavailable for 13% of its first hour of the day)
First, let’s give credit where credit is due. There has never been a week where Hollywood Studios hasn’t had any entries on the rope drop downtime list. This is the best kind of nonsense ever. Hopefully if you rope dropped Studios you had a great time! The only park with significant problems was EPCOT, where two out of the three good rope-drop options had more than 15% downtime.
Wait Times 4/18 – 4/24
Attractions with the Highest Average Posted Wait at each park
- Hollywood Studios: Slinky Dog Dash, average posted wait of 81 minutes (96 minutes last week)
- Animal Kingdom: Flight of Passage, average posted wait time of 81 minutes (93 minutes last week)
- EPCOT: Remy’s Ratatouille Adventure, average posted wait time of 62 minutes (71 minutes last week)
- Magic Kingdom: Seven Dwarfs Mine Train, average posted wait time of 72 minutes (89 minutes last week)
We’re continuing to see wait times go down from those Spring Break and Easter highs! Having Flight of Passage come in under 90 minutes is a big win, and we’ve almost got Remy below an hour (where it should rightfully be, but I digress …)
Parks with the Highest and Lowest Average Wait
These parks likely won’t change week-to-week unless something ridiculous happens, but these data points will give us a high-level view of how wait times are trending from week to week.
- Highest: Hollywood Studios, average park-wide posted wait of 34.5 minutes (40 minutes last week)
- Lowest: EPCOT, average park-wide posted wait of 23 minutes (26.5 minutes last week)
Another big win here with EPCOT going below 25 minutes, and Hollywood Studios edging closer to the half hour mark. I don’t think it’ll dip below there, at least until September (if then). But an average of 34.5 minutes is MUCH better already than the 50 minute average we saw just two weeks ago.
Most Inflated Posted Wait Times
We all know that Disney inflates their posted wait times on purpose. They have many reasons for doing this. Some are totally understandable, and some are potentially more problematic. We can figure out how much posted wait times are being inflated by comparing submitted actual wait times from the Lines App and the posted wait time when the person timing their wait entered the line.
Over the past week, actual wait times in the Lines App averaged 62% of what was posted. This is WAY lower than our historical average, which means posted wait times are more inflated than normal. If the posted wait time was 60 minutes, you could’ve expected to wait under 35 minutes instead.
But the worst offender for the past week is … wait for it … Seven Dwarfs Mine Train. Another first time winner! At this one attraction, submitted actual wait times were just 38% of posted wait times in the past week. 38%. What?! That means that if Seven Dwarfs Mine Train had a 90 minute posted wait, you probably would’ve waited just under 35 minutes. Much, much less than half of what was posted. Remember to always check the Lines app for predicted actual waits instead of believing what is posted.

Actual Wait Time Rock Star
The Actual Wait Time Rock Star for the past week was … mbcollins, who submitted 34 actual wait times through the Lines App over the last 7 days! This includes 22 Lightning Lane waits (I’m sad no one caught my FastPass easter egg last week), 11 Standby waits, and 1 Virtual Queue wait. Thank you for all of that timing, mbcollins! But you didn’t claim the all-time record, which is still held by shop.kgb, with 50 recorded wait times in a single week.
Virtual Queue wait times would be helpful in the upcoming week, at both locations where it is offered!
Looking Ahead: April 15th through May 1st
Whoa, when did we enter almost-May? Not to worry – we’re still in the glorious post-Spring Break, pre-Summer period of low crowds. The weather is better in late spring than in the August/September low-crowd season, so more school-schedule-free folks will opt to travel now rather than the late summer or early fall. So crowds won’t totally bottom out, but they should stay in this 4-6ish range for the next few weeks.
Otherwise, there should be no surprises this week. No special events. Regular park hours. Enjoy a predictably low-moderate week!
You May Also Like...
-

Just when you think we've made it through Spring Break season! The weather is getting warmer. The kids are getting antsy…
-

Let's cut to the chase. We're in that beautiful time of the year where spring holidays are over and school is…
-

Welcome to a very special, and hopefully one-time-only, edition of the Disney Data Dump! This article was supposed to go out…
-

We've thankfully had a much calmer week at Walt Disney World compared to the past few. Yes, Genie+ prices are still…