
Disney Data Dump October 14 2026
Observed Crowd Levels October 6 – 12
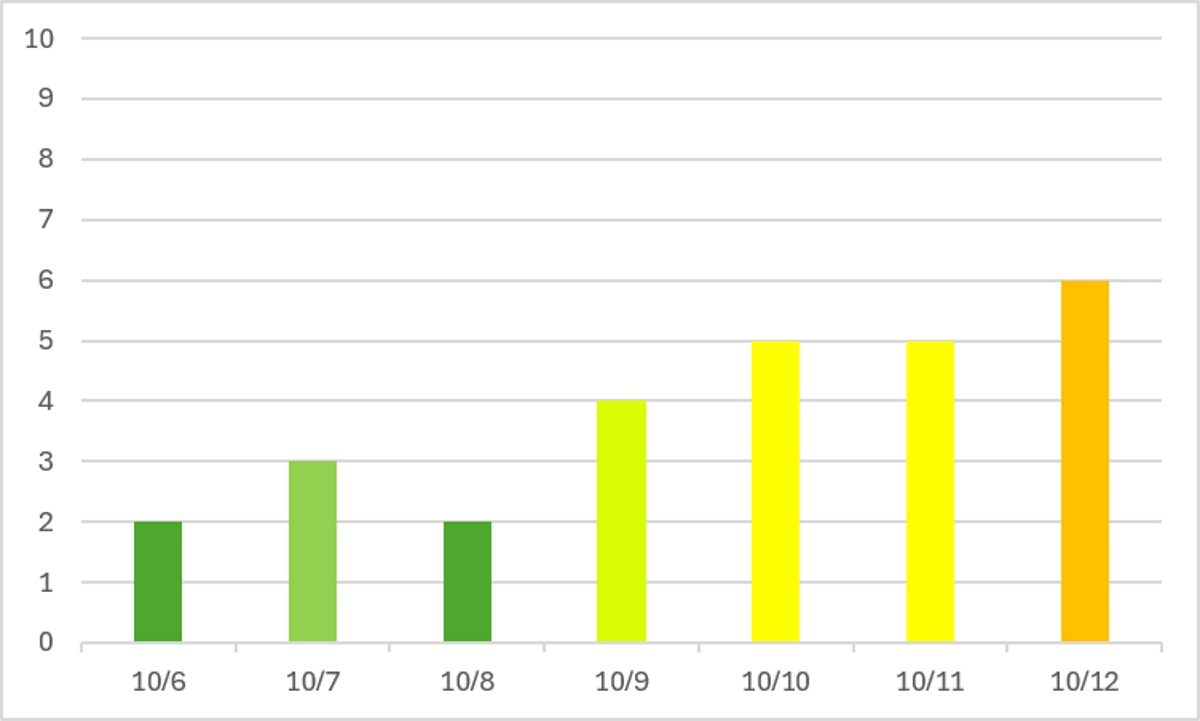
Well, hello there, fall break! It felt like a long time since I’ve used an orange-ish bar, and then I went back and looked … the last time we had a crowd level higher than 5 was on April 10th! A full 6 months ago. That’s a wild stretch of half of the year being solidly below average crowds. I’ll take it! But fall break has definitely arrived now.
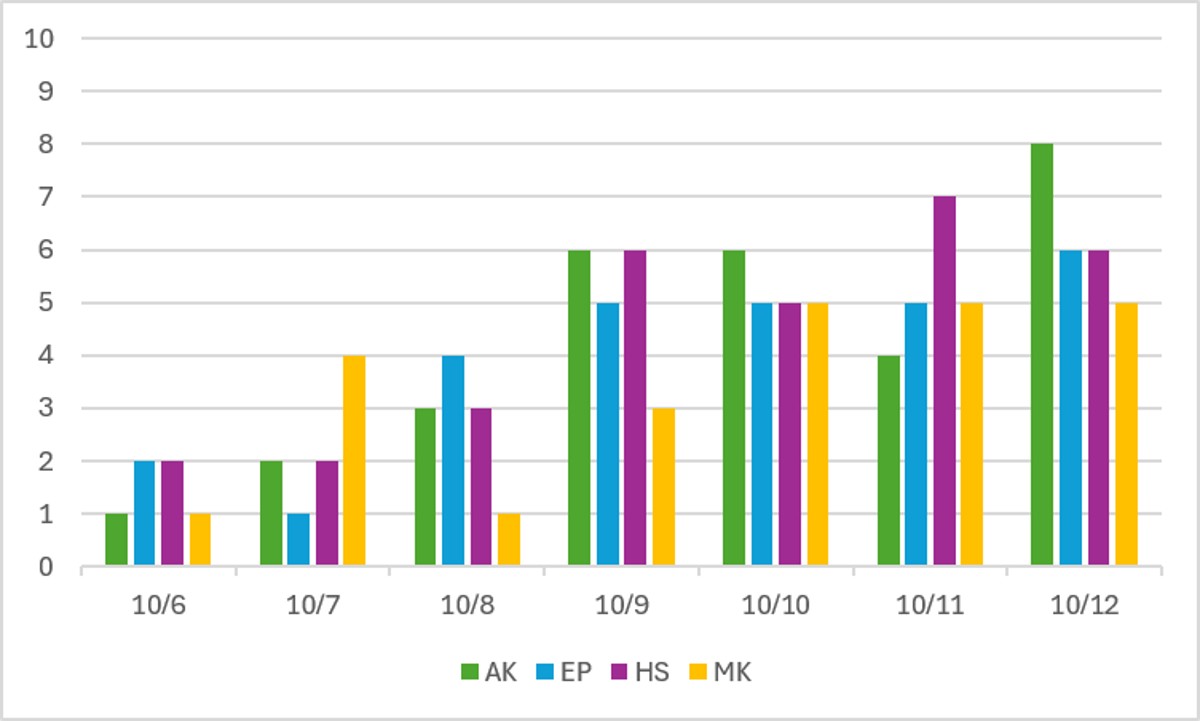
At the park level, the increase in crowds is even more obvious. From the 6th, where every park was very uncrowded, to the 10th-through-12th, when no park got below a crowd level 5. And Animal Kingdom even hit an 8! Any time there is a weekend (or long weekend), Animal Kingdom gets overrun with locals out to enjoy the vibes. And with so little attraction capacity, wait times skyrocket easily.
Magic Kingdom didn’t have a Halloween party over the long weekend, but all of those non-party days stayed nice and crowded.
Performance of Crowd Level Predictions
Each week, I give you a very transparent look into how the TouringPlans crowd level predictions performed. Each day at each park is one data point, so each week we have 28 different crowd level predictions to evaluate. Any time a prediction is within one or two crowd levels, things won’t really “feel” much different than what was predicted. Being off by 3 or more crowd levels is where you might feel that difference in wait times throughout the day.
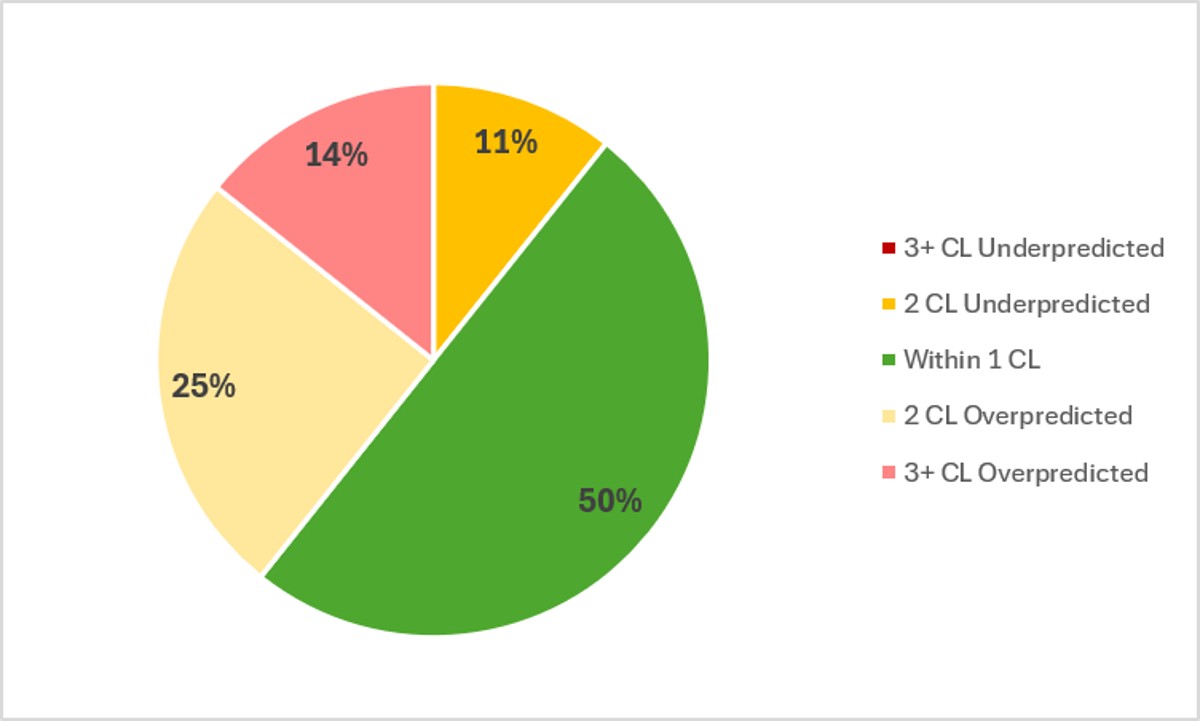
In the past week, Touring Plans predictions were either spot-on or within 1 crowd level 50% of the time, which is slightly lower than the results we’ve been seeing since the beginning of September. And 86% of the time Touring Plans predictions were within 2 crowd levels, so that’s a B on predictions for the last week. There were more 3.5x more overpredictions than underpredictions, which means overall the parks were less crowded than expected. There was a hurricane in the gulf that led to lots of rain in Florida, which means lower wait times for those who are still willing to brave the weather. The biggest miss of the week was on October 7th at Magic Kingdom, when the predicted crowd level was 8, but the actual only got to a crowd level 4.
Attraction Downtime October 6 – 12
If we average all of the capacity lost due to unexpected downtime over the past week, it comes out to 5.9% of attractions unexpectedly being down. A full percentage point higher than any of the past three weeks, mostly due to all of that rain! And over the past week, EPCOT was the park with the worst overall downtime (by far), averaging 10.1% of its capacity lost to downtime. The next-highest park downtime was Animal Kingdom, at “just” 6.4%.
The worst day for attraction downtime in the past week was on October 9th. On that day, 8% of all capacity at WDW was lost due to unexpected downtime. But the worst park-day of the past week was on October 7th, at EPCOT, when 14% of its capacity was lost due to unexpected downtime. After a month of low “winning” numbers here, this is a pretty bad one. EPCOT was open for 12 hours on the 7th, so 14% downtime is the equivalent of the entire park shutting down for almost 101 minutes. Imagine some rain rolling in and Disney deciding to just shut the entire park down from 2 pm until 3:41 pm. Not fun.
Attraction Downtime Worst Offender
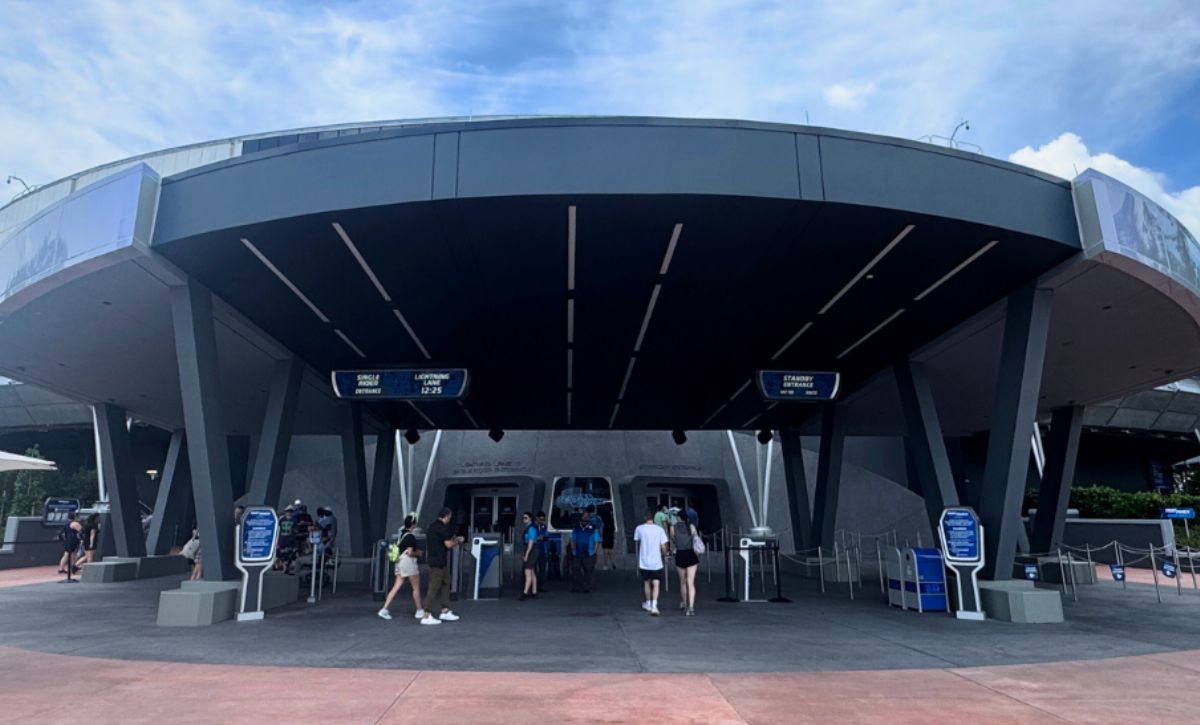
Let’s all guess the top downtime offender of the week. Ready??? Say it together – Test Track! Unfortunately, Test Track was unexpectedly down for 48% of the past week. That’s one of the worst results we’ve seen, ever! After I just gave it a shoutout for having such a low downtime percentage last week. Rude. Its worst day of the past week was on October 7th, when it was down for … the entire day. But it was also down for more than two-thirds of the 8th AND almost two-thirds of the 6th.
No other attractions this week had downtime over 20%! Hooray!
Rope Drop Downtime
Here are problematic offenders from the past week, with the percentage of downtime during the first hour of the day in parentheses:
- Magic Kingdom: Big Thunder Mountain (35%), Haunted Mansion (28%), Tron (12%), Space Mountain (12%), Seven Dwarfs Mine Train (10%)
- EPCOT: Spaceship Earth (30%), Test Track (26%), Remy’s Ratatouille Adventure (12%)
- Hollywood Studios: Slinky Dog Dash (32%), Rise of the Resistance (21%), Rock’n’Roller Coaster (15%)
- Animal Kingdom: Expedition Everest (36%), Kilimanjaro Safaris (13%)
It wasn’t the worst rope drop week, so that’s something? But there a lot of headliners on the list at Magic Kingdom and Hollywood Studios this week. Spaceship Earth is also a bigger deal at rope drop because so many regular-entry guests line up for it before the park opens since that’s the only area of the park they’re allowed to wait in.
Wait Times October 6 – 12
Attractions with the Highest Average Posted Wait at Each Park
- EPCOT: Cosmic Rewind, average posted wait of 88 minutes (was 74 minutes last week)
- Hollywood Studios: Slinky Dog Dash, average posted wait of 75 minutes (was 52 minutes last week)
- Magic Kingdom: TRON, average posted wait time of 72 minutes (was 46 minutes last week)
- Animal Kingdom: Flight of Passage, average posted wait time of 60 minutes (was 41 minutes last week)
Now this is how we see the arrival of fall break! Yes, those pretty column graphs at the top show the gradual arrival of more people into the parks with increasing crowd levels. But how does that impact your waits? HUGE wait time increases at all headliners compared to last week. In fact, last week there was only one attraction in all of WDW with an average posted wait of over an hour (Cosmic Rewind). This week there were SIX (three were at EPCOT). That makes a huge different in how you can tour the parks.
Parks with the Highest and Lowest Average Wait
- Highest: Hollywood Studios, average park-wide posted wait of 37 minutes (was 28 minutes last week)
- Lowest: Magic Kingdom, average park-wide posted wait of 20.5 minutes (was 17.5 minutes last week)
This is another great way to look at the impact of fall break on your planned park days. The average wait time at Hollywood Studios was up 9 minutes week-over-week. You’d be waiting 32% longer for EVERY attraction in the park this week compared to last week. Eep! Expect more of these crowd and wait time surges as we continue throughout the fall.
Most Inflated Posted Wait Times
We all know that Disney inflates their posted wait times on purpose. They have many reasons for doing this. Some are totally understandable, and some are potentially more problematic. We can figure out how much posted wait times are being inflated by comparing submitted actual wait times from the Lines App and the posted wait time when the person timing their wait entered the line.
Over the past week, actual wait times in the Lines App averaged 78% of what was posted. That’s quite a bit above our historical average in the era of Lightning Lanes, which means that wait times were less inflated than normal. Hooray! Overall, if the posted wait time at a popular attraction was 60 minutes, you could’ve expected to wait less than 47 minutes instead.
But the worst inflation offender for the past week was Gran Fiesta Tour. At this one attraction, submitted actual wait times were only 36% of posted wait times in the past week. That means that if those three caballeros had a 10 minute posted wait, you probably would have actually only waited about 3.5 minutes instead. About a third of what was posted!

This Week’s Wait Time Rock Star
Between October 6th and 12th we had just over 750 timed actual waits submitted through the Lines app. And the person who recorded the most actual waits during that time was MatM, with 20 overall timed waits – 19 standby waits and one single rider wait. Thanks for all of that timing, MatM! It unfortunately does not compete with the the 97 timed waits in a single week from our current timing champion, preef.
Looking Ahead: October 13 – 19
I write this article on Tuesday evenings so that you all have the very freshest of data on Wednesdays. That means the 13th will already be in the past by the time you’ve read this, so we’re time travelling together!
We’re ramping up into Halloween party season, and Disney has to make up for no parties over the long weekend, so we have FOUR parties in the upcoming week – on October 13th, 15th, 16th and 18th. There is also a party on the 20th, which isn’t during this week, but will impact crowds on the 19th. Clearly October 14th and 17th will be crowded at Magic Kingdom, because we are in fall break week, and they’re each surrounded by three party nights. Please do yourself a favor and don’t go to Magic Kingdom on those evenings if you can avoid it!
We should have a few days of sun this week, as Florida tries to work its way out of storms-every-afternoon season. But you should still be prepared for some showers, especially on the 16th.
Were you in the parks this past week? Or are you headed to Orlando soon? Let me know in the comments below!
