
Disney Data Dump September 2 2026
The one where late August decided that “low crowds” still wasn’t low enough. This week gave us the least-crowded day Walt Disney World has seen in an entire year, with extraordinarily low waits across all four parks. Magic Kingdom averaged just 15.5 minutes for the whole week, Animal Kingdom wasn’t far behind, and even some of the biggest headliners posted numbers that look almost fictional by normal Disney standards.
And somehow, all of that happened during a terrible week for attraction reliability. Storms pushed resort-wide downtime well above normal, Slinky Dog Dash was unexpectedly closed for 41% of the week, and the rope drop naughty list is … extensive. So this week we’ve got a fascinating combination: some of the worst downtime of the summer, paired with crowds so low that it frequently just didn’t matter.
Observed Crowd Levels August 25 – 31
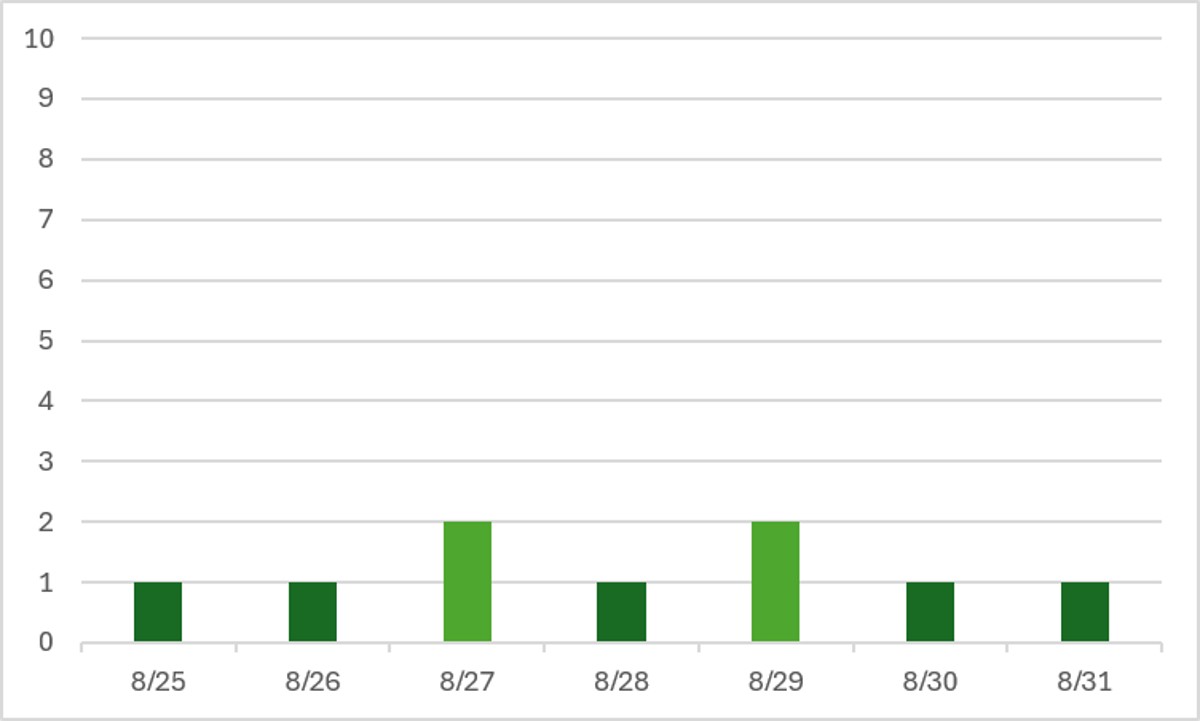
It doesn’t get much better than that, folks. There are uncrowded weeks … and then there is the week we just had. Specifically, August 31st was the least-crowded day we’ve seen in an entire year.
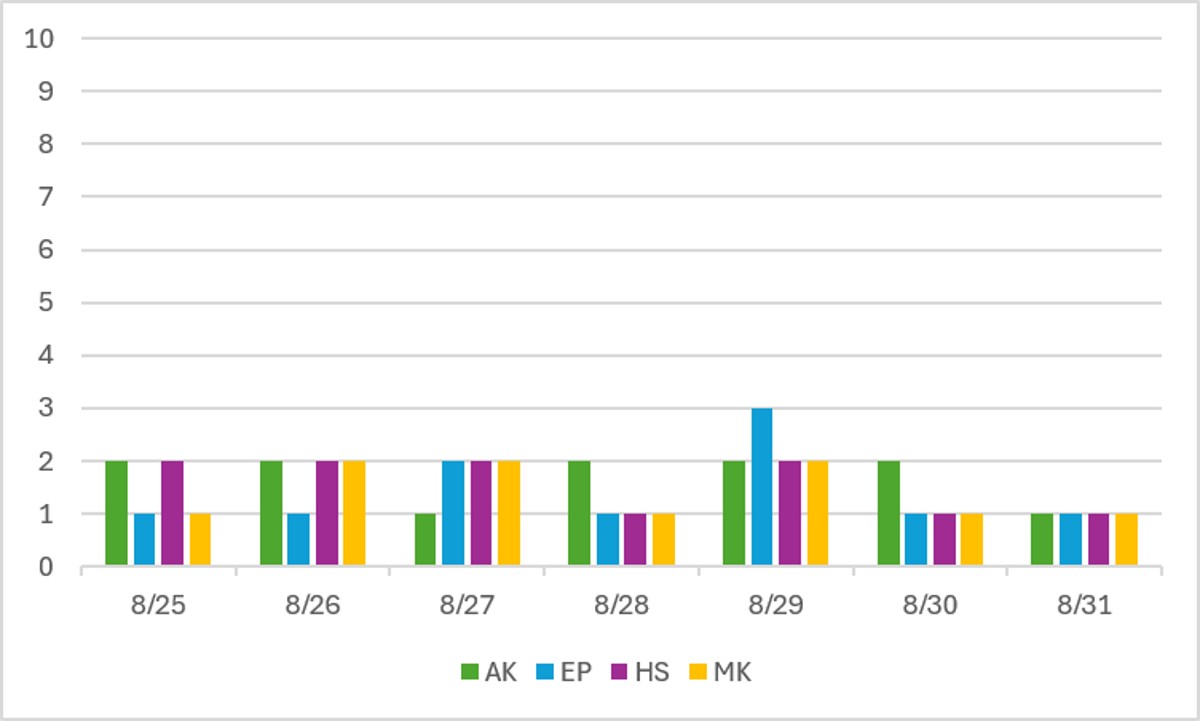
Usually when we zoom into the park level, there are at least some interesting blips, even in a low-crowd week. This week … no blips. That’s how you know that crowds are REALLY EXCEPTIONALLY low. Even the upward blips barely show up as anything. This is an incredible graph, and it shows that if you were in Disney over the past week, you picked such a great time to visit!
Performance of Crowd Level Predictions
Each week, I give you a very transparent look into how the TouringPlans crowd level predictions performed. Each day at each park is one data point, so each week we have 28 different crowd level predictions to evaluate. Any time a prediction is within one or two crowd levels, things won’t really “feel” much different than what was predicted. Being off by 3 or more crowd levels is where you might feel that difference in wait times throughout the day.
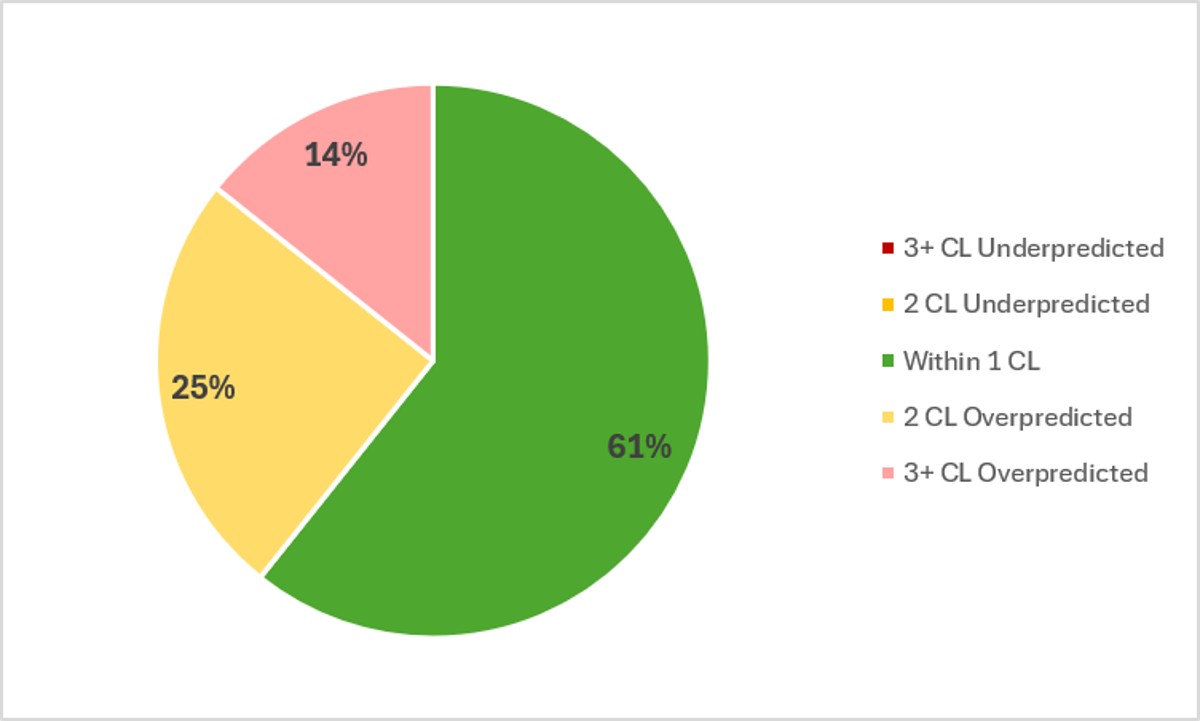
In the past week, Touring Plans predictions were either spot-on or within 1 crowd level 61% of the time, which is lower than we’ve seen over the past several weeks. And 86% of the time Touring Plans predictions were within 2 crowd levels, so that’s a solid B on predictions for the last week. Late August crowds levels are somehow even lower than the low crowds predicted. Hooray! The two biggest misses of the week were overpredictions by 4 crowd levels – both on August 30th, at Animal Kingdom (predicted 6, observed 2) and EPCOT (predicted 5, observed 1).
Attraction Downtime August 25 – 31
If we average all of the capacity lost due to unexpected downtime over the past week, it comes out to 7.2% of attractions unexpectedly being down. This is WAY over our “normal” WDW summer average – and a lot of it was thanks to significant rain storms shutting down outdoor attractions for longer than usual. Over the past week, Hollywood Studios was the park with the worst overall downtime, averaging 8.7% of its capacity lost to downtime. Unfortunately, Animal Kingdom was right behind, at 8.6% overall downtime for the week.
The worst day for attraction downtime in the past week was on August 26th. On that day, 12% of all capacity at WDW was lost due to unexpected downtime – a lot of that was thanks to 2.5 inches of rain falling after 4 pm and through the rest of the evening. It was a washout! And the worst park-day of the past week was also on the 26th, over at Animal Kingdom, when 18% of that park’s capacity was lost due to unexpected downtime. Animal Kingdom was open for 10 hours on the 26th, so 18% downtime is the equivalent of the entire park shutting down for 108 minutes. Almost 2 hours out of a 10 hour park day!
I also want to call out that Hollywood Studios had a very rare 17% downtime day on August 31st. Slinky Dog Dash was down all day, Rise of the Resistance was down for a quarter of the day, and Rock’n’Roller Coaster was down for 20% of the day. How do we know that it was still an incredibly uncrowded day at Hollywood Studios? Even with ALL of that downtime, only two attractions in the entire park had average posted waits over half an hour – Rise of the Resistance (32 minutes) and Rock’n’Roller Coaster (33 minutes). That’s ridiculous.
Attraction Downtime Worst Offender
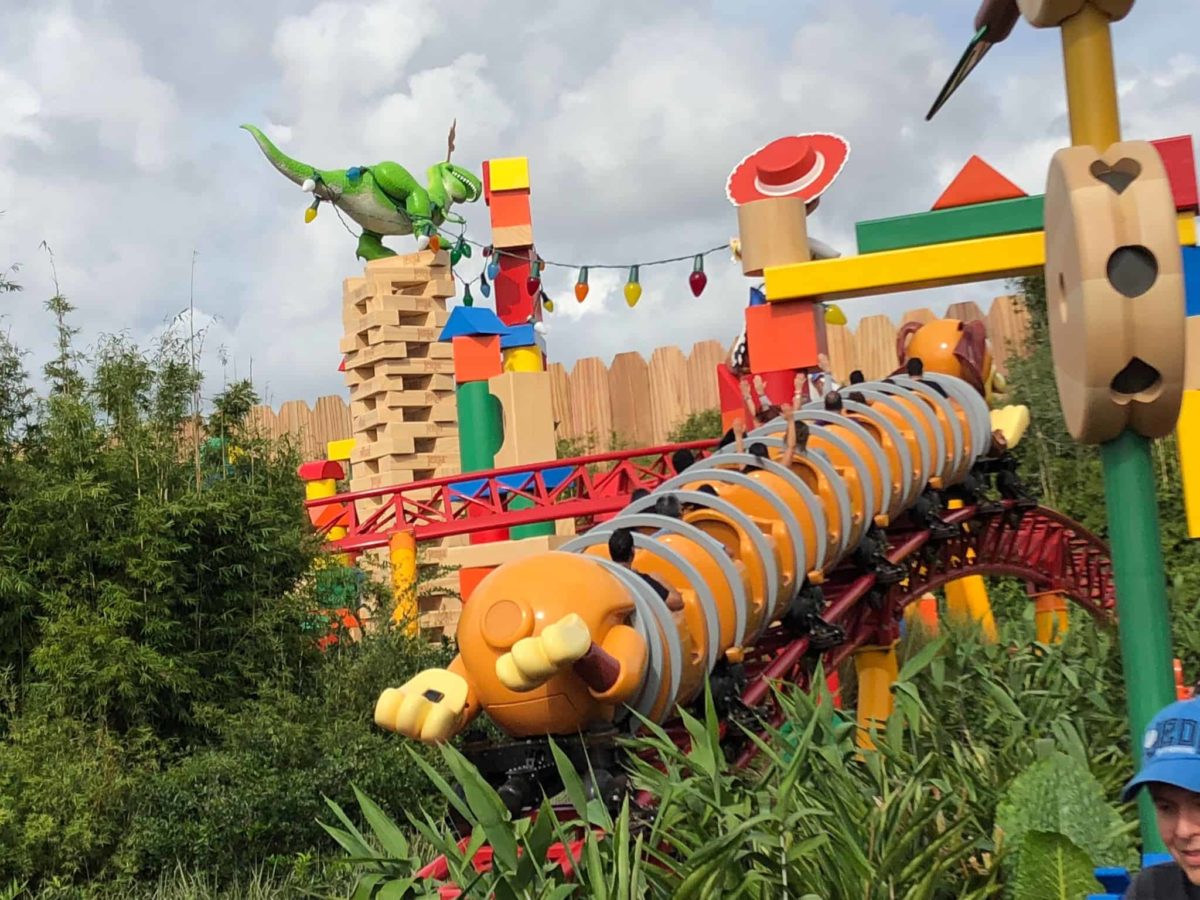
Our summer-long “champion” is dethroned for now! And in a really terrible way. Slinky Dog Dash is the attraction with the worst overall downtime this week, and it was unexpectedly down for a truly awful 41% of the week. The worst day of the week for Slinky was easily on August 31st, because like we just discussed above, it was down for the entire day. But it was also down for 75% of the 29th!
Test Track isn’t off my naughty list though – it had one of its worst downtime weeks of the summer too, with 35% of its capacity lost to unexpected downtime.
Rope Drop Downtime
Take a deep breath, prepare yourself, this is quite a list this week. Here are problematic offenders from the past week, with the percentage of downtime during the first hour of the day in parentheses:
- Magic Kingdom: it’s a small world (19%), Seven Dwarfs Mine Train (17%), Tiana’s Bayou Adventure (16%), Big Thunder Mountain (16%), Jungle Cruise (16%), Haunted Mansion (16%), Winnie the Pooh (14%)
- EPCOT: Journey Into Imagination (21%), Cosmic Rewind (20%), The Seas (17%), Remy’s Ratatouille Adventure (17%), Living with the Land (13%)
- Hollywood Studios: Slinky Dog Dash (39%), Runaway Railway (35%), Rise of the Resistance (26%), Rock’n’Roller Coaster (22%)
- Animal Kingdom: Kali River Rapids (21%), Expedition Everest (12%)
Okay, we made it through all of that. Safe to say that it wasn’t a great rope drop week this week. Thankfully, wait times were low enough that you could head to a headliner later in the day and still not have a terrible wait.
Wait Times August 25 – 31
Attractions with the Highest Average Posted Wait at Each Park
- EPCOT: Cosmic Rewind, average posted wait of 68 minutes (was 70 minutes last week)
- Hollywood Studios: Slinky Dog Dash, average posted wait of 60 minutes (was 62 minutes last week)
- Magic Kingdom: TRON, average posted wait time of 44 minutes (was 54 minutes last week)
- Animal Kingdom: Flight of Passage, average posted wait time of 36 minutes (was 52 minutes last week)
Let those headliner posted waits sink in for a minute. Only two attractions at Walt Disney World had average posted waits of over an hour in the past week. And look what happened over at Animal Kingdom!! That’s the park with the biggest swings in wait times, but when it empties out, it really empties out. 44 minutes being the average at Tron is very wild too. And Slinky Dog was only open for 59% of the past week, and it still barely cracked an hour of posted wait during the smaller number of hours that it was open.
Parks with the Highest and Lowest Average Wait
- Highest: Hollywood Studios, average park-wide posted wait of 27.5 minutes (was 35.5 minutes last week)
- Lowest: Magic Kingdom, average park-wide posted wait of 15.5 minutes (was 19 minutes last week)
This is where we see the difference between a low crowd week and a LOW CROWD WEEK. All of August has been relatively empty – with only Hollywood Studios breaking the half-hour average wait barrier. That’s low crowds. But this week, even Hollywood Studios dipped well below half an hour for average posted wait. Magic Kingdom was all of the way down at FIFTEEN MINUTES. And Animal Kingdom was at 19 minutes!!!! These are very, very, very rare results.
Most Inflated Posted Wait Times
We all know that Disney inflates their posted wait times on purpose. They have many reasons for doing this. Some are totally understandable, and some are potentially more problematic. We can figure out how much posted wait times are being inflated by comparing submitted actual wait times from the Lines App and the posted wait time when the person timing their wait entered the line.
Over the past week, actual wait times in the Lines App averaged 73% of what was posted. That’s a little lower our historical average in the era of Lightning Lanes, which means that posted waits were slightly more inflated than normal. Overall, if the posted wait time at a popular attraction was 60 minutes, you could’ve expected to wait less a little less than 44 minutes instead.
But the worst inflation offender for the past week was Dumbo. At this one attraction, submitted actual wait times were only 36% of posted wait times in the past week. That means that if Dumbo had a 10 minute posted wait, you probably would have actually only waited a little over 3.5 minutes instead. About a third of what was posted!

This Week’s Wait Time Rock Star
Between August 25th through 31st we had just over 1000 timed actual waits submitted through the Lines app. And the person who recorded the most actual waits during that time was RobHunt, with 58 overall timed waits – 6 Lightning Lane waits and 52 standby waits. Thanks for all of that timing, RobHunt! It unfortunately does not compete with the the 97 timed waits in a single week from our current timing champion, preef.
Looking Ahead: September 1 – 7
I write this article on Tuesday evenings so that you all have the very freshest of data on Wednesdays. That means the 1st will already be in the past by the time you’ve read this, so you’ve made it back to the future!
It’s a weird transition week in the Mickey’s Not-So-Scary Halloween Party schedule, which means that we only have two parties in the next seven days – on September 1st and 4th. Those should be spectacular days to be in Magic Kingdom. I’m actually writing this article around 10 am WDW time on the 1st, and the posted waits at Seven Dwarfs and Tron are 25 minutes, with everything else in the park lower. That’s an insane Magic Kingdom morning and I hope some of you were able to experience it.
We are also now out of Diet EPCOT season, but not all Food & Wine booths are open. I attended Food & Wine on opening day (and tried a whopping 81 food items and 80 beverage items from 35 of the 36 open food locations), and it was so uncrowded! Booth lines started long, but emptied out quickly. And by late in the afternoon we were walking right up to usually-popular booths like France and Canada. New booths don’t open until September 9 (Festival Favorites) and September 18 (The Wedge), so don’t expect any major shifts in demand at least until then.
It’s still afternoon thunderstorm season! Temperatures will still be high – topping out around 90 each day. But humidity will make it feel hotter, and the rain will roll through only to temporarily cool things off.
Were you in the parks this past week? Or are you headed to Orlando soon? Let me know in the comments below!
You May Also Like...
-

If you’re looking for the quietest time of year to be in Walt Disney World, here it is. The week after…
-

What we saw this past week is a really good reminder that Spring Break season isn’t one clean spike. It’s a…

Disney undoubtedly knows crowds are going to be low with dated tickets sold and AP reservations. Do you think they keep some attractions closed during early entry to save money on labor and encourage guests to stay in the parks longer?
I don’t think so. Otherwise those attractions would regularly be down, and open at predictable times.
Curious if there’s any speculation how long this lull will last? We’re heading down for an extended weekend surrounding MLK Day in January and looking at last year’s crowd calendar things were pretty slow in 2025. However, that’s not the forecast for 2026 according to the Touring Plans crowd calendar for early 2027. Is there anything like ticket and/or resort packages and prices that suggests things will continues to stay ramped up past the holiday blitz?
It won’t last that long 🙂 While 2026 does have historically low crowds, fall and winter have actually seen increasing crowds and wait times overall and more people move their trips out of the heat of summer. MLK weekend isn’t THE most crowded weekend thanks to school schedules starting back up, but it will at least have moderate crowds.